Gokul Chandrasekaran* | Gopinath Singaram | Rajkumar Duraisamy | Akash Sanjay Ghodake | Parthiban Kunnathur Ganesan
© 2021 IIETA. This article is published by IIETA and is licensed under the CC BY 4.0 license (http://creativecommons.org/licenses/by/4.0/).
OPEN ACCESS
System-on-Chip (SoC) is an integration of electronic components and billions of transistors. Defects due to the base material is caused during the manufacturing of components. To overcome these issues testing of chips is necessary but total cost increases because of increasing test time. The main issues to be considered during testing of SoC are the time taken for testing and accessibility of core. Effective test scheduling should be done to minimize testing time. In this paper, an effective test scheduling mechanism to minimize testing time is proposed. The test time reduction causes test cost reduction. The Enhanced Firefly algorithm is used in this paper to minimize test time. Enhanced Firefly algorithm gives a better result than Ant colony and Firefly algorithms in terms of test time reduction thereby reduction test cost takes place.
System-on-Chip, ant colony optimization, modified ant colony optimization, firefly algorithm, modified firefly algorithm
The foundation of modern world electronic products is the Semiconductor ICs. Almost all products and systems consist of IC. Complex ICs are introduced due to the development of semiconductor technology which is referred to as System-on-Chip (SoC). SoC consists of a large number of transistors integrated into IC. The complexity of IC is the major issue while designing SoC. To avoid this problem an IC with reusable cores is designed and verified. These cores may be designed inside or supplied from outside through core vendors. The cores are integrated into a system with the help of a system integrator. Extra defects need to be tested when the system becomes more complex. The increase in test cost also occurs due to this complexity. At the system level, individual cores are to be tested using the Test Access Mechanism (TAM) [1].
Individual cores and interconnections are also tested. For this purpose, the SoC test model is used. The major parts of the SoC test model are test scheduling, wrapper, and TAM. The thin shell surrounding the core is a wrapper acting as an interface between TAM and core. Wrappers are applied using TAM wires to test vectors. Automatic Test Equipment (ATE) stores the test vectors and these test vectors are connected to SoC via TAM wires. Test data in SoC are transported through TAM. Core and interconnections are tested in internal and external mode respectively. Three modes of SoC testing are a bypass, soft and low power mode. Test scheduling should be done effectively to reduce test time. During the core testing, the actual response is compared to the expected one and their difference gives the error. In the testing of interconnects, the on-chip engine generated test stimulus and its response could be observed. Hard cores, form cores and soft cores can be tested in three modes of testing. In the end, each individual cores need to be completed its testing [2].
ITC'02 benchmark circuits were presented at the IEEE International Test Conference (ITC). Table 1 provides information about the ITC'02 benchmark circuits. Tables 2 and 3 include information on the d695 and p22810 ITC’02 benchmark circuits.
Table 1. Benchmark circuit details
|
SOC |
d695 |
p22810 |
|
|
Number of Tests |
10 |
30 |
|
|
Number of Modules |
11 |
29 |
|
|
Number of I/Os |
1845 |
4283 |
|
|
Number of Levels |
2 |
3 |
|
|
Number of Scan Chain Length |
137 |
196 |
|
|
Number of SFFs |
6384 |
24723 |
|
|
Pattern Count |
Maximum |
234 |
12324 |
|
Minimum |
12 |
1 |
|
|
Average |
88 |
830 |
|
|
Contributor |
Duke University |
Philips Semiconductors |
|
|
Scan Chain Length |
Maximum |
55 |
400 |
|
Minimum |
46 |
1 |
|
|
Average |
32 |
126 |
|
Table 2. SoC d695 benchmark details
|
Core |
No. of Outputs |
No. of inputs |
No. of Tests Patterns |
Min Chain Length |
Internal Scan Chains |
Max Chain Length |
|
#1 |
32 |
32 |
12 |
0 |
0 |
0 |
|
#2 |
108 |
207 |
73 |
0 |
0 |
0 |
|
#3 |
11 |
34 |
75 |
32 |
1 |
32 |
|
#4 |
39 |
36 |
105 |
52 |
4 |
54 |
|
#5 |
304 |
38 |
110 |
44 |
32 |
45 |
|
#6 |
152 |
62 |
234 |
39 |
16 |
41 |
|
#7 |
150 |
77 |
95 |
33 |
16 |
34 |
|
#8 |
48 |
35 |
97 |
44 |
4 |
46 |
|
#9 |
320 |
35 |
12 |
54 |
32 |
54 |
|
#10 |
106 |
28 |
68 |
51 |
32 |
55 |
Table 3. SoC p22810 benchmark details
|
Core |
No. of Outputs |
No. of Inputs |
No. of Tests Patterns |
Min Chain Length |
Internal Scan Chains |
Max Chain Length |
|
#1 |
67 |
10 |
10 |
0 |
0 |
0 |
|
#2 |
67 |
10 |
89 |
0 |
0 |
0 |
|
#3 |
56 |
28 |
785 |
14 |
10 |
15 |
|
#4 |
33 |
47 |
12324 |
0 |
0 |
0 |
|
#5 |
26 |
38 |
3108 |
0 |
0 |
0 |
|
#6 |
64 |
48 |
222 |
0 |
0 |
0 |
|
#7 |
112 |
90 |
202 |
39 |
29 |
41 |
|
#8 |
64 |
80 |
712 |
0 |
0 |
0 |
|
#9 |
64 |
84 |
2632 |
0 |
0 |
0 |
|
#10 |
16 |
36 |
2608 |
0 |
0 |
0 |
|
#11 |
123 |
116 |
175 |
51 |
24 |
55 |
|
#12 |
30 |
50 |
38 |
13 |
4 |
15 |
|
#13 |
23 |
56 |
94 |
16 |
8 |
18 |
|
#14 |
23 |
40 |
93 |
21 |
11 |
23 |
|
#15 |
149 |
68 |
1 |
12 |
4 |
12 |
|
#16 |
15 |
22 |
108 |
26 |
3 |
31 |
|
#17 |
42 |
84 |
37 |
21 |
6 |
23 |
|
#18 |
43 |
13 |
8 |
23 |
1 |
31 |
|
#19 |
69 |
223 |
25 |
12 |
4 |
21 |
|
#20 |
11 |
53 |
644 |
26 |
5 |
28 |
|
#21 |
29 |
38 |
58 |
9 |
3 |
9 |
|
#22 |
40 |
45 |
124 |
12 |
4 |
14 |
|
#23 |
76 |
115 |
465 |
16 |
10 |
17 |
|
#24 |
40 |
54 |
59 |
7 |
3 |
8 |
|
#25 |
8 |
31 |
40 |
14 |
7 |
14 |
|
#26 |
23 |
73 |
27 |
18 |
5 |
19 |
|
#27 |
46 |
58 |
215 |
23 |
18 |
24 |
|
#28 |
33 |
66 |
181 |
34 |
31 |
35 |
|
#29 |
94 |
285 |
2 |
4 |
1 |
6 |
|
#30 |
43 |
48 |
26 |
9 |
5 |
10 |
The goal of the optimization methodology is to reduce the test time defined as the objective function shown in the given Eq. (1).
$T\left(W_{i}\right)=(1+\max (S i, S o) . t p i+\min (S i, S o)$ (1)
where, So and Si are the length of the output and input scan chain and tpi is the test pattern for core i.
Test scheduling is an important concern in SoC test automation. Efficient test scheduling reduces the chip marketing time and cost. The advantage of the proposed approaches is that it reduces the test time, which on the other hand reduces the test cost. In this paper, to reduce cost and time test scheduling using evolutionary approaches are proposed. The contributions of this paper are as below:
1) Enhanced Firefly algorithm used in the test scheduling gives a better test time than the other heuristic methods.
2) The performance of heuristic algorithm for various TAM widths is computed to test its efficiency on two benchmark circuits.
The previous works mainly focused on optimization of the TAM and wrapper design in order to reduce the testing time in core-based systems. Test time was computed using distribution and multiplexing architecture to analyze test time. Test scheduling techniques are divided as pre-emptive testing, non-partitioned and partitioned. Partitioned test scheduling is one in which scheduling is done as soon as possible for reducing the test time. Non-partitioned scheduling does not start any new test until tests are completed hence test time increases. In pre-emptive type, cores can be tested by interrupting and resuming after some time. During the end of the testing, all the cores must be completed. In pre-emptive test scheduling, idle time is minimized. ATE and BIST are used in external testing and internal testing respectively.
The three parts in SoC testing are tested scheduling, test access mechanism design, and core wrapper design [3]. The test shell with three layers of the hierarchy for the reduction of test access and test isolation problems of SoC is proposed. Test shell serves as an interface between host and core with three input/output terminal types namely test rail input/ output, function input/output, and direct test input/ output. Bypass feature is not used to test the wrapper approach allowing each core to serve at a time. The shortest job schedule is combined with round-robin in Improved Round Robin algorithm and it is proposed to improve utilization and testing time. Integer Linear programming (ILP) was developed for test bus assignment problem by the optimum distribution of test buses. Simulated annealing algorithm minimizes test time for two-dimensional bin packing problem. Using TAM and wrapper optimization, test scheduling, an NP hard problem was explained. A multilevel TAM architecture for multilevel optimization of TAM through flattened SoCs was proposed [4].
Kennedy developed an optimization technique based on the birds flocking behavior named Particle Swarm optimization in which Particle refers to each individual and dimensions refers to the particle count [5].
Table 4. Pros and Cons of existing methods
|
Reference |
Pros and Cons |
|
[3] |
Test architecture consisting of module test wrappers and TAMs. Preemptive test scheduling algorithm is used. Testing cost is high by using this type of test scheduling. |
|
[4] |
Efficient testing of SoCs, testing time is reduced. But this type of testing is applicable to limited SoC circuits |
|
[5] |
PSO Algorithm minimizes the testing time. But it is unsuitable for many optimization problems in SoC benchmarks. |
|
[6] |
Ant Colony Optimization is used for test scheduling. But it requires additional cost for the design. |
|
[7, 8] |
The various optimization techniques are used for large SoC benchmark circuits. Testing time is reduced but this technique is not flexible for all SoC design. |
|
[9] |
Genetic Algorithm is used for test scheduling. Additional cost required for dual speed TAM design. Overall testing cost is high. |
Ant Colony Optimization is focused on the activity of real ant based on ant search of the shortest route for the food. An artificial bee colony is explained in the studies [6-8] on the basis of the behavior of honey bees, and the growth of numerical problems is performed based on employed, unemployed foraging bees and food source. The wrapper architecture was developed to test child and parent cores. All the cores are tested at the same time by using a core clustering technique to solve 2D rectangular packing problem. Based on the deadline, high priority is assigned to the task in Earliest Deadline First algorithm. The testing time is reduced by evaluation and mutation operation through Genetic Algorithm, it was proposed. Genetic Algorithm [9] was used to generate a rectangular sequence in the wrapper design method where one rectangle is selected from a set to reduce the test time.
SoC is designed in such a way that it tries to minimize the test access mechanism (TAM) design and schedules the test using reconfigurable core wrappers. Further, it also tries to minimize by extended core design and hierarchical way is used to extract the properties. The next research study employs genetic algorithm to reduce TAM but the hierarchical core process is followed. In these studies, the TAM reduction ways are traditional and modified, but it still requires improvement as mentioned by researchers for future work. The pros and cons of existing methods are indicated in Table 4.
3.1 Firefly algorithm
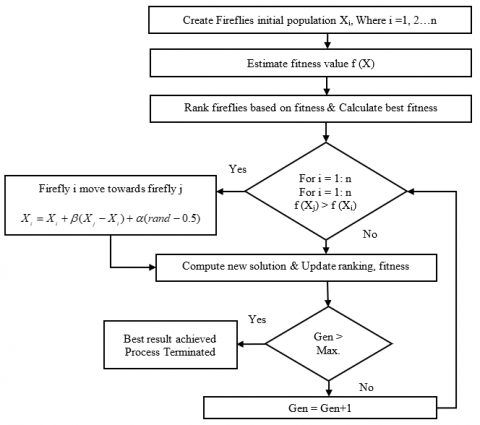
Yang proposed a metaheuristic technique called the Firefly Algorithm based on firefly flashing behavior [10]. Figure 1 displays the flow chart of the Firefly algorithm.
The firefly algorithm is based on the attraction of the fireflies during the mating behaviour which depends on the brightness of the firefly. Short flashes are produced by fireflies and the flash pattern is unique for a specific species. Flashing light is formed by the Bioluminescence method. Flashes help to attract prey as well as a mating partner. Flashing also acts as a protection mechanism.
In the same species, female response to the unique method of male flashing but in postures species, female firefly mimics the flashing pattern of male fireflies. One firefly is attracted to another firefly regardless of sex. Attractiveness is proportional to its brightness and it increases in distance, decreases both attractiveness and brightness.
The attractive value of firefly β is shown by the given Eq. (2):
$\beta ={{\beta }_{0}}{{e}^{-\gamma {{r}^{m}}}}(m\ge 1)$ (2)
where, g is a fixed coefficient of absorption of light and r is the distance between the fireflies. The distance between fireflies i (at Xi) and j (at Xj) is rij.
${{r}_{ij}}=\left\| {{X}_{i}}-{{X}_{j}} \right\|=\sqrt{\sum\limits_{k=1}^{d}{{{({{x}_{i,k}}-{{x}_{j,k}})}^{2}}}}$ (3)
where, Xi,k is the kth element of Xi coordinate of ith firefly, d- dimension
Firefly ‘i’ to another firefly ‘j’ whose movement is given in the below equation:
${{X}_{i}}={{X}_{i}}+\beta ({{X}_{j}}-{{X}_{i}})+\alpha (rand-0.5)$ (4)
Figure 1. Flowchart of firefly algorithm
3.2 Enhanced firefly algorithm
Enhanced Firefly algorithm [11, 12] eliminates the limitation of the firefly algorithm. It improves the movement of Firefly and reduces the randomness of the algorithm to enhance the exploitation and exploration ability. In Figure 2 flowchart of Enhanced Firefly algorithm with the steps through which the algorithm works is shown.
In Enhanced Firefly algorithm, α which is the randomization parameter and it was linearly decreased from α0 to α∞. Where α0 and α∞ the initial and final value when iteration occurs. Exploitation and exploration capabilities are maintained in a balanced state. A larger value of α initially provides better convergence.
Distance function ri is shown by Eq. (5).
${{r}_{i,best}}=\sqrt{{{({{x}_{i}}-{{x}_{gbest}})}^{2}}+{{({{y}_{i}}-{{y}_{gbest}})}^{2}}}$ (5)
Movement of ith firefly is given by the Eq. (6).
$\begin{align} & {{x}_{i}}={{x}_{i}}+{{\beta }_{0}}{{e}^{-\gamma r_{_{i,j}}^{2}}}({{x}_{j}}-{{x}_{i}}) \\ & +{{\beta }_{0}}{{e}^{-\gamma r_{_{i,best}}^{2}}}({{x}_{gbest}}-{{x}_{i}}) \\ & +\alpha \varepsilon +\lambda \varepsilon ({{x}_{i}}-gbest) \\\end{align}$ (6)
where, ε=random number, gbest – global best.
When there is no local best solution in the neighborhood, the best solution attracts the ith firefly. To minimize the probability to move into several local optima, the Enhanced Firefly algorithm eliminates randomness in such a way that it rapidly converges and fireflies move towards its global optimum.
Figure 2. Flowchart of enhanced firefly algorithm
The results obtained with software C # and the analysis of the test time with different algorithms are performed. All the results were obtained on an Intel(R) Core (TM) i3 machine with a processor speed of 1.20GHz and a 4GB RAM. The algorithm is evaluated, which gives the optimum testing time.
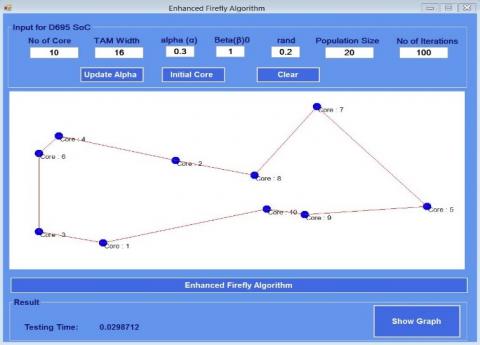
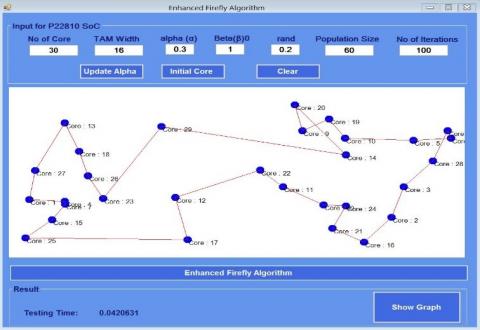
Figures 3 and 4 show the initialization of the d695 and p22810 benchmark circuits by using the Enhanced Firefly algorithm. Figures 3 and 4 show that for core initialization, various input parameters are taken and are initialized with a particular value. The figures show that the parameters are initialized, and the optimal test time can be calculated for the TAM width 16 for both benchmark circuits.
Figure 3. Initialization of D695 benchmark circuit using enhanced firefly algorithm (W=16)
Figure 4. Initialization of P22810 benchmark circuit using enhanced firefly algorithm (W=16)
Table 5. Input parameters for benchmark circuits
|
Number of Cores |
30 for p22810 SoC 10 for d695 SoC |
|
Ant Count |
Twice the core count 60 for p22810 SoC 20 for d695 SoC |
|
Number of Iterations |
100 |
|
TAM width |
Between 16 to 64 |
|
Alpha α |
0.3 |
|
Beta β |
1 |
|
rand |
0.2 |
Table 5 shows the input parameters and their corresponding value. These parameters are used in the core initialization of d695 and p22810 SoC benchmark circuits for various TAM widths.
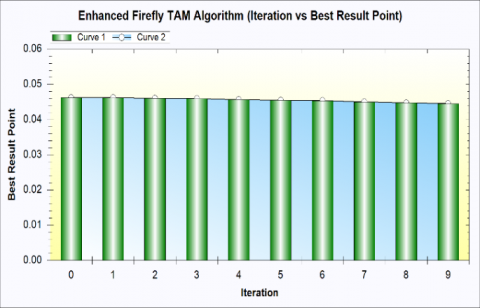
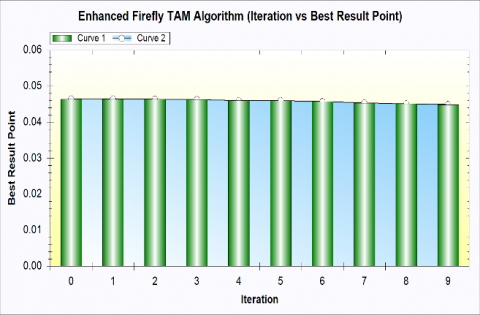
Figures 5 and 6 are the graphs show the best value of result point achieved at different iterations for d695 and p22810 SoCs of TAM width 16 by applying Enhanced Firefly algorithm.
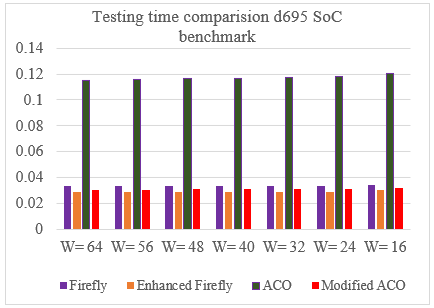
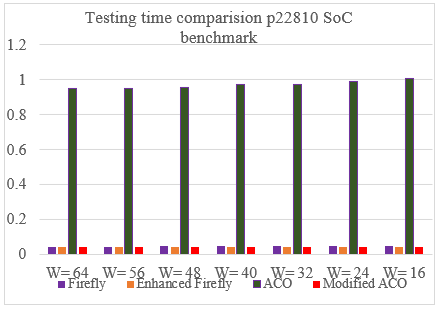
From Table 6 it is noted that Enhanced Firefly algorithm minimizes the time for testing to 13% and 75% than Firefly and ACO algorithms for d695 SoC and 9%, 90.6% for p22810 SoC benchmark circuits respectively.
Table 6. Comparison of testing time for various TAM width for SoC d695 and p22810
|
SoC Benchmarks |
TAM Width (W) |
Testing Time |
|||
|
Firefly |
Enhanced Firefly |
ACO [8] |
Modified ACO [7] |
||
|
d695 SoC Benchmark |
64 |
0.0330102 |
0.0285102 |
0.1151878 |
0.0304913 |
|
56 |
0.0330501 |
0.0288481 |
0.1157389 |
0.0305503 |
|
|
48 |
0.0331279 |
0.0287291 |
0.1163927 |
0.0307298 |
|
|
40 |
0.0331698 |
0.0290691 |
0.1168048 |
0.0308703 |
|
|
32 |
0.0332801 |
0.0286736 |
0.1172215 |
0.0309255 |
|
|
24 |
0.0333710 |
0.0286688 |
0.1181152 |
0.0311497 |
|
|
16 |
0.0337692 |
0.0298712 |
0.1202580 |
0.0317982 |
|
|
p22810 SoC Benchmark |
64 |
0.0451017 |
0.0413002 |
0.9488492 |
0.0428791 |
|
56 |
0.0451199 |
0.0410234 |
0.9508749 |
0.0429298 |
|
|
48 |
0.0452398 |
0.0409430 |
0.9588319 |
0.0430296 |
|
|
40 |
0.0453112 |
0.0409091 |
0.9731043 |
0.0432992 |
|
|
32 |
0.0455398 |
0.0418401 |
0.9763749 |
0.0438771 |
|
|
24 |
0.0458801 |
0.0414766 |
0.9925879 |
0.0435126 |
|
|
16 |
0.0460611 |
0.0420631 |
1.0105687 |
0.0430481 |
|
Figure 5. Best result point value for d695 SoC
Figure 6. Best result point value for p22810 SoC
Figure 7. Comparison of test time using ACO, modified ACO, firefly and enhanced firefly for d695 SoC
Figure 8. Comparison of test time using ACO, modified ACO, firefly and enhanced firefly for p22810 SoC
Figures 7 and 8 show that the comparative graphs give the testing time computed by using ACO, Modified ACO, Firefly and Enhanced Firefly algorithm. The graph clearly explains that the Enhanced Firefly algorithm shows the deduction of test time compared to ACO, Modified ACO and Firefly algorithms.
The result obtained using Enhanced Firefly algorithm is compared with the ACO, MACO and Firefly techniques. The proposed Enhanced Firefly algorithm reduces the testing time to 13%, 75%, 7% for d695 SoC and 12%, 85%, 5% for p22810 SoC than ACO, MACO and Firefly algorithms.
The optimization of d695 and p22810 benchmark circuits of System on Chip is performed and the test time is reduced by using the proposed Enhanced Firefly optimization algorithm. The bandwidths 16, 32, 24, 48, 56, and 64 are considered. The results obtained in simulation clearly show that the Enhanced Firefly algorithm is better than Firefly, ACO and modified ACO algorithms since test time is reduced 13%, 75%, 7% for d695 SoC and 12%, 85%, 5% for p22810 SoC respectively. So, the Enhanced Firefly technique is a better algorithm for solving the optimization problems. Therefore, it may be concluded that the Enhanced Firefly algorithm can be used to perform scheduling in SoCs. In the future, algorithms like Random Forest Algorithm, Tree-Seed Optimization, and Invasive Weed Algorithms could be tested to minimize the test time.
[1] Pouget, J., Larsson, E., Peng, Z. (2005). Multiple-constraint driven system-on-chip test time optimization. Journal of Electronic Testing, 21(6): 599-611. https://doi.org/10.1007/s10836-005-2911-4
[2] Kang, W.J., Hwang, S.Y. (2014). A test wrapper design to reduce test time for multi-core SoC. The Journal of Korean Institute of Communications and Information Sciences, 39(1): 1-7. https://doi.org/10.7840/kics.2014.39B.1.1
[3] Iyengar, V., Chakrabarty, K. (2002). System-on-a-chip test scheduling with precedence relationships, preemption, and power constraints. IEEE Transactions on Computer-Aided Design of Integrated Circuits and Systems, 21(9): 1088-1094. https://doi.org/10.1109/TCAD.2002.801102
[4] Chakrabarty, K. (2000). Design of system-on-a-chip test access architectures using integer linear programming. In Proceedings 18th IEEE VLSI Test Symposium, pp. 127-134. https://doi.org/ 10.1109/VTEST.2000.843836
[5] Sharafi, M., ELMekkawy, T.Y. (2014). Multi-objective optimal design of hybrid renewable energy systems using PSO-simulation based approach. Renewable Energy, 68: 67-79. https://doi.org/10.1016/j.renene.2014.01.011
[6] Dorigo, M., Blum, C. (2005). Ant colony optimization theory: A survey. Theoretical Computer Science, 344(2-3): 243-278. https://doi.org/10.1016/j.tcs.2005.05.020
[7] Chandrasekaran, G., Kumarasamy, V., Chinraj, G. (2019). Test scheduling of core based system-on-chip using modified ant colony optimization. Journal Européen des Systèmes Automatisés, 52(6): 599-605. https://doi.org/10.18280/jesa.520607
[8] Chandrasekaran, G., Periyasamy, S., Rajamanickam, K.P. (2019). Minimization of test time in system on chip using artificial intelligence-based test scheduling techniques. Neural Computing and Applications, 1-10. https://doi.org/10.1007/s00521-019-04039-6
[9] Chattopadhyay, S., Reddy, K.S. (2003). Genetic algorithm based test scheduling and test access mechanism design for system-on-chips. In 16th IEEE International Conference on VLSI Design, 2003. Proceedings, pp. 341-346. https://doi.org/10.1109/ICVD.2003.1183160
[10] Yang, X.S. (2009). Firefly algorithms for multimodal optimization. In International symposium on stochastic algorithms (pp. 169-178). Springer, Berlin, Heidelberg. https://doi.org/10.1007/978-3-642-04944-6_14
[11] Baykasoğlu, A., Ozsoydan, F.B. (2014). An improved firefly algorithm for solving dynamic multidimensional knapsack problems. Expert Systems with Applications, 41(8): 3712-3725. https://doi.org/10.1016/j.eswa.2013.11.040
[12] Wang, G.G., Guo, L., Duan, H., Wang, H. (2014). A new improved firefly algorithm for global numerical optimization. Journal of Computational and Theoretical Nanoscience, 11(2): 477-485. https://doi.org/10.1166/jctn.2014.3383