Naga Venkata Sai Ram Yellapragada*![]() | Venkata Sai Kumar Madala
| Venkata Sai Kumar Madala![]() | Sameer Kumar Devarakonda
| Sameer Kumar Devarakonda![]() | Raqheeb Sadiq Mahaboob Ali Shaik
| Raqheeb Sadiq Mahaboob Ali Shaik![]() | Nageswara Rao Annamdasu
| Nageswara Rao Annamdasu![]() | Kondala Rao Dasari
| Kondala Rao Dasari![]() | Hasheer Shaik Mohammad
| Hasheer Shaik Mohammad![]()
© 2023 IIETA. This article is published by IIETA and is licensed under the CC BY 4.0 license (http://creativecommons.org/licenses/by/4.0/).
OPEN ACCESS
Fibre-reinforced polymer composites have begun to replace the conventional monolithic materials in the recent years as a result of better specific strength and enhanced characteristics. The present work has put forward an attempt to study the dry-sliding wear behaviour of CFRP composites followed by implementation of Taguchi-GRA combinatorial approach for the two output responses namely, wear and frictional force. Load (L), sliding distance (D), sliding velocity (S), and percent of fibre reinforcement (R) are considered as input conditions and the experiments were planned using design of experiments. In addition, Principal Component Analysis (PCA) has taken into consideration for the weights calculation in GRA. An elaborate study on the implementation these methodologies on the combined behaviour of wear and frictional force has been presented. Furthermore, ANOVA data is analysed, it appears that both the load (L) and the percent reinforcement (R) has greater effect towards the wear behaviour. A detailed discussion on wear mechanism has also been presented with a support of SEM morphology.
carbon fiber, polyester, CFRP composites, Principal Component Analysis (PCA) method, Taguchi-GRA method
Over the course of the last few decades, the innovations in the material science have undergone a substantial change, and along with it, the requirements for composite materials in multiple disciplines have increased. Polymers have recognized as one of the most significant categories of innovative materials. Because of their individual characteristics, such as a high strength-to-weight ratio (S/W ratio) and high stiffness, the number of applications for polymer composites in automotive industries has been steadily increasing [1] more specifically in the domains of panels, belts, hoses and etc. Some of the research [2, 3] has been attempted to increase the lifespan of commercial polymers by enhancing the mechanical and tribological properties of the materials through the addition of hard ceramic particles at the micro and nano level. On the other hand, the durability of a component is also an essential requirement that one should take care during the process design and development. In this regard, polyester is a good option for increasing the product's potential lifespan as such it was unaffected by the effects of moisture, or humidity [4]. Few attempts have been made with polyesters are commonly as matrix materials, and to increase the mechanical and tribological properties with various reinforcement like glass, aramid and carbon fibres [5, 6].
Venu et al. [7] studied the thermal behavior of jute and carbon fibres as reinforcements in polysters. Mir and Charoo [8] studied the usage of carbon fibres in PEEK (Poly-Ether-Ether-Ketone) for orthopedic applications. Therefore, the addition of Carbon fiber is remarked as one of the significant and novel attempt in the recent years to accomplish an intriguing balance of mechanical attributes, S/W ratio, and low density as reported by Wang and Gao as well as Messana et al. [9, 10]. In addition to mechanical and thermal properties, the tribological behavior of carbon fibres in polyster was also been a point of interest for Sai Kumar et al. [11] to observe the right amount of weight fractions and the wear behavior with the help of statistical approaches. This approach was a found to be a faster technology in the arena of composites by utilizing straightforward procedures and speeding up the total process through the implementation of optimization techniques. The Taguchi-GRA combinatorial approach was also used to evaluate multi-objective optimization machining parameters for a variety of machining processes including milling, grinding, drilling, and turning of polyster composites [12-14].
Weights that are assigned to responses play a vital role in multi-objective decision-making process. Equal Weightage Method (EWM), Entropy Based Weightage Method (EBWM) are unique methods for improving the efficiency of optimizing wear process parameters. Geeth et al. [15] optimized the two tribological output responses using Taguchi-GRA combinatorial strategy. As an extension to EWM work, Yellapragada et al. [16] implemented the EBWM strategy in comparison to EWM method. However, Principal Component Analysis (PCA) is a new paradigm which minimizes the loss of information, and it reduces the dimensionality of various replies [17-19]. The research on the effects of weight distribution and on the tribological characteristics with PCA is very limited. To the best of the authors' knowledge, very limited research has been done on the PCA – Taguchi - GRA method in polyester/CFRP composites to determine how different weight fractions affect the GRA approach used to calculate it. To this end, a genuine and sincere effort has been made to employ the Taguchi-GRA-PCA technique for optimizing the tribological parameters, including wear and frictional force. Section 2 describes the experiments and methods used, while later sections provide a discussion of the findings based on ANOVA and morphological analysis.
2.1 Materials and fabrication
A mild steel mould with dimensions of 1.5 centimetres in diameter and 15 centimetres in height is used in this study to cure polyester resin while also incorporating carbon fibres. Unsaturated polyester resin is cured with carbon fibre that has a size of 85 micrometres as a result of the addition of the hardeners methyl ethyl ketone peroxide (MEKP) and cobalt octoate (CO). In order to get a higher yield from the casting process, the semi-solid mixture is left out at room temperature of 28℃ for 24 hours. After a period of twenty-four hours, the specimens are removed from the mould and then machined down to a diameter of 8 millimetres in preparation for wear testing, which are seen in Figure 1. Table 1 is a presentation of the various composite’s individual constituents.
(a) Carbon fiber (b) Polyester (c) Hardeners - MEKP, CO (d) Stirring of the composite mixture (e) Mould setup (f) Pouring of the mixture into the mould (g) Composites in the die after curing at room temperature (h) Composites with different compositions (i) Wear specimens
Figure 1. Preparation of CFRP composites
2.2 Microstructure and chemical composition of CFRP composites
In order to evaluate the bonding between the carbon fibres and the base matrix, microstructures are collected using SEM equipment. For SEM analysis, specimen surfaces were gold (Au) coated to make them conductive with the aid of a sputter coating equipment (Model: SC7620) before starting the scanning process. For microstructural analysis, Scanning Electron Microscope (Model: VEGA3,TESCAN) coupled with Energy dispersive X-ray (Model: BRUKER nano, GmbH,D-12489) is used. SEM analysis was conducted at GANDHIGRAM rural university,Tamilnadu.
Table 1. Illustrates the composition of various composites
|
Designation of Composite |
% by weight of Carbon fiber |
% by weight of Polyester resin |
% by weight of Hardener (MEKP+CO) |
|
100% Pure Polyester |
0 |
200 |
2 |
|
2Wt% CF + 98% Polyester |
2 |
200 |
4 |
|
4Wt% CF + 96% Polyester |
4 |
200 |
6 |
|
6Wt% CF + 94% Polyester |
6 |
200 |
8 |
(a) Microstructure (b) Elemental composition of 6 wt.% CFRP composite
Figure 2. SEM – EDX analysis of fabricated CFRP composite
Figure 2(a) depicts the SEM micrograph of carbon fibre dispersion in base polyester matrix. There is a uniform distribution of carbon particles throughout the micrograph, however some agglomeration of carbon particles is possible due to the mechanical stirring action at higher percentage of reinforcements. According to the findings of the EDS analysis, the manufactured CFRP composite consists of the elements carbon, oxygen, silicon, and chlorine, with silicon and chlorine being relatively insignificant components due to the low weight percentages shown in Figure 2(b).
2.3 Dry-sliding wear test
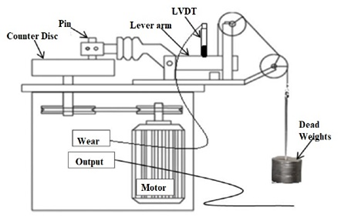
Wear tests were conceded out using a pin-on-disc tribometer (Figure 3), in accordance with the standards established by ASTM G99-95 [20]. The wear pins that are prepared have dimensions of 0.8 centimetres in width and 5 centimetres in height. While test is going on, the load was transferred to the pin by pressing it up against its corresponding position on an EN32 steel disc. Following a certain amount of sliding distance, the pins were removed from their holders in the pin holder. The change in weight that was measured before and after the experiment is used to calculate the loss of wear.
Figure 3. Pin-on-disc setup [20]
2.4 Taguchi’s design of experiments (DOE)
The Taguchi experimental design can be applied to a wide variety of situations where information regarding the impact of variables on the response variable is desired. The phase in the DOE that requires the most attention to detail is the selection of the monitoring factors that have an effect on the output measurements. In the investigation of sliding wear, the factors considered are load (L), sliding distance (D), sliding velocity (S), and percentage of reinforcement (R) depicted in Table 2. Taguchi L16 OA has implemented to reduce the number of experiments (Table 3). The outcomes of these tests are subsequently transformed into signal-to-noise ratios (SNR). Minitab 19 was used to analyse experimental data. The logarithmic function is utilized to convert the signal-to-noise ratio, as illustrated in Eq. (1) [21-24].
S/N ratio using “Smaller-the-Better” is given as:
$\mathrm{S} / \mathrm{N}_{\mathrm{SB}}=-10 \log _{10}\left[\frac{1}{\mathrm{n}} \sum_{\mathrm{i}=1}^{\mathrm{n}} \mathrm{y}_{\mathrm{i}}^2\right]$ (1)
where, ‘n’ signifies the number of runs and ‘y’ shows the output parameters (y=2).
Table 2. Variable factors and their levels
|
Variable Factors |
Levels |
Units |
|||
|
1 |
2 |
3 |
4 |
||
|
S |
2 |
4 |
6 |
8 |
m/s |
|
L |
5 |
10 |
15 |
20 |
N |
|
D |
1000 |
2000 |
3000 |
4000 |
m |
|
R |
0 |
2 |
4 |
6 |
% |
Table 3. Multi-response output parameters along with S/N ratio using L16 Orthogonal Array
|
Runs |
Variable Factors |
Outcome variables |
S/N Ratios |
|||||
|
S (m/s) |
L (N) |
D (m) |
R (%) |
W (µm) |
FF (N) |
W (dB) |
FF (dB) |
|
|
1 |
2 |
5 |
1000 |
0 |
162 |
10.5 |
-44.1903 |
-20.4238 |
|
2 |
2 |
10 |
2000 |
2 |
83 |
7.25 |
-38.3816 |
-17.2068 |
|
3 |
2 |
15 |
3000 |
4 |
63 |
5.12 |
-35.9868 |
-14.1854 |
|
4 |
2 |
20 |
4000 |
6 |
48 |
4.11 |
-33.6248 |
-12.2768 |
|
5 |
4 |
5 |
2000 |
4 |
62 |
16.3 |
-35.8478 |
-24.2438 |
|
6 |
4 |
10 |
1000 |
6 |
39 |
11.03 |
-31.8213 |
-20.8515 |
|
7 |
4 |
15 |
4000 |
0 |
325 |
19.25 |
-50.2377 |
-25.6886 |
|
8 |
4 |
20 |
3000 |
2 |
121 |
4.39 |
-41.6557 |
-12.8493 |
|
9 |
6 |
5 |
3000 |
6 |
76 |
12.91 |
-37.6163 |
-22.2185 |
|
10 |
6 |
10 |
4000 |
4 |
84 |
12.36 |
-38.4856 |
-21.8404 |
|
11 |
6 |
15 |
1000 |
2 |
138 |
15.25 |
-42.7976 |
-23.6654 |
|
12 |
6 |
20 |
2000 |
0 |
184 |
9.32 |
-45.2964 |
-19.3883 |
|
13 |
8 |
5 |
4000 |
2 |
92 |
12.76 |
-39.2758 |
-22.1170 |
|
14 |
8 |
10 |
3000 |
0 |
133 |
11.37 |
-42.4770 |
-21.1152 |
|
15 |
8 |
15 |
2000 |
6 |
69 |
9.1 |
-36.7770 |
-19.1808 |
|
16 |
8 |
20 |
1000 |
4 |
95 |
4.83 |
-39.5545 |
-13.6789 |
2.5 Grey relational analysis (GRA)
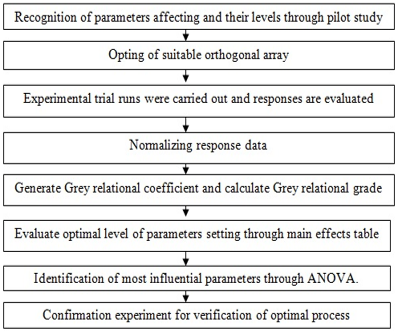
Figure 4. Taguchi-based GRA experiment flowchart [29]
Taguchi's experimental design is used to analyze only one process parameter, however GRA optimizes many objectives. GRA can also evaluate unfamiliar data [25, 26]. GRA procedure is illustrated in Figure 4. The detailed procedure along with the formulae can be found in the literature [25-28].
2.6 Principal Component Analysis (PCA)
In multi objective optimization, rather than using trial-and-error methods, GRA-PCA is used to weight all value characteristics, reducing decision-making uncertainty. PCA controls the weighting of every quality trademark. PCA reveals variance covariance by linearly combining all system features. It is explained as:
Step-I: Developing the original multiple performance characteristic array.
$\mathrm{x}_{\mathrm{i}}=\left[\begin{array}{cccccc}\mathrm{x}_1(1) & \mathrm{x}_1(2) & \mathrm{x}_1(3) & \ldots . & \ldots & \mathrm{x}_1(\mathrm{n}) \\ \mathrm{x}_2(1) & \mathrm{x}_1(2) & \mathrm{x}_1(3) & \ldots & \ldots & \mathrm{x}_1(\mathrm{n}) \\ \ldots & \ldots & \ldots & \ldots & \ldots & \ldots \\ \ldots & \ldots & \ldots & \ldots & \ldots & \ldots \\ \ldots & \ldots & \ldots & \ldots & \ldots & \ldots \\ \mathrm{x}_{\mathrm{m}}(1) & \mathrm{x}_{\mathrm{m}}(2) & \mathrm{x}_{\mathrm{m}}(3) & \ldots & \ldots & \mathrm{x}_{\mathrm{m}}(\mathrm{n})\end{array}\right]$ (2)
where, m, the quantity of experiments and n, the quantity of quality characteristics. In this case, x represents the coefficient of each quality characteristic's respective parameter.
Step-II: An evaluation of the correlation coefficient array is as follows:
$\mathrm{R}_{\mathrm{jk}}=\frac{\operatorname{Cov}\left(\mathrm{x}_{\mathrm{i}}(\mathrm{j}), \mathrm{x}_{\mathrm{i}}(\mathrm{k})\right)}{\sigma_{\mathrm{xi}}(\mathrm{j}) \cdot \sigma_{\mathrm{xi}}(\mathrm{k})}$ (3)
$\mathrm{j}=1,2,3, \ldots \ldots, \mathrm{n}, \mathrm{k}=1,2,3, \ldots \ldots \mathrm{n}$, where $\operatorname{Cov}\left(\mathrm{x}_{\mathrm{i}}(\mathrm{j}), \mathrm{x}_{\mathrm{i}}(\mathrm{k})\right)$ are the covariance sequences, $\mathrm{x}_{\mathrm{i}}(\mathrm{j})$ and $\mathrm{x}_{\mathrm{i}}(\mathrm{k})$ respectively; $\sigma_{\mathrm{xi}}(\mathrm{j})$ is the standard deviation of sequence $\mathrm{x}_{\mathrm{i}}(\mathrm{j}) ; \sigma_{\mathrm{xi}}(\mathrm{k})$ is the standard deviation of sequence $\mathrm{x}_{\mathrm{i}}(\mathrm{k})$.
Step-III: The eigen standards and eigen vectors are determined from the correspondence coefficient array.
$\left(\mathrm{R}-\lambda_{\mathrm{k}} \mathrm{I}_{\mathrm{m}}\right) \mathrm{V}_{\mathrm{ik}}=0$ (4)
where, $\lambda_{\mathrm{k}}$ is an eigen value, $\sum_{\mathrm{k}=1}^{\mathrm{n}} \lambda_{\mathrm{k}}=\mathrm{n}$ and $\mathrm{k}=1,2, \ldots \mathrm{n}$; $\mathrm{V}_{\mathrm{ik}}=\left[a_{\mathrm{k} 1}, a_{\mathrm{k} 2}, \ldots \ldots, a_{\mathrm{kn}}\right]^{\mathrm{T}}$ correspond to eigen $\mid$ value $\lambda_{\mathrm{k}}$.
Step-IV: The uncorrelated principal components is set as:
$\mathrm{Y}_{\mathrm{mk}}=\sum_{\mathrm{k}=1}^{\mathrm{n}} \mathrm{V}_{\mathrm{ik}} \cdot \mathrm{X}_{\mathrm{m}}(\mathrm{i})$ (5)
where, $\mathrm{Y}_{\mathrm{m} 1}$ and $\mathrm{Y}_{\mathrm{m} 2}$ are the initial and succeeding principal components.
3.1 Implementation of Taguchi method
3.1.1 S/N ratio calculation
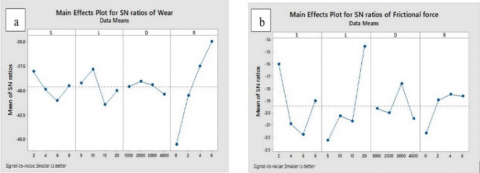
Table 3 shows the output responses namely wear and frictional force. The experimental data and their S/N ratios, corresponding to data of wear (W) and frictional force (FF) is tabulated in Table 4. Figure 5 (a & b) shows the effect of W and FF affect S/N ratio. Evaluating the lowest S/N ratios can help to optimise a control factor's performance. In table 4, bolded values show lowest S/N ratios while that % of reinforcement (R) affects wear and load (L) affects frictional force (FF).
Figure 5 (a) and table 4 show best parameters based on S/N ratio. The conditions S1 L2 D2 R4 has produced the least wear, while S1 L4 D3 R3 has the least friction from Figure 5(b).
Figure 5. Effect of wear and frictional force using the S/N ratio plot considering different levels of process parameters
Table 4. S/N ratio response table for wear and frictional force
|
|
Wear |
Frictional force |
||||||
|
Level |
S |
L |
D |
R |
S |
L |
D |
R |
|
1 |
-38.05 |
-39.23 |
-39.59 |
-45.55 |
-16.02 |
-22.25 |
-19.65 |
-21.65 |
|
2 |
-39.89 |
-37.79 |
-39.08 |
-40.53 |
-20.91 |
-20.25 |
-20 |
-18.96 |
|
3 |
-41.05 |
-41.45 |
-39.43 |
-37.47 |
-21.78 |
-20.68 |
-17.59 |
-18.49 |
|
4 |
-39.52 |
-40.03 |
-40.41 |
-34.96 |
-19.02 |
-14.55 |
-20.48 |
-18.63 |
|
Delta |
3 |
3.66 |
1.33 |
10.59 |
5.75 |
7.7 |
2.89 |
3.17 |
|
Rank |
3 |
2 |
4 |
1 |
2 |
1 |
4 |
3 |
3.1.2 Analysis of Variance (ANOVA)
ANOVA was used to recognize the critical wear and frictional force control parameters. Sum of squared values determines the significance of factors. The more squared values there are, the more essential response values are. These data regulate each parameter % contributions [30]. The study has 95% confidence and 5% significance. Tables 5 and 6 provide the ANOVA results for wear and friction. R, which contributes 65.61 percent to wear, is the most essential element, followed by L, S, and D. L produces 43.85% of frictional force, followed by S, R, and D. High F-values indicate process-performance-affecting factors [31, 32]. Tables 5 and 6 show that the model has a strong linear fit and minimal error based on R2 Value [33, 34].
Table 5. Wear S/N ANOVA table
|
Parameters |
SS a |
DOF |
MS |
F-value |
Contribution % |
|
S |
5705.00 |
3 |
1902.00 |
0.860 |
7.708 |
|
L |
9136.00 |
3 |
3045.00 |
1.370 |
12.343 |
|
D |
3960.00 |
3 |
1320.00 |
0.600 |
5.350 |
|
R |
48561.00 |
3 |
16187.00 |
7.300 |
65.609 |
|
Error |
6653.00 |
3 |
2218.00 |
|
8.989 |
|
Total |
74016.00 |
15 |
|
|
100.000 |
|
S = 47.093, R2 = 91.01% |
|||||
Table 6. Frictional force S/N ANOVA table
|
Parameters |
SSa |
DOFb |
MSc |
F-value |
Contribution % |
|
S |
95.47 |
3 |
31.83 |
5.070 |
31.711 |
|
L |
132.01 |
3 |
44.00 |
7.010 |
43.848 |
|
D |
27.10 |
3 |
9.03 |
1.440 |
9.002 |
|
R |
27.65 |
3 |
9.22 |
1.470 |
9.184 |
|
Error |
18.82 |
3 |
6.28 |
|
6.251 |
|
Total |
301.06 |
15 |
|
|
100.000 |
|
S = 2.504, R2 = 93.75% |
|||||
a Sum of Squares b Degrees of Freedom (DOF) c Mean squares
3.2 Multi-parameter optimization using GRA with PCA approach
Wear and friction coexist, so they must be enhanced simultaneously. GRA was chosen since it can reduce multi-objective problems to single-objective ones [35]. Weighting procedures are needed to convert multi objective functions into single objective functions. The PCA Method calculates the weights based on the procedure mentioned in section 2.7. Table 7 and Table 8 are representing the eigen values and eigen vector calculations. In order to compress the data, the method of using Eigenvectors and Eigenvalues is utilised. In order to minimise the dimensions, a number of procedures, like Principal Component Analysis (PCA), has been employed with eigenvalues and eigenvectors.
From Table 8, it has been observed that the weights obtained by PCA method are 0.4999 and 0.499 in the present conditions. These closely matches with the weights of EWM method as proposed by Yellapragada et al. [16]. Since the weights are equal in both the methods, the GRG scores, optimal parameters the main effects plots are identical. Now, With the Normalized values, deviation sequences, and GRC/GRG are calculated for all replies. Run 4 has the greatest GRG value, as seen by the highlighted numbers in Table 9.
Table 7. Eigen values
|
Principal Component |
Eigen Value |
|
First |
1.1730 |
|
Second |
0.7020 |
Table 8. Eigen vectors for principal components and contribution
|
Responses |
Eigen Vector |
Contribution |
|
|
First principal component |
Second principal component |
||
|
W |
0.707 |
0.707 |
0.4999 |
|
FF |
0.707 |
-0.707 |
0.4999 |
Table 9. GRC and GRG wear and friction calculations
|
Runs |
Normalized data $\left[y_i(k)\right]$ |
Deviation sequence $\left[\Delta_{\mathrm{oi}}(\mathbf{k})\right]$ |
GRC $\left[\xi_{\mathbf{i}}(\mathbf{k})\right]$ |
GRG $\left(\gamma_{\mathrm{i}}\right)$ |
Rank |
|||
|
W |
FF |
W |
FF |
W |
FF |
|||
|
1 |
0.3284 |
0.3926 |
0.6716 |
0.6074 |
0.4268 |
0.4515 |
0.4391 |
14 |
|
2 |
0.6438 |
0.6324 |
0.3562 |
0.3676 |
0.5840 |
0.5763 |
0.5801 |
6 |
|
3 |
0.7738 |
0.8577 |
0.2262 |
0.1423 |
0.6885 |
0.7784 |
0.7335 |
2 |
|
4 |
0.9021 |
1.0000 |
0.0979 |
0.0000 |
0.8362 |
1.0000 |
0.9181 |
1 |
|
5 |
0.7814 |
0.1077 |
0.2186 |
0.8923 |
0.6958 |
0.3591 |
0.5274 |
8 |
|
6 |
1.0000 |
0.3607 |
0.0000 |
0.6393 |
1.0000 |
0.4389 |
0.7194 |
3 |
|
7 |
0.0000 |
0.0000 |
1.0000 |
1.0000 |
0.3333 |
0.3333 |
0.3333 |
16 |
|
8 |
0.4660 |
0.9573 |
0.5340 |
0.0427 |
0.4836 |
0.9213 |
0.7025 |
4 |
|
9 |
0.6853 |
0.2587 |
0.3147 |
0.7413 |
0.6137 |
0.4028 |
0.5083 |
9 |
|
10 |
0.6381 |
0.2869 |
0.3619 |
0.7131 |
0.5801 |
0.4122 |
0.4962 |
10 |
|
11 |
0.4040 |
0.1509 |
0.5960 |
0.8491 |
0.4562 |
0.3706 |
0.4134 |
15 |
|
12 |
0.2683 |
0.4698 |
0.7317 |
0.5302 |
0.4059 |
0.4853 |
0.4456 |
13 |
|
13 |
0.5952 |
0.2663 |
0.4048 |
0.7337 |
0.5526 |
0.4053 |
0.4790 |
11 |
|
14 |
0.4214 |
0.3410 |
0.5786 |
0.6590 |
0.4636 |
0.4314 |
0.4475 |
12 |
|
15 |
0.7309 |
0.4852 |
0.2691 |
0.5148 |
0.6501 |
0.4927 |
0.5714 |
7 |
|
16 |
0.5801 |
0.8955 |
0.4199 |
0.1045 |
0.5435 |
0.8271 |
0.6853 |
5 |
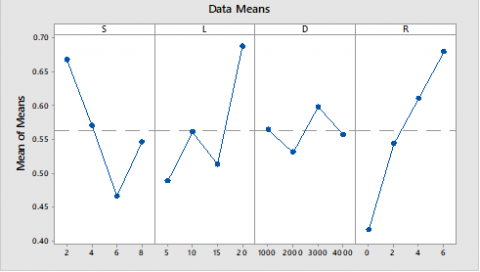
Table 10 shows the summarized GRG responses corresponding to process parameters and their levels. The best combination parameters are S1-L4-D3-R4 to optimize the tribological behaviour of Carbon/Polyester composites. The impact of weights can be clearly seen in the work proposed by Yellapragada et al. [16]. While the results here are consistent with those obtained by the EWM approach, the Shannon entropy results are different. The same was confirmed with the main effects plots as mentioned Figure 6. The ANOVA results will indicate the variance of obtained results and discussed in the following section.
Table 10. Summarized GRG data for levels and parameters
|
Level |
S |
L |
D |
R |
|
1 |
0.668 |
0.489 |
0.564 |
0.416 |
|
2 |
0.571 |
0.561 |
0.531 |
0.544 |
|
3 |
0.466 |
0.513 |
0.598 |
0.611 |
|
4 |
0.546 |
0.688 |
0.557 |
0.679 |
|
$\delta$ |
0.202 |
0.199 |
0.067 |
0.263 |
|
Ranking |
2 |
3 |
4 |
1 |
Figure 6. Main effect plots for GRG considering different levels of process parameter
3.3 ANOVA for GRG
ANOVA analyses performance factors. Table 11 sorts total GRG variability by the sum of squared departures from its typical value. ANOVA is conducted on each EWM and PCA parameter. According to Table 11, the most important element is R, which contributes 43.31 percent, followed by L, S, and D, which contribute 27.22 percent, 23.87 percent, and 2.62 percent, respectively.
Table 11. ANOVA table for GRG
|
Parameters |
SSa |
DOFb |
MSc |
F-value |
Contribution % |
|
S |
0.083 |
3 |
0.028 |
7.990 |
23.869 |
|
L |
0.095 |
3 |
0.032 |
9.110 |
27.217 |
|
D |
0.009 |
3 |
0.003 |
0.880 |
2.617 |
|
R |
0.151 |
3 |
0.050 |
14.500 |
43.311 |
|
Error |
0.010 |
3 |
0.003 |
|
2.986 |
|
Total |
0.348 |
15 |
|
|
100.000 |
|
S = 0.059, R2 = 97.01% |
|||||
3.4 Confirmation test
A confirmation test validated experimental results based on the ideal parameter affecting multiple responses of GRG Using Eq. (6). Table 12 demonstrates that expected and experimental findings are substantially comparable, indicating a successful study. The optimal GRG is 0.9430 and the experimental GRG is 0.9441. Experimental and predicted results were found to be identical. The GRA approach is useful for optimising wear when multiple features are to be studied [36].
$\hat{y}=y_m+\sum_{i=1}^q\left(\bar{y}_1-y_m\right)$ (6)
where, $\hat{y}$ means foreseen grey relation grade, $y_m$ means average value of GRG, $y_i$ GRG at optimum levels and q equals to number of factors.
Table 12. Confirmation test
|
|
Predicted |
Experimental |
|
Preeminent process parameters |
S1 L4 D3 R4 |
S1 L4 D3 R4 |
|
GRG |
0.9430 |
0.9441 |
3.5 Wear morphology
SEM analysis was used to look at the tattered surfaces of manufactured composites at different conditions i.e in both ideal and poorest-case scenarios. Patnaik et al. [37] studied that the properties under sliding wear of the base alloy were amended with the inclusion of pine-bark particles as reinforcement. In a similar manner, carbon fibres are included into the base polyester in this work, which is then followed by multi-parameter optimization utilising EWM and PCA approach. The optimal condition is still the same for both the EWM and the PCA techniques, and it is analysed with the help of SEM micrographs. Figure 7 shows the surface of the pure polyester that has become worn down over time. It was discovered that the primary abrasive wear mechanism led to the formation of a huge number of cracks and scratches on the worn surfaces. It has also been discovered that the matrix material flows plastically in the sliding direction. This was discovered. Because frictional heat generation causes softening of the thermoplastic polyester in response to a rise in the load or sliding velocity, this phenomenon is completely understandable.
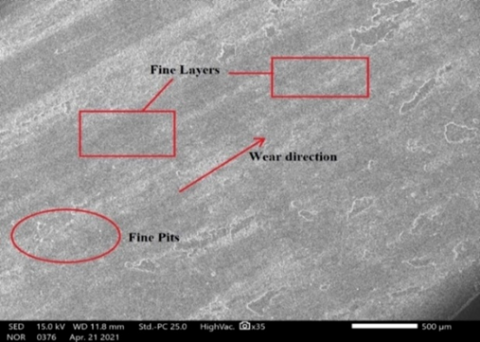
Because the carbon fibre particles are dispersed throughout the material and coagulated, the wear resistance is increased [38]. Later on, based on optimal parameter obtained from both the methods, test is conducted with a sliding velocity of 2 m/s under a load of 20 N and at 6 percent CF by weight, and SEM micrographs are collected on the surface and Figure 8. depicts the results of those micrographs. However, longer sliding times lead to the creation of wear debris in a variety of sizes and forms, whereas it was noted that the generation of fine ruts and layers obtained for optimal combination indicating that the material is resistant to wear. During the course of the studies, it was discovered that deep grooves combined with delamination was the most problematic combination of process variables [39, 40].
Figure 7. Worn surface of Pure Polyester
Figure 8. Worn surface of CFRP composite at a Sliding velocity of 2 m/s, Load of 20N, Sliding distance of 3000m and 6 Wt% CF (S1 L4 D3 R4)
The present work deals with the implementation of Taguchi – PCA/GRA methods to find the best process parameters for wear behaviour under the given conditions. The following conclusions were drawn from the present investigation.
The authors would like to thank the Research Centre in the Department of Mechanical Engineering at R.V.R. & J.C. College of Engineering, Guntur for arranging the necessary facilities to carry out the present investigation.
[1] Nayak, S.K., Satapathy, A. (2021). Development and characterization of polymer-based composites filled with micro-sized waste marble dust. Polymers and Polymer Composites, 29(5): 497-508. https://doi.org/10.1177%2F0967391120926066
[2] Rajini, N., Mayandi, K., Prabhakar, M.M., Siengchin, S., Ayrilmis, N., Bennet, C., Ismail, S.O. (2021). Tribological properties of cyperus pangorei fibre reinforced polyester composites (friction and wear behaviour of cyperus pangorei fibre/polyester composites). Journal of Natural Fibers, 18(2): 261-273. https://doi.org/10.1080/15440478.2019.1621232
[3] Din, S.H., Shah, M.A., Sheikh, N.A., Butt, M.M. (2020). Nano-composites and their applications: A review. Characterization and Application of Nanomaterials, 3(1): 40-48.
[4] İlhan, R., Feyzullahoğlu, E. (2022). Investigation of adhesive wear properties of glass fiber reinforced polyester composites having different chemical compositions. Proceedings of the Institution of Mechanical Engineers, Part J: Journal of Engineering Tribology, 236(1): 156-173. https://doi.org/10.1177%2F13506501211005941
[5] Nassar, A., Younis, M., Ismail, M., Nassar, E. (2022). Improved wear-resistant performance of epoxy resin composites using ceramic particles. Polymers, 14(2): 333. https://doi.org/10.3390/polym14020333
[6] He, Y., Guo, Z., Wu, Z., Yuan, C. (2021). Effect of polyester fiber orientation on the tribological properties of ultrahigh molecular weight polyethylene composites for water lubrication. Tribology International, 158: 106935. https://doi.org/10.1016/j.triboint.2021.106935
[7] Venu, G., Jayan, J.S., Saritha, A., Joseph, K. (2022). Thermal decomposition behavior and flame retardancy of bioepoxies, their blends and composites: A comprehensive review. European Polymer Journal, 162: 110904. https://doi.org/10.1016/j.eurpolymj.2021.110904
[8] Mir, A.H., Charoo, M.S. (2019). Friction and wear characteristics of polyetheretherketone (PEEK): A review. In IOP Conference Series: Materials Science and Engineering, Tamil Nadu, India. https://doi.org/10.1088/1757-899X/561/1/012051
[9] Wang, B., Gao, H. (2021). Fibre reinforced polymer composites. In Advances in Machining of Composite Materials. Springer, Cham. https://doi.org/10.1007/978-3-030-71438-3_2
[10] Messana, A., Sisca, L., Ferraris, A., Airale, A.G, De Carvalho Pinheiro, H., Sanfilippo, P., Carello, M. (2019). From design to manufacture of a carbon fiber monocoque for a three-wheeler vehicle prototype. Materials, 12(3): 332. https://doi.org/10.3390/ma12030332
[11] Sai Kumar, M.V., Sai Ram, Y.N.V. (2022). Tribological behaviour of carbon fiber reinforced polyester composites. In Recent Advances in Manufacturing Processes. Springer, Singapore. https://doi.org/10.1007/978-981-16-3686-8_1
[12] Boga, C., Koroglu, T. (2021). Proper estimation of surface roughness using hybrid intelligence based on artificial neural network and genetic algorithm. Journal of Manufacturing Processes, 70: 560-569. https://doi.org/10.1016/j.jmapro.2021.08.062
[13] Bellubbi, S., N, S., Mallick, B. (2022). Multi response optimization of ECDM process parameters for machining of microchannel in silica glass using Taguchi–GRA technique. Silicon, 14(8): 4249-4263. https://doi.org/10.1007/s12633-021-01167-4
[14] Nayim, S.T.I., Hasan, M.Z., Jamwal, A., Thakur, S., Gupta, S. (2019). Recent trends & developments in optimization and modelling of electro-discharge machining using modern techniques: A review. In AIP Conference Proceedings, 2148(1). AIP Publishing LLC. https://doi.org/10.1063/1.5123973
[15] Geeth, K.M., Reddy, M.C.S., Sai Kumar, M.V. (2021). Optimization of dry-sliding wear parameters on carbon fiber reinforced polyester composites using Taguchi based grey relation analysis. In IOP Conference Series: Materials Science and Engineering, Bapatla, Andhra Pradesh, India. https://doi.org/10.1088/1757-899X/1185/1/012003
[16] Yellapragada, N.V.S., Devarakonda, S.K., Dasari, K.R., Thati, N.S.R.K., Alapati, J.S.A.V.V.P. (2022). Effectiveness of Shannon entropy weight method on wear behaviour of polyester/carbon fibre composites using GRA. Annales de Chimie - Science des Matériaux, 46(1): 9-17. https://doi.org/10.18280/acsm.460102
[17] Praveen, D.V., Raju, D.R., Raju, M.V.J. (2021). Assessment of optimal parameters of wire EDM on Ni-Coated Al2O3p/AA7075 MMCs using PCA coupled GRA. Arabian Journal for Science and Engineering, 46: 7953-7966. https://doi.org/10.1007/s13369-021-05579-7
[18] Swapna, D., Srinivasa Rao, C., Sameer Kumar, D., Radhika, S. (2022). Taguchi based GRA-PCA hybrid optimization for the forming of AL6061 alloy in automotive applications. Sigma Journal of Engineering and Natural Sciences, 40(4): 742-754. https://doi.org/10.14744/sigma.2022.00090
[19] Qazi, M.I., Akhtar R., Abas, M., Khalid, Q.S., Babar A.R., Pruncu, C.I. (2020). An integrated approach of GRA coupled with Principal Component Analysis for multi-optimization of Shielded Metal Arc Welding (SMAW) Process. Materials. 13(16): 3457. https://doi.org/10.3390/ma13163457
[20] Sai Ram, Y.N.V., Kammaluddin, S., Shabana, Raj, C.D., MastanRao, P. (2016). Sliding wear behavior of high velocity oxy-fuel sprayed WC-CO coatings. International Journal of Advanced Science and Technology, 93: 45-54. https://www.earticle.net/Article/A284054
[21] Srividya, K., Reddy, S.P., Prasad, K.H., Thati, N.S.R.K., Snehita, K., Pranay, U.S., Yellapragada, N.V.S. (2023). Optimization of process parameters for preparation of Lanthanum Hexa-Aluminate powders using combinatorial approach of Taguchi-GRA and ACO methods. Annales de Chimie - Science des Matériaux, 47(1): 43-50. https://doi.org/10.18280/acsm.470106
[22] Tarasasanka, C., Ravindra, K. (2017). Application of Taguchi techniques to study dry sliding wear behaviour of magnesium matrix composites reinforced with alumina nano particles. Journal of Engineering Science and Technology, 12(11): 2855-2865.
[23] Jayan, V., Radhika, N. (2020). Taguchi’s technique in optimization of process parameters on Wear behaviour of Cu/Si3N4 Metal Matrix Composite. Materials Today: Proceedings, 24: 1052-1063. https://doi.org/10.1016/j.matpr.2020.04.419
[24] Patel, N.S., Parihar, P.L., Makwana, J.S. (2021). Parametric optimization to improve the machining process by using Taguchi method: A review. Materials Today: Proceedings, 47: 2709-2714. https://doi.org/10.1016/j.matpr.2021.03.005
[25] Abifarin, J.K. (2021). Taguchi grey relational analysis on the mechanical properties of natural hydroxyapatite: Effect of sintering parameters. The International Journal of Advanced Manufacturing Technology, 117: 49-57. https://doi.org/10.1007/s00170-021-07288-9
[26] Ononiwu, N.H., Ozoegwu, C.G., Madushele, N., Akinlabi, E.T. (2021). Characterization, machinability studies, and multi-response optimization of AA 6082 hybrid metal matrix composite. The International Journal of Advanced Manufacturing Technology, 116: 1555-1573. https://doi.org/10.1007/s00170-021-07549-7
[27] Sivasankara Raju, R., Rao, C.J., Sreeramulu, D., Prasad, K. (2020). Evaluation of optimization parametric condition during machining for Al-CSA composite using response surface methodology. In Innovative Product Design and Intelligent Manufacturing Systems. Springer, Singapore. https://doi.org/10.1007/978-981-15-2696-1_46
[28] Tarasasanka, C., Snehita, K., Ravindra, K. Sameerkumar D. (2019). Optimization of dry sliding wear properties of AZ91E/nano Al2O3 reinforced metal matrix composite with grey relational analysis. International Journal of Engineering, Science and Technology, 11(4). https://doi.org/10.4314/ijest.v11i4.4
[29] Ynv, S.R., Tara Sasanka, C., Prabakaran, J. (2022). Optimization of dry-sliding wear parameters on lanthanum hexa aluminate reinforced magnesium AZ91E composites using grey relation analysis. Nano Hybrids and Composites, 35: 55-73. https://doi.org/10.4028/p-08w7lk
[30] Sahoo, A.K., Jeet, S., Bagal, D.K., Barua, A., Pattanaik, A.K., Behera, N. (2021). Parametric optimization of CNC-drilling of Inconel 718 with cryogenically treated drill-bit using Taguchi-Whale optimization algorithm. Materials Today: Proceedings, 50: 1591-1598. https://doi.org/10.1016/j.matpr.2021.09.121
[31] Nanda, B.P., Satapathy, A. (2021). An analysis of the sliding wear characteristics of epoxy-based hybrid composites using response surface method and neural computation. Journal of Natural Fibers, 18(12): 2077-2091. https://doi.org/10.1080/15440478.2020.1722781
[32] Eser, A., Aşkar Ayyıldız, E., Ayyıldız, M., Kara, F. (2021). Artificial intelligence-based surface roughness estimation modelling for milling of AA6061 alloy. Advances in Materials Science and Engineering, 2021. https://doi.org/10.1155/2021/5576600
[33] Ahmed, R.K., Saad, E.M., Fahmy, H.M., El Nashar, R.M. (2022). Multivariate experimental design: Towards more reliable electrochemical detection. Current Opinion in Electrochemistry, 31. https://doi.org/10.1016/j.coelec.2021.100880
[34] Wojciechowski, S., Maruda, R.W., Krolczyk G.M., Niesłony, P. (2018). Application of signal to noise ratio and grey relational analysis to minimize forces and vibrations during precise ball end milling. Precision Engineering, 51: 582-596 https://doi.org/10.1016/j.precisioneng.2017.10.014
[35] Muthu, P. (2020). Multi objective optimization of wear behaviour of Aluminum MMCs using Grey-Taguchi method. Manufacturing Review, 7. https://doi.org/10.1051/mfreview/2020013
[36] Parthiban, M., Harinath, M. (2021). Analysis of tool wear in micro-EDM drilling using response surface methodology. In Materials, Design, and Manufacturing for Sustainable Environment. Springer, Singapore. https://doi.org/10.1007/978-981-15-9809-8_25
[37] Patnaik, A., Satapathy, A., Dwivedy, M., Biswas, S. (2010). Wear behavior of plant fiber (pine-bark) and cement kiln dust-reinforced polyester composites using Taguchi experimental model. Journal of Composite Materials, 44(5): 559-574. https://doi.org/10.1177/0021998309346547
[38] Satapathy, A., Patnaik, A. (2010). Analysis of dry sliding wear behavior of red mud filled polyester composites using the Taguchi method. Journal of Reinforced Plastics and Composites, 29(19): 2883-2897. https://doi.org/10.1177/0731684408092453
[39] Abenojar, J., Martínez, M.A., de Armentia, S.L., Paz, E., del Real, J.C., Velasco, F. (2021). Mechanical properties and fire-resistance of composites with marble particles. Journal of Materials Research and Technology, 12: 1403-1417. https://doi.org/10.1016/j.jmrt.2021.03.071
[40] Kumar, S., Prasad, L., Patel, V.K., Kumain, A., Yadav, A. (2021). Experimental and numerical study on physico‐mechanical properties and Taguchi's designed abrasive wear behavior of hemp/nettle‐polyester hybrid composite. Polymer Composites, 42(12): 6912-6927. https://doi.org/10.1002/pc.26350