Qian Li | Keqing Li* | Wen Ni | Siqi Zhang | Dezhong Li | Wei Chen
OPEN ACCESS
This paper prepares an aerated concrete (AC) with gold tailings as the main material, and explores the influence of different phases of autoclave curing on the microstructure of the proposed AC. Three specimens were selected for nuclear magnetic resonance (NMR) tests: the specimen not autoclaved after the 12h static curing, the specimen autoclaved for 0h in the autoclave (i.e. only heated up and cooled down), and the specimen autoclaved for 8h under constant temperature. The three specimens are denoted as NAC, AAC-0 and AAC-8, respectively. The internal structures of the specimens in each phase of autoclave curing were analyzed through 27Al NMR and 29Si NMR tests. The results show that the Si-O tetrahedrons in the AAC-8 specimen mainly exist in the form of Q2 structures; the 1.1nm tobermite crystal is a chain silicate. The research results help to reveal the reaction mechanism of the AC in each phase of curing, and improve the performance of gold tailings-based AC.
gold tailings, aerated concrete, autoclave curing, nuclear magnetic resonance (NMR)
The metallurgical industry is developing rapidly in China, raising a growing demand for minerals. In the meantime, more and more tailings are generated. To date, the total amount of various tailings in China has exceeded 50 billion tons, with an annual growth of over 300 million tons. Many of the tailings are directly abandoned, causing a waste of natural resources. What is worse, the abandonment brings about numerous environmental problems, such as land occupation and pollution [1]. This calls for a circular economy system that can fully utilize tailings, protect the environment and reduce the consumption of nonrecyclable mineral resources.
Currently, the tailings are mainly reused to prepare cement-based composites, decorative glass, glass ceramics, soil conditioners, cementitious fillers, etc. These recycling methods have problems like poor utilization rate and low added value. The aerated concrete (AC) is a lightweight, high-strength building material with excellent performance in heat preservation, sound insulation and noise reduction. The AC production can consume a huge number of tailings, turning the waste into high value-added materials and saving lots of mineral materials. Therefore, the fabrication of AC with tailings is a promising way to develop green, energy-efficient building materials and promote circular economy [2-7].
Autoclaved aerated concrete (AAC) is a porous concrete prepared from fine Si material, pore-forming Al powder and water, with cement, lime and gypsum as binders. The strength of the AAC is acquired through autoclave curing. During autoclave curing, the Si material will continue to dissolve and undergo thermal synthesis with calcareous material, with the gradual increase of temperature and time. In this way, the AC performance is changed in a short time. The changes in performance, induced by the variation in composition and curing method, can only be obtained by studying the hydration products and microstructure [8].
Many scholars have explored the performance of the AC. Through X-ray diffraction (XRD) and scanning electron microscopy (SEM), Narayanan and Ramamurthy [9] explored the AAC and non-AAC structures in the AC, identified the causes to the variation in compressive strength and dry shrinkage of concrete, and discussed the relationship between the paste-pore interface in the AC and the paste-aggregate interface in common concrete, concluding that the large pore size distribution in the interface transition zone has little effect on compressive strength. Hülya [10] studied the microstructural changes of the AAC, especially the structural changes induced by chemical degradation, confirmed that tobermorite gradually becomes calcium carbonate with the increase of exposure time through the XRD, and found that calcite and gypsum are the two main crystal structures growing in the weathering process through SEM and energy-dispersive X-ray spectroscopy (EDS). Using analytical methods like the XRD and the SEM, Wang et al. [11] analyzed the microstructure of aerated crushed stone concrete, and drew the following conclusions: the hydration products of the concrete are Calcium silicate hydrate (C-S-H) (B), tobermorite and water ligands, unreacted SiO2 may exist in the concrete, and the AC structure is uniform and dense.
The existing studies on the AC mainly focus on the influence of microstructure on performance. The nuclear magnetic resonance (NMR) has not been widely adopted to explore the internal structure and reaction mechanism of the AC in each phase of autoclave curing. To make up for the gap, this paper prepares an AAC from gold tailings, a typical industrial waste, with a utilization rate of over 50%. Then, the NMR was conducted to analyze the AC specimens in each phase of autoclave curing. Based on the acquired structural information, the author summed up the reaction mechanism of the AC throughout the autoclave curing process. The research results lay a theoretical basis for preparing the AAC from gold tailings.
As mentioned in the abstract section, it will be rather easy to follow these rules as long as you just replace the “content” here without modifying the “form”.
2.1 Raw materials
(1) Gold tailings
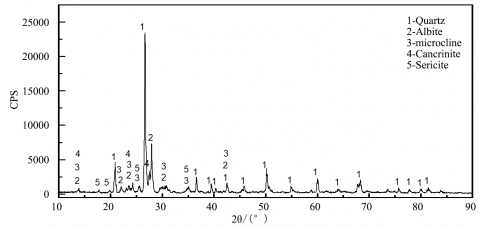
The gold tailings were provided by Shandong Jiuqu Shengji New Building Materials Co., Ltd., China. The chemical composition and XRD pattern of the gold tailings are provided in Table 1 and Figure 1, respectively.
Figure 1. The XRD pattern of gold tailings
Table 1. The chemical composition of gold tailings
|
Raw materials |
Mass fraction /% |
|||||||
|
SiO2 |
Al2O3 |
Fe2O3 |
MgO |
CaO |
Na2O |
K2O |
Ignition loss |
|
|
Gold tailings |
73.83 |
12.16 |
0.77 |
2.08 |
1.68 |
2.89 |
4.24 |
1.69 |
|
Cement |
24.37 |
6.69 |
2.41 |
5.27 |
55.24 |
0.80 |
1.12 |
1.79 |
|
Lime |
2.81 |
1.08 |
0.48 |
3.02 |
84.04 |
0.56 |
0.70 |
7.23 |
|
Natural gypsum |
3.91 |
3.61 |
0.19 |
8.94 |
30.93 |
0.32 |
0.61 |
25.49 |
As shown in Figure 1, the main minerals in the gold tailings are quartz, followed in turn by albite, sericite, microcline, and cancrinite.
As shown in Table 1, the top two chemical components of the gold tailings are SiO2 (73.83%) and Al2O3 (12.16%). The other components are not high in content.
(2) Cement
The cement used in our tests is the ordinary Portland cement (strength grade: 42.5) produced by Beijing Liulihe Environmental Protection Technology Co., Ltd. The chemical composition of the cement is shown in Table 1.
(3) Lime
Our tests use the medium-speed digestion lime produced by Beijing BBMG Autoclaved Aerated Concrete Co., Ltd. The content of active CaO is about 65%; the MgO content is smaller than 6%; the ignition loss is equal to or smaller than 8%; the residue on a 0.08mm square-hole sieve is about 12~15%; the digestion time is 12min; the digestion temperature is up to 65°C. The chemical composition of the lime is shown in Table 1.
(4) Gypsum
Natural gypsum was selected for our tests. The chemical composition of natural gypsum is shown in Table 1.
(5) Foaming agent
The foaming agent is the FQ-80B hydrophilic Al powder produced by Harbin Dongqing Metals Manufacturing Co., Ltd. The content of active Al is greater than or equal to 90%; the residue on a 0.08mm square-hole sieve is less than or equal to 3.0%; the foaming rate is greater than or equal to 80%; the foaming time is smaller than or equal to 20min; the hydrophilicity is smaller than or equal to 20s.
2.2 Specimen preparation
The formula has been optimized through orthogonal experiments: gold tailings, 58wt%; lime, 26wt%; cement, 11wt%; gypsum, 5wt%; Al powder, 0.048wt%; water-material ratio, 0.59.
Before the tests, weight the raw materials, mix them uniformly, and put the mixture into a material barrel. Add 55°C warm water and stir for about 120s. Then, add Al powder and stir for about 40s. Pour the slurry quickly into the mold, and allow it to stand for 3h at 70°C. Remove the mold after the blank is hardened. Put the blank into a ZCF-40 autoclave for autoclave curing at 1.35MPa and 185°C±5°C. Keep the temperature constant for 8h.
During the curing process, take three specimens based on the changing points of curing conditions for further comparison, namely, the specimen not autoclaved after the 12h static curing, the specimen autoclaved for 0h in the autoclave (i.e. only heated up and cooled down), and the specimen autoclaved for 8h under constant temperature. The three specimens are denoted as NAC, AAC-0 and AAC-8, respectively.
Next, immerse the three specimens in alcohol for 24h. Finally, take the samples out, and dry them at low temperature (55°C), preparing for 27Al NMR and 29Si NMR tests.
3.1 27Al NMR analysis on AC specimens
In silicate minerals, the Al either exists as metal cations or replaces Si. In the former case, the Al3+ has little impact on the Si-O skeleton. The chemical environment of the Al3+ can be obtained through the analysis of 27Al-NMR signals. In the latter case, the Al3+ can displace Si4+ disorderly, because the two ions are similar in size. Then, Al3+ and Si4+ form an Al-Si-O tetrahedral skeleton, forming aluminosilicates. In this case, Al3+ has a significant impact on the Si-O skeleton [12].
The 27Al-NMR signals may correspond to three types of aluminate structures: AlO6, AlO5 and AlO4. The chemical shift of each aluminate structure is shown in Table 2. Normally, AlO4 exists as Al-O-Si chains, while AlO5 and AlO6 exist between Si-O tetrahedrons and on the surface of particles [3].
Table 2. Chemical shifts of aluminate structures corresponding to 27Al-NMR signals
|
Coordination number for Al |
Chemical shift (ppm) |
|
Four (AlO4) |
50~85 |
|
Five (AlO5) |
23~35 |
|
Six (AlO6) |
-10~15 |
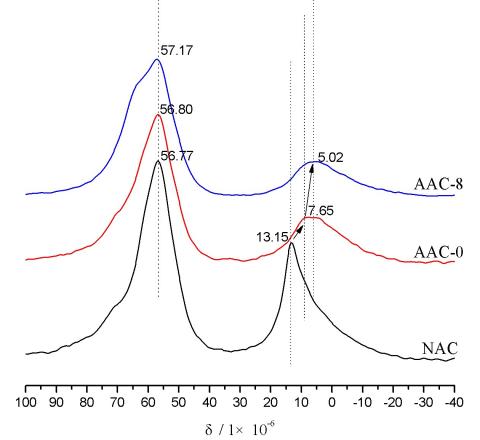
In the 27Al NMR spectrum of the NAC product, a typical resonance absorption peak with good symmetry was observed at the chemical shift of 56.77ppm. This is a characteristic resonance absorption peak of AlO4, which is attributable to the residual albite and microcline, plus the hydration product C-A-H gel. Another typical resonance absorption peak with a good symmetry appeared at about 13.15ppm. This is a characteristic resonance absorption peak of AlO6, which reflects the formation of ettringite [13]. Therefore, the Al in the NAC specimen still exists in the form of AlO4, as it was in albite and microcline, that is, albite and microcline are not involved in the reaction when the blank is hardened [7]. Besides, the early strength of the NAC specimen partly comes from the generation of lots of C-A-H gel and ettringite.
In the 27Al NMR spectrum of the AAC-0 product, the resonance absorption peak of AlO4 is similar to that in the spectrum of the NAC product. However, the resonance absorption peaks of AlO6 are not as sharp as that in the spectrum of the NAC product. Instead, these peaks are relatively broad and low in intensity, and shift towards the negative direction by 5.5ppm. The results show that, in the AAC-0 product, the ettringite is completely decomposed under high temperature and high pressure. After the decomposition, the Al mainly replaces the Si in Si-O tetrahedrons as AlO4, forming Al-O-Si chains. The residual Al attach onto the surface of the mineral particles as AlO6 in the form of a polymer [Al(OH)6]3- [14, 15].
In the 27Al NMR spectrum of the AAC-8 product, compared with that of the AAC-0 product, the chemical shift of AlO4 shifts slightly towards the positive direction, and the corresponding resonance absorption peak becomes wider with obvious shoulders; the resonance absorption peaks of AlO6 also become wider, with the chemical shift migrating to 5.02ppm. This shows that, in the AAC-8 product, AlO6 continues to transform to AlO4 under the driving force of high temperature and high pressure, and replace the Si in some Si-O tetrahedrons. This process is accompanied by the generation of a certain type of crystals, such that 27Al appears in large quantities in a stable chemical environment. Through further analysis, it is deduced that the Al replacement of tobermullite crystals are the cause for the obvious peak shoulders in the 27Al NMR spectrum.
Figure 2. The 27Al NMR spectra of the three specimens
3.2 29Si NMR analysis on AC specimens
In the Si-O tetrahedron skeleton, there are 5 possible chemical environments for 29Si atoms, depending on the aggregation degree of the tetrahedrons. In the NMR test, five 29Si-NMR signals were adopted to represent the five possible environments. Generally, the chemical environment of 29Si is denoted by a simplified Qn structure, where n=0~4 is the number of the bridging oxygens (Si-O-Si) between each Si-O tetrahedron and other Si atoms.
The Si-O tetrahedron is not necessarily a perfect tetrahedron. There might be different forms or degrees of distortion [16]. Moreover, the replacement or arrangement is locally disorderly in structure of the aluminosilicate minerals. Thus, the chemical shift of a structure in the NMR spectrum is not a fixed value, but an interval. For example, the chemical shift of Q4 falls in 98~129ppm. The types of silicate Qn structures and their chemical shift intervals are listed in Table 3 [11].
Besides, Si4+ can be replaced with Al3+. The Al-O bond formed in the replacement differ from the Si-O bond in energy and length. This will result in a change of chemical shift in the 29Si-NMR spectrum. Normally, the chemical shift will decrease, with a growing number of Si4+ being replaced by Al3+. Therefore, the 29SiNMR analysis on aluminosilicate minerals must consider how the structure is influenced by the number of Si4+ being replaced by Al3+ and by the replacement itself [17].
Corresponding to the Qn structure, the five possible environments of Si atoms in the skeleton were represented as Qn (mAl) in the NMR analysis on aluminosilicates, where n=0~4 is the number of the bridging oxygens (Si-O-Si) and m is the number of Si4+ being replaced by Al3+. If n=3 and m=2, there are three bridging oxygens around each Si atom, including two Si-O-Al and one Si-O-Si. In this case, the chemical environment can be denoted as Q3 (2Al). During our tests, silicate and aluminosilicate minerals were simultaneously analyzed by 29Si NMR.
Figure 3 compares the 29Si NMR spectra of the three specimens with different autoclave curing conditions. There are many scattered resonance absorption peaks in the 29Si NMR spectrum of the NAC product, indicating that the chemical environment of Si atoms inside the specimen is chaotic and the hydration produces various products. With the progress of autoclave curing, the 29Si NMR spectrum becomes increasingly symmetric. In the 29Si NMR spectrum of the AAC-0 product, there are two main resonance absorption peaks. In the 29Si NMR spectrum of the AAC-8 product, the two resonance absorption peaks merge into one. The comparison shows, with the progress of autoclave curing, the chemical environment of Si atoms in the specimens becomes increasingly stable, and the structure of the atoms is gradually simplified.
Table 3. Chemical shifts of silicate Qn structural elements
|
Qn |
Chemical shift (ppm) |
Place |
Structure |
|
Q0 |
-68~-76 |
Insular Si-O skeleton |
O O-Si-O O |
|
Q1 |
-76~-82 |
Dimer or end group |
O O-Si-O- O |
|
Q2 |
-82~-88 |
Middle of a straight chain or ring |
O -O-Si-O- O |
|
Q3 |
-88~-98 |
Layer or branch chain |
O -O-Si-O- O |
|
Q4 |
-98~-129 |
3D skeleton |
O -O-Si-O- O |
Figure 3. The 29Si NMR spectra of the three specimens
To identify the composition and structural variation of the silicates inside the specimens, the part covering the chemical shift interval of -50~-130ppm was taken out from the 29Si NMR spectra on the three specimens, and magnified for further comparison (Figures 5, 6 and 7).
Tables 4, 5, and 6 show the structures corresponding to the resonance absorption peaks of the three specimens, NAC, AAC-0 and AAC-8, and the peaks fitted based on NMR data. The previous studies [18, 19] have shown that the resonance absorption peaks of C-S-H gel mainly appear at about -79.5ppm and -85.3ppm. According to the research of Angst et al., [19], the resonance absorption peaks at chemical shifts of -92.6ppm, -94.5ppm, -96.6ppm, -100.2ppm and -104.5ppm belong to albite and microcline. Singh [20] discovered that, in an ideal state, the replacement of a Si in the Si-O tetrahedron by an Al will cause the chemical shift to decrease by 5ppm in the 29Si NMR spectrum. Besides, the chemical shift will move by 2ppm further due to the change of bond angle through the replacement.
According to the 29Si NMR spectrum of the NAC specimen (Figure 4), the sharp resonance absorption peaks at -71.0ppm and -72.8ppm belong to the Q1(1Al) structure. Two peak positions appeared due to the different bonding angles of the newly formed Al-O-Si. The reason for such a structure to emerge is that Al-O is more active than Si-O. During the hydration of cement, the Si in the dimer structure can be easily replaced by Al to produce Al-O-Si. As shown in Table 4, this Q1 structure accounts for 9.4wt% of all silicates in the NAC specimen. Therefore, the early-phase dimer structure products of Portland cement hydration still exist in large quantities in the NAC specimen, through the static curing.
The resonance absorption peak at -75.2ppm belongs to the Q0H structure (hydrated silicate monomer), which is the [SiO4] dissolved on mineral surfaces in the mixed slurry. The resonance absorption peaks at -81.2ppm and -85.6ppm belong to Q2(2Al) and Q2(1Al), respectively. The two structures, appearing as C-S-H gel chains, saw Si replaced by Al. Most hydration products in the NAC specimen are in these structures. However, the total mass of the structures only accounts for 33.4% of the NAC specimen. Hence, the hydration products in NAC specimen are not highly polymerized [20-21].
The resonance absorption peaks at -92.4ppm, -96.2ppm, -100.0ppm, -104.6ppm and 106.9ppm characterize the structures of Q3(1Al), Q4(3Al), Q4(2Al), Q4(1Al) and Q4(1Al), respectively, and are the characteristic absorption peaks of albite and microcline. Among them, the peak at -92.4ppm signifies the chemical shift of the Si-O tetrahedrons on the surface of albite and microcline, and the other peaks reflect the chemical shift of the internal skeleton of the two minerals.
Figure 4. Local 29Si NMR spectrum of the NAC specimen
Table 4. The peaks fitted based on NMR data of the NAC specimen
|
Specimen |
Structure |
Chemical shift |
Relative area |
Content /% |
|
NAC |
Q1(1Al) |
-71.0 |
1.0 |
5.0% |
|
Q1(1Al) |
-72.8 |
0.9 |
4.4% |
|
|
Q0H |
-75.2 |
0.6 |
2.8% |
|
|
Q2(2Al) |
-81.2 |
2.5 |
12.8% |
|
|
Q2(1Al) |
-85.6 |
4.1 |
20.6% |
|
|
Q3(2Al) |
-89.8 |
1.1 |
5.4% |
|
|
Q3(1Al) |
-92.4 |
1.2 |
6.1% |
|
|
Q4(3Al) |
-96.2 |
2.8 |
13.9% |
|
|
Q4(2Al) |
-100.0 |
2.1 |
10.4% |
|
|
Q4(1Al) |
-104.6 |
1.1 |
5.7% |
|
|
Q4(1Al) |
-106.9 |
1.3 |
6.6% |
|
|
Q4 |
-109.3 |
1.3 |
6.4% |
According to the 29Si NMR spectrum of the AAC-0 specimen (Figure 5), two sharp main peaks appeared at the chemical shifts of -72.0ppm and -84.2ppm, respectively, different from the positions in the spectrum of the NAC specimen. The two sharp peaks are attributable to Q1(1Al) and Q2(1Al) structures, respectively. As shown in Table 5, the Q1(1Al) content reached 20.2% in the AAC-0 specimen, 10.8% higher than that in the NAC specimen, and the corresponding chemical shift moved slightly; the Q2(1Al) content stood at 51.5% in the AAC-0 specimen, 30.9% up from the level in the NAC specimen.
There is no resonance absorption peak of the Q0H structure in Figure 5. Moreover, the resonance absorption peaks at -100.7ppm and 106.4ppm belong to albite and microcline. The total content of Si-O tetrahedral skeleton characterized by the two peaks was 7% fewer than that in the NAC specimen. Meanwhile, no resonance absorption peak was found to characterize the structures like Q3(1Al), Q4(3Al) and Q4(2Al). Finally, the resonance absorption peak at -110.2ppm characterizes quartz, whose content was smaller than that in the NAC specimen.
The above phenomena show that, with the progress of autoclaving, the Al-O bonds in minerals are more likely to break than Si-O bonds in the high-temperature alkaline environment. As a result, the structures with a high Al content easily break off the mineral surface. The dissolved insular [SiO4] quickly takes part in the hydrothermal reaction. Meanwhile, the [(Q1) AlO4], which dissolved in the form of dimer, is partially accumulated on the mineral surface. That is why the content of Q1(1Al) structure in the AAC-0 specimen is much higher than that of the NAC specimen. Through the hydrothermal reaction, the Ca2+ is combined with Al-O-Si bonds or residual non-bridging oxygen bonds under the effect of charge balance, creating a large amount of calcium-rich C-S-H gel chains. As a result, there are many highly intense and symmetric resonance absorption peaks of Q2(1Al) structure in the 29Si NMR spectrum of the AAC-0 specimen [22].
Figure 5. Local 29Si NMR spectrum of the AAC-0 specimen
Table 5. The peaks fitted based on NMR data of the AAC-0 specimen
|
Specimen |
Structure |
Chemical shift |
Relative area |
Content /% |
|
AAC-0 |
— |
-63.7 |
1 |
2.3% |
|
Q1(1Al) |
-71.3 |
8.6 |
20.2% |
|
|
Q2(1Al) |
-83.9 |
21.94 |
51.5% |
|
|
Q3(1Al) |
-92.5 |
5.3 |
12.4% |
|
|
Q4(2Al) |
-100.7 |
2.36 |
5.5% |
|
|
Q4(1Al) |
-106.4 |
1.83 |
4.3% |
|
|
Q4 |
-110.2 |
1.59 |
3.7% |
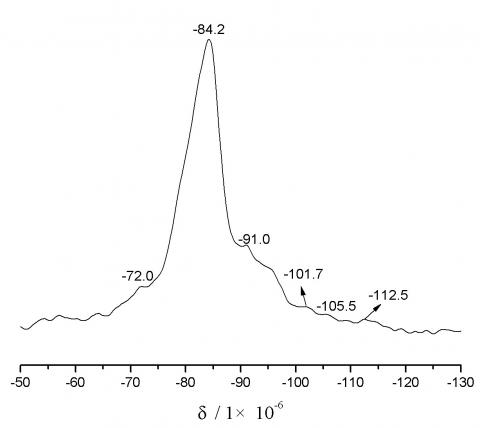
According to the 29Si NMR spectrum of the AAC-8 specimen (Figure 6), there is only one main peak at the chemical shift of -84.2 ppm, while there are two main peaks in the spectrum of the AAC-0 specimen. This main peak belongs to the Q2(1Al) structure, whose content was 75.6%. By contrast, the structure characterized by the resonance absorption peak at -72.0ppm only was merely 3.8% in content. The Si-O tetrahedrons of the Q1(1Al) structure in AAC-8 specimen were 16.4% fewer than those of the AAC-0 specimen. It can be seen that, with the elapse of constant-temperature autoclave curing, the Si-O skeleton dissolved on mineral surface gradually participate in the polymerization reaction, and the following parameter values are on the rise: the number of bridging oxygens, the length of C-S-H gel chains, and the degree of polymerization for reaction products.
The 29Si NMR spectrum of the AAC-8 specimen bears high resemblance with that of 1.4nm tobermorite and jennite [22]. The only difference lies in the resonance absorption peak of Q3(1Al) structure (content: 8.7%) at the chemical shift of -91.0ppm. According to Table 3, the Si-O skeleton of Q3(1Al) structure appears on the layer or branch chain. There is not yet a clear conclusion on the structure of 1.1nm tobermorite. Judging by our test results, the 1.1nm tobermorite is a chain silicate. The resonance absorption peak of Q3(1Al) structure at -91.0ppm may be the resonance absorption peak of the Si atom on the branch chain of tobermorite crystal. In addition, the resonance absorption peak at -84.2ppm, which corresponds to a high content of Q2(1Al) structure, is formed by the superposition of the resonance absorption peaks of Si atoms in the chain of chain silicate minerals like tobermorite and C-S-H crystals.
Furthermore, the resonance absorption peaks of albite and microcline at -101.7ppm and -105.5ppm are less intense than those in the spectrum of the AAC-0 specimen. The peak at -101.7ppm completely disappeared, and the content of the structure reflected by the peak at -105.5ppm was only 2.05%. This means, with the progress of autoclave curing, the Al-O and Si-O bonds on the surface of albite and microcline gradually break, and then decompose. Then, the [SiO4] and [AlO4] dissolved in the solution produce C-S-H crystals through hydrothermal reaction. Finally, the remnant of the resonance absorption peak for the Si atoms inside the quartz could be observed at -112.5ppm.
Figure 6. Local 29Si NMR spectrum of the AAC-8 specimen
Table 6. The peaks fitted based on NMR data of the AAC-8 specimen
|
Specimen |
Structure |
Chemical shift |
Relative area |
Content /% |
|
AAC-8 |
Q1(1Al) |
-72.0 |
1 |
3.8% |
|
Q2(1Al) |
-84.2 |
19.84 |
75.6% |
|
|
Q3(1Al) |
-91.0 |
4.3 |
8.7% |
|
|
Q4(2Al) |
-101.7 |
0.67 |
2.6% |
|
|
Q4(1Al) |
-105.5 |
0.28 |
2.1% |
|
|
Q4 |
-112.5 |
0.07 |
1.1% |
(1) Early in slurry hardening, the cement particles dissolve rapidly. Among them, C2S, C3S and C3A start to take part in the hydration reaction. In this phase, a certain amount of hydrated silicate monomers is generated in the Q0H structure; Al has a heavy presence in the slurry solution as [AlO4]. As the hydration process proceeds, the hydrated silicate monomers are gradually decalcified, producing C-S-H gel in the form of dimer or short chains; some Al gradually transform into AlO6 within in ettringite.
(2) During the heating process of autoclaving, the mineral surface is dissolved at an increasingly fast rate. The dissolved insular [SiO4] quickly takes part in the hydrothermal reaction. Meanwhile, the [(Q1) AlO4], which dissolved in the form of dimer, is partially accumulated on the mineral surface, and becomes C-S-H gel chains through decalcifications. The degree of polymerization increases for the Si-O skeleton. With the decomposition of ettringite, AlO6 is gradually turned into AlO4 and enters the silicates by replacing Si. The residual Al is precipitated as [Al(OH)6]3-.
(3) During the constant temperature phase of autoclaving, Si and Al exist in a relatively stable chemical environment. The former mainly presents as the Q2 structure in tobermorite and C-S-H crystals, and the latter as AlO6 in tobermorite crystals.
(4) The Si-O tetrahedrons in the AAC-8 specimen mainly exist in the form of Q2 structures. Therefore, it is speculated that the 1.1nm tobermite crystal is a chain silicate.
[1] Meng, Y.H., Ni, W., Zhang, Y.Y. (2010). Current state of ore tailings reusing and its future development in China. China Mine Engineering, 2010(5): 14-19. https://doi.org/CNKI:SUN:YSKS.0.2010-05-005
[2] Reida, C., Bécaert, V., Aubertin, M., Rosenbaum, R.K., Deschênesa, L. (2009). Life cycle assessment of mine tailings management in Canada. Journal of Cleaner Production, 17(4): 471-479. https://doi.org/10.1016/j.jclepro.2008.08.014
[3] Khater, G.A. (2010). Glass-ceramics in the CaO-MgO-Al2O3-SiO2 system based on industrial waste materials. Journal of Non-Crystalline Solids, 356(52-54): 3066-3070. https://doi.org/10.1016/j.jnoncrysol.2010.02.030
[4] Bradshaw, A.D., Hüttl, R.F. (2001). Future minesite restoration involves a broader approach. Ecological Engineering, 17(2): 87-90. https://doi.org/10.1016/S0925-8574(00)00149-X
[5] Roussel, N., Ovarlez, G., Garrault, S., Brumaud, C. (2012). The origins of thixotropy of fresh cement pastes. Cement and Concrete Research, 42(1): 148-157. https://doi.org/10.1016/j.cemconres.2011.09.004
[6] Li, V. (2007). Progress and application of engineered cementitious composites. Kuei Suan Jen Hsueh Pao/ Journal of the Chinese Ceramic Society, 35(4): 531-536. https://doi.org/10.1107/S010876739609229X
[7] Li, D.Z., Ni, W., Zhang, J.W., Wu, H., Zhang, Y.Y. (2011). Phase Transformation of Iron Ore Tailings During Autoclaved Curing. Kuei Suan Jen Hsueh Pao/ Journal of the Chinese Ceramic Society, 39(4): 708-713(6). https://doi.org/10.1631/jzus.B1000185
[8] Caijun, S., Fouad, H.F. (2005). Autoclaved Aerated Concrete - properties and structural design. American Concrete Institute. Special Publication 226.
[9] Narayanan, N., Ramamurthy, K. (2000). Microstructural investigations on aerated concrete. Cement & Concrete Research, 30(3): 457-464. https://doi.org/10.1016/S0008-8846(00)00199-X
[10] Hülya, K., Carlsson, T. (2003). Microstructural investigations of naturally and artificially weathered autoclaved aerated concrete. Cement and Concrete Research, 33(9): 1423-1432. https://doi.org/10.1016/S0008-8846(03)00084-X
[11] Wang, Q.K., Chen, Y.Z., Li, F.X., Sun, T. Xu, B.B. (2006). Microstructure and properties of silty siliceous crushed stone-lime aerated concrete. Journal of Wuhan University of Technology-Mater Sci Ed, 21(2): 17-20. https://doi.org/10.1007/BF02840830
[12] Jonesa, M.R., Macpheeb, D.E., Chudekc, J.A., Hunterc, G., Lannegrandb, R., Talero, R., Scrimgeour, S.N. (2003). Studies using 27Al MAS NMR of AFm and AFt phases and the formation of Friedel’s salt. Cement and Concrete Research, 33: 177-182. https://doi.org/10.1016/s0008-8846(02)00901-8
[13] Beaudoin, J.J., Raki, L., Alizadeh, R. (2009). A 29Si MAS NMR study of modified C-S-H nanostructures. Cement and Concrete Composites, 31(8): 585-590. https://doi.org/10.1016/j.cemconcomp.2008.11.004
[14] Lippmaa, E., Maegi, M., Samoson, A., Engelhardt, G., Grimmer, A.R. (1980). Structural studies of silicates by solid-state high-resolution silicon-29 NMR. Journal of America Chemistry Society, 102(15): 4889-4893. https://doi.org/10.1021/ja00535a008
[15] Palomo, A., Alonso, S., Femandez-Jimenez, A. (2004). Alkaline activation of fly ashes: NMR study of the reaction products. Journal of the American Ceramic Society, 87(6): 1141-1145. https://doi.org/10.1111/j.1551-2916.2004.01141.x
[16] Xu, H., Van Deventer, J.S.J. (200). The geopolymerisation of alumino-silicate minerals. International Journal of Mineral Processing, 59(3): 247-266. https://doi.org/10.1016/S0301-7516(99)00074-5
[17] Lee, W.K.W., van Deventer, J.S.J. (2004). The interface between natural siliceous aggregates and geopolymers. Cement and Concrete Research, 34: 195-206. https://doi.org/10.1016/S0008-8846(03)00250-3
[18] Thomas, J.J., Chen, J.J., Jennings, H.M., Neumann, D.A. (2003). Ca-OH bonding in the C-S-H Gel phase of tricalcium silicate and white Portland cement pastes measured by inelastic neutron scattering. Chemistry of Materials, 15(20): 3813-3817. https://doi.org/10.1021/cm034227f
[19] Angst, U., Elsener, B., Larsen, C.K., Venneslanda, Ø. (2009). Critical chloride content in reinforced concrete — A review. Cement and Concrete Research, 39(12): 1122-1138. https://doi.org/10.1016/j.cemconres.2009.08.006
[20] Singh, P.S., Bastow, T., Trigg, M. (2005). Structural studies of geopolymers by29Si and27Al MAS-NMR. Journal of Materials Science, 40(15): 3951-3961. https://doi.org/10.1007/s10853-005-1915-x
[21] Andrade, C., Alonso, C. (2004). Test methods for on site corrosion rate measurement of steel reinforcement in concrete by means of the polarization resistance method. Materials and Structures, 37(9): 623-643. https://doi.org/10.1007/BF02483292
[22] Singh, P.S., Trgg, M., Burgar, I.M., Bastow, T. (2005). Geopolymer formation processes at room temperature studied by 29Si and 27Al MAS-NMR. Materials Science and Engineering, 396: 392-402. https://doi.org/10.1016/j.msea.2005.02.002