Muhammed Yildirim
© 2022 IIETA. This article is published by IIETA and is licensed under the CC BY 4.0 license (http://creativecommons.org/licenses/by/4.0/).
OPEN ACCESS
Technological developments have led to the emergence of different platforms. Social media platforms are one of the most used platforms recently. In this study, a text-based study was conducted on fake news sharing about COVID-19 in online social networks with Shallow Learning (SL) and Deep Learning (DL) methods. In order to classify the news in the dataset, the news in the dataset is converted into a format that can be understood by the machines in the preprocessing step. In the study, the glove method was used for word representation. The document matrix obtained using the glove method was classified with the proposed hybrid model. In the proposed hybrid model, LSTM and CNN structures are used together. In addition, different Shallow Learning methods accepted in the literature were used to compare the performances of the proposed model, and the results were obtained and these results were compared with the proposed model. Among these models, the most successful results were obtained in the proposed hybrid model. When the performance evaluation metrics obtained are examined, it is obvious that the proposed model can be used to solve many other social media and network problems related to COVID-19.
classifiers, deep learning, fake news detection, naturel language processing, social media analysis
The COVID-19 outbreak, which emerged in Wuhan, China in December 2019, has become one of the most current issues around the world [1]. With the emergence of the COVID-19 epidemic, one of the most talked-about topics on social networks was the COVID-19 epidemic [2]. There has been quite a lot of fake news on this subject that has made people nervous. Since this news on social networks can spread all over the world in a very short time, it is very important to detect this news early. This fake news made on social networks can affect people in different parts of the world in different ways. It is of great importance that this fake news made on social networks is detected as soon as possible [3]. Therefore, the proposed fake news detection system has become necessary to automatically detect fake news content and prevent the spread of these posts.
Since the number of people and organizations using social media networks is increasing day by day, fake news can cause different effects in different media. This can happen to individuals and organizations that benefit from fake news. Social media organizations had to keep their current technological structures up to date in the face of such news. This situation not only returns costs to social media institutions but also damages the reliability of these platforms. The rapid increase in the number of fake news and the inability to detect this news manually brings with it big problems. In order to prevent these problems, the development of computer-aided systems is of great importance.
Fake news on social media platforms did not start with the COVID-19 outbreak. So fake news isn't just linked to the COVID-19 outbreak. Different fake news can be made on many different topics. Fake news has been around for years on social networks. COVID-19 is one of the most topical issues as it affects the whole world. In addition, the deadly effect of the COVID-19 epidemic has increased the number of fake news. Therefore, it can be seen from the performance evaluation metrics of the proposed model that the system to be developed can be used to detect fake news. With the proposed computer-aided system, fake news will be easier to detect.
The COVID-19 epidemic has been affecting the whole world since 2019. The COVID 19 pandemic has added a new dimension to the fake news problem. Fake news produced during the epidemic period, which caused a major crisis in human health, caused new problems in the field of information and news reliability. Researchers have conducted different studies using different methods for detecting fake news.
Al-Ahmed et al. proposed a new model to classify fake COVID-19 news in their study. The researchers used particle swarm optimization, genetic algorithm, and salp swarm algorithm in their proposed model. In this proposed model, an accuracy value of 75.4% was obtained in the Koirala data set. The researchers stated that they reduced the number of features in this study and 303 features were used in the study [4].
Mookdarsanit and colleagues used pre-trained state-of-the-art models to classify fake COVID-19 news. These pre-trained models were fine-tuned. Bert, Ulmfit, and Gpt are the architectures used in the study. While the accuracy value obtained in Bert architecture, which is one of the transfer learning architectures, is 62.86%, the accuracy value obtained in the Ulmfit architecture is 72.93% and the accuracy value obtained in the Gpt architecture is 68.19% [5].
Wani et al. stated that the effect of platforms such as Facebook, Instagram, and Twitter on the rapid dissemination of information is very high. However, it has been stated that the number of fake news has increased due to the widespread use of these platforms. The COVID-19 pandemic has brought with it much fake news. Researchers have used CNN, LSTM, and BERT structures to detect this fake news. The accuracy value of the proposed model in detecting COVID-19 fake news is 98.41% [6].
Paka and his friends stated that besides the rapid spread of the epidemic, fake news spread faster than the truth. Researchers have achieved an F1 value of 98% in the model they developed for fake COVID-19 news detection [7].
Heidari et al. used BERT and transfer learning models for fake news detection in their study. Researchers have stated that fake news can be made from bot accounts and that this news can prevent real news. The average accuracy value obtained in the study was 86.76% [8].
Das et al. stated that social media platforms are used more widely with the epidemic. The researchers stated that they obtained an accuracy value of 98.33% in the model they proposed to detect fake news [9].
Patvasi et al. stated that a large number of fake news are circulating on the Internet and that this fake news causes significant harm. Researchers used 4 different machine learning methods in their study. Among the models used in the study, it was seen that the highest F1 score was obtained in SVM with 93.32% [10].
Madani et al. stated that they used natural language processing, machine learning, and deep learning methods to detect fake COVID-19 news. The accuracy value obtained in the study was 79% in the Random Forest method [11].
Elhadad et al. stated that they obtained data from different sources for COVID-19 fake news detection and they used different machine learning methods to classify this data. The researchers stated that they used the 5-fold cross-validation technique to check the validity of the data collected in the study. In the study, the TF-IDF method was used for word representation [12].
Abdelminaam et al. stated in their study that fake news about the COVID-19 epidemic affected people's lives and disrupted the peace of society. In this study, it is emphasized that the detection of fake news by computer-aided systems is of great importance. 6 different machine learning techniques were used in the study, and the TF-IDF method was preferred for word representation. It is seen that the highest accuracy value among the 6 classifiers was obtained in the SVM classifier with 96.64% [13].
Ayoub et al. stated that they proposed DistillBERT and SHAP-based models for the detection of fake COVID-19 news. The researchers created a data set consisting of 984 data. The accuracy value obtained in the study was 97.2%. The researchers stated that the model they proposed gave good results and would increase people's trust in news sources [14].
Contributions and innovations of the study are listed as items.
• In this study, it is aimed to detect fake news about COVID-19.
• The preprocessing step is of great importance to increase the performance of the models when inferring from text data. Therefore, text preprocessing was done first.
• In the study, the glove method was used to create the document matrices.
• A hybrid model based on LSTM-CNN is proposed in the study.
• The proposed hybrid model produced more successful results than similar studies in the literature.
• It is clear that the proposed LSTM-CNN based hybrid model can be used in COVID-19 fake news detection as well as in other classification problems.
In the first part of the study, general information and similar studies in the literature were examined. In the second part, the proposed model, the methods used, and the data set are discussed. In the third part, the application, and in the last part, the conclusion part is detailed.
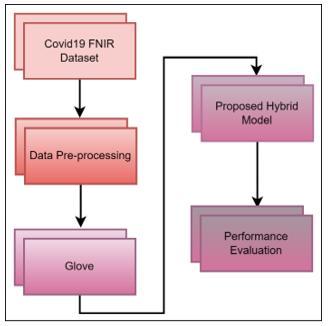
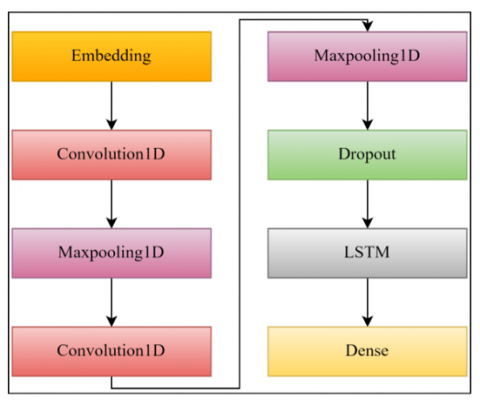
In this study, which was carried out using the COVID-19 news dataset, fake news was detected. In the literature, studies using machine learning methods are in the majority. In this study, an LSTM-CNN based model was used. In the proposed hybrid model, 80% of the data in the data set was used for training the proposed hybrid model. 20% of the data randomly allocated in the dataset was evaluated during the testing process of the hybrid model. In addition, the matrices obtained after the data cleaning and glove process were classified using different machine learning methods. In addition, the performance of machine learning methods on the COVID-19 dataset was tested in the study. A rough flow diagram of the LSTM-CNN based model and other machine learning methods is given in Figure 1.
Figure 1. Block diagram of the model
2.1 Dataset and preprocessing
The COVID19-FNIR dataset used in the study was created by Saenz et al. [15]. The created dataset includes news about the COVID-19 pandemic. Researchers' data were collected from regions of India, the United States, and Europe. There are 3795 fake and 3793 true news in the dataset.
8 rows related to the data in the dataset are given in Table 1. These samples were randomly selected from the dataset.
Table 1. Text examples
|
Index |
Text |
Label |
|
1 |
Tencent revealed the real number of deaths. |
Fake |
|
2 |
Taking chlorine dioxide helps fight coronavirus. |
Fake |
|
3 |
This video shows workmen uncovering a bat-infested roof in the US state of Florida in 2011. |
Fake |
|
4 |
The Asterix comic books and The Simpsons predicted the coronavirus outbreak. |
Fake |
|
5 |
UK imposes lockdown on city of Leicester to curb COVID-19 outbreak |
True |
|
6 |
Global COVID-19 prevention trial of hydroxychloroquine to resume |
True |
|
7 |
Grace Fusco, the matriarch of a large New Jersey family, died in March from COVID-19 without knowing that her 2 oldest children died before her. The coronavirus ultimately killed 5 members of the Fusco family, and infected at least 19 others. |
True |
|
8 |
Britain locks down city of Leicester after COVID-19 flare-up |
True |
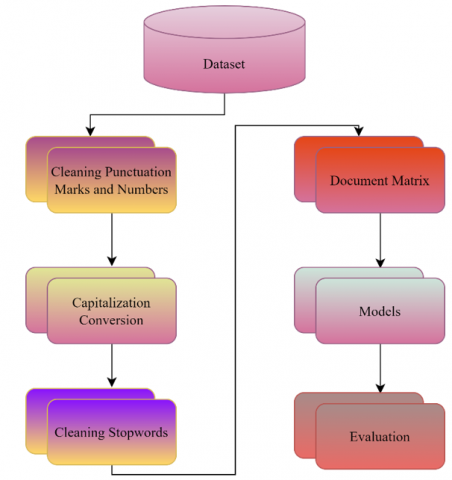
In the study, first of all, the data in the data set was carried out from the preprocessing step. In this step, numbers, punctuation marks, Stopwords words, etc. steps have been carried out. The text preprocessing steps are shown in Figure 2.
Figure 2. Preprocessing steps
Artificial intelligence-based methods do not directly operate on the text. First of all, it is of great importance to prepare the data in the data set in a format that the machine can understand. Various preprocessing steps can be applied to the data before the data in the dataset is converted into a machine-understandable format. These preprocessing steps have a great impact on the performance of the models. In the study, punctuation marks and numbers in the dataset were cleaned first. Then, case transformations were applied to the data in the data set so that the models did not perceive the words containing upper and lower case letters as different words. Also, the datasets are cleared of too many repetitive stop-words (the, is, on, etc.). Since the performance at this stage can directly affect the performance of the models, this stage is of great importance in text processing studies.
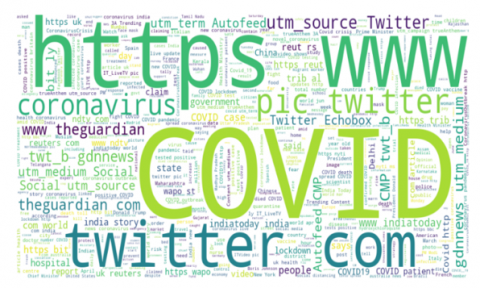
Also, the word cloud method was used for word representation. The word cloud representation of the 500 most repeated words in the raw data set is given in Figure 3.
Figure 3. A word cloud representation of 500 words in the unprocessed dataset
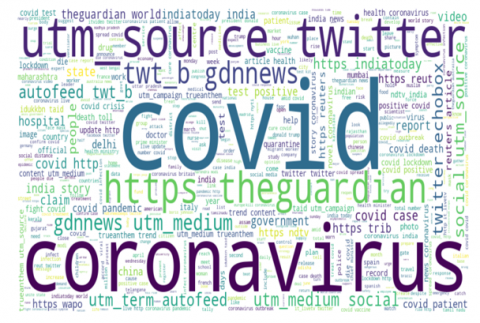
The word cloud representation of the 500 most repetitive words of the preprocessed data set is given in Figure 4.
Figure 4. Word cloud representation of the 500 words in the processed dataset
2.2 CNN architectures, layers and LSTM networks
CNN networks are frequently used in studies such as signal processing, natural language processing, emotion recognition, segmentation, classification, and object recognition due to their high performance in computer vision. CNN architectures are one of the most used architectures recently. One of the biggest reasons why CNN architectures have been used very frequently in recent times is that the manually extracted feature extraction process is done automatically in CNN networks in classical methods. Since feature extraction in CNN networks is done automatically, there is no need for expert knowledge in these architectures [16]. Unlike classical methods, CNN architectures do the training process directly on the model. In addition, there is no need for a preprocessing step in CNN architectures.
Certain layers are used when creating CNN networks. These layers used in CNN networks work in a forward direction. There is no standard for the number and order of layers in the creation of CNN networks. The most commonly used layers in CNN networks are convolution, pooling, dropout, flatten and dense layers. In addition, activation functions are frequently used in CNN networks.
Convolution layer is the most basic layer of CNN architectures. In this layer, feature maps are obtained from the data by applying filters to the data. Since these filters are applied to the data from the beginning to the end of the input, feature maps are obtained from the data. With the filters applied to the input data, the depth of the meshes is increased and therefore it is aimed that the meshes give more accurate results. The output size obtained after the convolution process is calculated by Eq. (1) [17].
$O=\frac{(i-k)+2 p}{s}+1$ (1)
In Eq. (1), O stands for output size, i is input size, k is filter size, s is the number of steps, and p is padding.
The convolution operation is calculated by Eq. (2).
$O(i, j)=(D * K)(i, j)=\sum_{m} \sum_{n} D(m, n) K(i-m, j-n)$ (2)
In Eq. (2), O represents the output after the convolution operation, the K kernel (kernel), the D input data, and the "*" symbol represents the convolution operation.
The pooling layer, on the other hand, is used in CNN networks to reduce the size of the feature maps obtained in the convolution layers and to reduce the diversity. With the pooling layer, computational costs and the input size of the next layer are reduced. The main purpose of this layer is to get better feature maps [18]. The size of the feature map obtained after the pooling layer is calculated by Eqns. (3)-(5).
$G_{2}=\frac{G_{1}-F}{S}+1$ (3)
$Y_{2}=\frac{Y_{1}-F}{S}+1$ (4)
$D_{2}=D_{1}$ (5)
G2 is the width of the new data size, G1 is the width of the input image, Y2 is the height of the new data size, Y1 is the height of the input image, D2 is the depth of the new image, D1is the depth of the input image, F Filter size, and S is the number of steps.
In the literature, maximum pooling and average pooling are mostly preferred for the pooling process.
The dropout layer is used to minimize the memorization situation in the networks. This memorization situation that occurs during the training of the networks is also called overfitting. With the dropout layer, it is aimed that some neurons have less information about each other. Thanks to the dropout layer, neurons are less affected by each other's weight changes [19].
The flatten layer, on the other hand, depends on all areas of the previous layer. The Flatten layer takes the feature maps as input and makes this feature maps suitable for the classification process. Multidimensional feature maps are converted to a one-dimensional matrix in this layer [20].
The backpropagation algorithm is used to learn historical data in RNN networks. However, when backward calculations are made in RNN networks, vanishing gradient and exploding gradient problems may arise. Also, in RNN architectures, the next string is difficult to predict due to context gaps between strings. Hochhreiter and Schmidhuber developed LSTM networks to eliminate the disadvantages of RNN networks in their work. The most important difference that distinguishes LSTM networks from RNN networks is that LSTM networks have cells that hold previous state and input information. Thanks to these cells in LSTM networks, it is determined which data will be kept and which data will be deleted [21, 22].
In this study, a hybrid model is proposed by using CNN and LSTM networks together.
2.3 Shallow models and glove technique
The amount of data kept in databases has been increasing rapidly in recent years. The processing of this data held in datasets is of great importance. Unprocessed raw data has no value. The processing of data in datasets is very important for both the public and private sectors. institutions or companies can make inferences from these data and make plans according to the results they have obtained. Processing and analyzing the raw data held in data sets is quite difficult with traditional methods. Therefore, with the development of technology, artificial intelligence-based models are used more. Shallow models are frequently used in the processing and analysis of raw data held in datasets. These models are accepted in the literature and used in many studies.
In this study, 7 different Shallow models were used to detect fake news. Shallow models are designed in 2 stages. The first stage is the stage where the models are trained, and the second stage is the stage where these models are tested. 80% of the data in the data set was used to train the Shallow models. The models were also tested with the remaining 20% dataset in the dataset. The performance metrics obtained in these models were compared with each other and with the proposed CNN-LSTM based model.
The first of the models used in the study is k-nearest neighbors (KNN). KNN is a method that aims to predict the class based on the information in which class the nearest neighbors of the vector formed by the independent variables of the value to be estimated are in. is a method [23].
The Random Forest method, on the other hand, is based on tree structures. It is frequently used in both classification and regression problems [24].
In the Gradient Boosting (GB) and Adaboost methods, inferences are made from the collection of trees obtained as a result of giving different weights to the data set. Initially, all observation values are the same. As the tree community begins to grow, the weights are rearranged. The weight of misclassified observations is often increased. Because of this, trees gain the ability to self-regulate [25, 26].
The logistic Regression method is frequently used in classification and regression problems. This model is frequently used in the classification of categorical and numerical data [27].
Another model used in the study is the Discriminant Analysis model. In this method, in order to distinguish the classes from each other, the distribution of the classes is examined and the difference between their mean values is used [28].
A CNN-LSTM based model is proposed in the study for fake news detection. Different Shallow models were used in order to compare the performance values obtained in the proposed model. These models can be widely used in many fields such as image processing, audio processing, signal processing, text processing.
Text processing applications, the next step after the data preprocessing step is the word representation step. How to represent the text is one of the critical steps in text processing studies. Since the texts are not directly understood by the machines, in this step the texts are converted into numerical expressions that the machines can understand. Therefore, word representation methods are used to convert the text into numerical expressions. There are different word representation methods used in the literature. In this study, the glove method was used for word representation.
The working logic of unsupervised algorithms is to use the statistical information of the data. However, despite using this statistical information in matrix decomposition methods, semantic relationships cannot be captured. There is no semantic step in the logic of such models. The glove method is a method developed to eliminate these disadvantages. The Glove method, developed by Pennington et al., is a word representation method that takes its name from the initials of the words "Global Vectors for Word Representation". The glove is a word representation method that is trained on global word counts, thus allowing statistics to be used more effectively [29].
2.4 Developed CNN-LSTM based hybrid model
The COVID-19 epidemic has had a great impact on people since 2019. In this process, besides the health of people, their psychology has also deteriorated. The effect of fake news spread on social media on the deterioration of people's psychology is quite high. The widespread use of online social media platforms increases the number of fake news. It is very important that this news can be detected using computer-aided systems. At study, it is aimed to detect COVID-19 fake news. In the study, a hybrid model based on CNN-LSTM was developed. In addition, the performance values of different machine learning methods were measured and compared with the proposed model. The proposed model is detailed in Figure 5.
Figure 5. CNN-LSTM based hybrid model
In the hybrid model developed to detect fake COVID-19 news, 1 Embedding, 2 Convolution, 2 Pooling, one Dropout, and LSTM layers were used. RELU is preferred as the activation function. Parameter values in the proposed model are presented in Table 2.
Table 2. Parameters of the CNN-LSTM based hybrid model
|
Layers |
Output-Shape |
Activation |
Param# |
|
Embedding |
(None,150,300) |
|
3999300 |
|
Conv_1d |
(None,149,128) |
Relu |
76928 |
|
Maxpooling1d |
(None,37,128) |
- |
0 |
|
Conv_1d |
(None,36,256) |
Relu |
65792 |
|
Maxpooling1d |
(None,9,256) |
- |
0 |
|
Dropout |
(None,9,256) |
- |
0 |
|
LSTM |
(None,64) |
- |
82176 |
|
Dense |
(None,2) |
- |
130 |
Python environment was used to detect COVID-19 fake news. The application results were taken on a computer with 16 GB RAM, 8 GB graphics card, and Windows operating system.
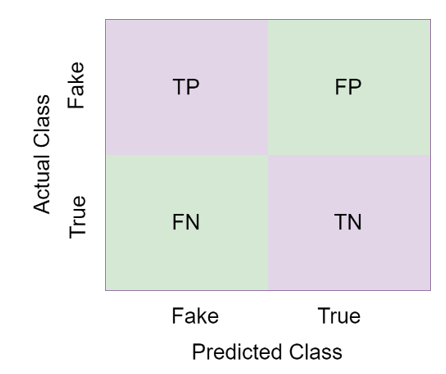
Different performance measurement metrics are available in AI-based models. Most of the performance measurement metrics are calculated using the confusion matrix [30]. An example of a confusion matrix is given in Figure 6.
Figure 6. Confusion matrix
The performance measurement metrics given in Table 3 were used to measure the performance of the models used [31].
Table 3. Performance metrics
|
Accuracy |
Acc=(TP+TN)/Total |
FPR |
FPR=FP/ (FP+TN) |
|
Sensitivity |
Se= TP/(TP+FN) |
FDR |
FDR =FP/(FP+TP) |
|
Specificity |
Sp=TN/(FP+TN) |
FNR |
FNR=FN/(FN+TP) |
|
Precision |
Pr=TP/(TP+FP) |
F1 |
F1=2TP/(2TP+FP+FN) |
In this part of the study, the accuracy values obtained in 7 different classifiers and the proposed CNN-LSTM based hybrid model are given in Table 4.
Table 4. Accuracy rate of models
|
Model |
Acc (%) |
Model |
Acc(%) |
|
KNN |
87.87 |
Logistic Regression |
84.60 |
|
Naive Bayes |
78.86 |
Discriminant Analysis |
70.63 |
|
Random Forest |
94.72 |
XgBoost |
94.62 |
|
Gradient Boosting |
94.83 |
Proposed Model |
99.42 |
The confusion matrix obtained in the KNN classifier is given in Figure 7.
Figure 7. Confusion matrix of KNN
The KNN classifier predicted 1667 of the 1886 test images correctly and 230 of them incorrectly. The accuracy rate of the KNN classifier in detecting fake news was 87.87%. The confusion matrix obtained in the Naïve Bayes classifier is given in Figure 8.
Figure 8. Confusion matrix of Naïve Bayes
The Naïve Bayes classifier predicted 1496 of the 1886 test images correctly and 401 of them incorrectly. The accuracy rate of the Naïve Bayes classifier in detecting fake news was 78.86%. The confusion matrix obtained in the Random Forest classifier is given in Figure 9.
Figure 9. Confusion matrix of Random Forest
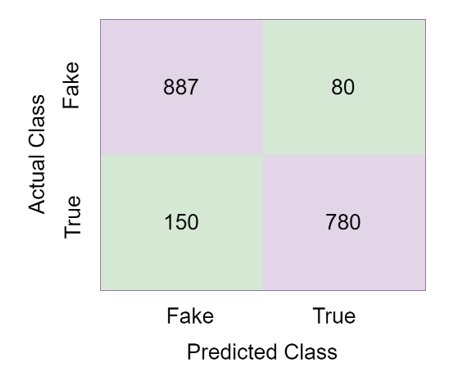
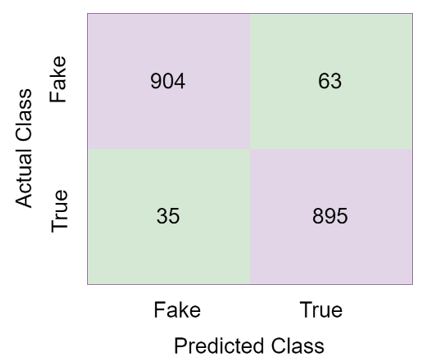
The Random Forest classifier predicted 1716 of the 1886 test images correctly and 100 of them incorrectly. The accuracy rate of the Random Forest classifier in detecting fake news was 94.72%. The confusion matrix obtained in the Gradient Boosting classifier is given in Figure 10.
When the Figure 10 examined, the Gradient Boosting classifier predicted 1799 of the 1886 test images correctly and 98 of them incorrectly. The accuracy rate of the Gradient Boosting classifier in detecting fake news was 94.83%. The confusion matrix obtained in the Logistic Regression classifier is given in Figure 11.
Figure 10. Confusion matrix of Gradient Boosting
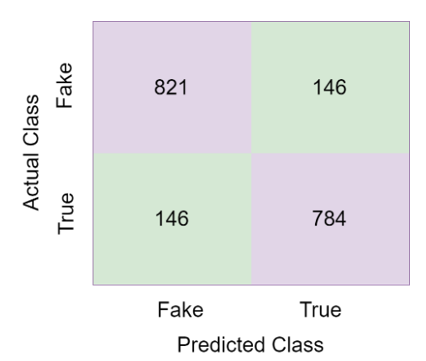
Figure 11. Confusion matrix of logistic regression
The Logistic Regression classifier predicted 1605 of the 1886 test images correctly and 292 of them incorrectly. The accuracy rate of the Logistic Regression classifier in detecting fake news was 84.60%. The confusion matrix obtained in the Discriminant Analysis classifier is given in Figure 12.
Figure 12. Confusion matrix of discriminant analysis
When the Figure 10 examined, the Discriminant Analysis classifier predicted 1340 of the 1886 test images correctly and 557 of them incorrectly. The accuracy rate of the Discriminant Analysis classifier in detecting fake news was 70.63%. The confusion matrix obtained in the XgBoost classifier is given in Figure 13.
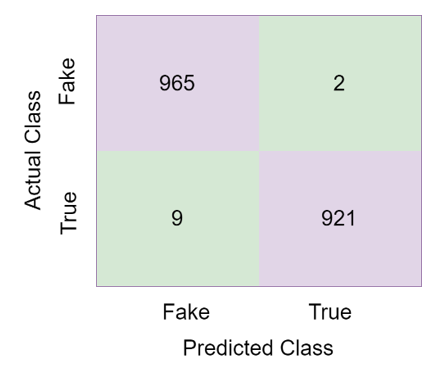
The XgBoost classifier predicted 1795 of the 1886 test images correctly and 102 of them incorrectly. The accuracy rate of the XgBoost classifier in detecting fake news was 94.62%. The confusion matrix obtained in the proposed model is given in Figure 14.
Figure 13. Confusion matrix of XgBoost
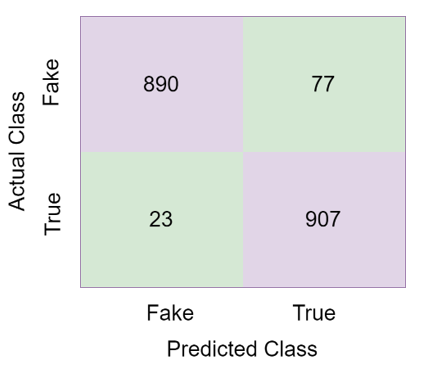
Figure 14. Confusion matrix of CNN-LSTM based model
When Figure 14 is examined, it is seen that the proposed hybrid model correctly classifies 1886 out of 1897 test images. The accuracy rate of the CNN-LSTM based hybrid model in detecting fake news was 99.42%. The performance metrics obtained in the proposed model are given in Table 4.
Table 5. Performance values of CNN- LSTM based models (%)
|
Acc |
99.42 |
FPR |
0.22 |
|
Se. |
99.08 |
FDR |
0.21 |
|
Sp. |
99.78 |
FNR |
0.92 |
|
Pr. |
99.79 |
F1 |
99.43 |
When Table 5 is examined, it is clear that successful results were obtained in the proposed CNN-LSTM based model. When the results obtained from the 7 different Shallow models used in the study and the CNN-LSTM-based model developed are examined, it is seen that the proposed model reaches the highest accuracy value.
The COVID-19 epidemic has been affecting all over the world since 2019. This epidemic affects both people's health and psychology. Especially in recent years, with the widespread use of social media platforms by users, the number of fake news made on these platforms is increasing day by day. It is very important to detect fake news made on the Internet using computer aided systems. Although machine learning methods are frequently used in text processing problems, CNN and LSTM structures have been used in recent years. In this study, a CNN-LSTM based hybrid model is proposed for the detection of fake COVID-19 news. When the performance metrics obtained in the proposed model are examined, the values obtained show that the proposed model can be used in fake news detection and text classification problems.
I am grateful to the dataset owners for sharing the data.
[1] Chakraborty, I., Maity, P. (2020). COVID-19 outbreak: Migration, effects on society, global environment and prevention. Science of the Total Environment, 728: 138882. https://doi.org/10.1016/j.scitotenv.2020.138882
[2] Koh, J.X., Liew, T.M. (2020). How loneliness is talked about in social media during COVID-19 pandemic: Text mining of 4,492 Twitter feeds. Journal of Psychiatric Research, 145: 317-324. https://doi.org/10.1016/j.jpsychires.2020.11.015
[3] Dabbous, A., Aoun Barakat, K., de Quero Navarro, B. (2021). Fake news detection and social media trust: A cross-cultural perspective. Behaviour & Information Technology, 1-20. https://doi.org/10.1080/0144929X.2021.1963475
[4] Al-Ahmad, B., Al-Zoubi, A.M., Abu Khurma, R., Aljarah, I. (2021). An evolutionary fake news detection method for COVID-19 pandemic information. Symmetry, 13(6): 1091. https://doi.org/10.3390/sym13061091
[5] Mookdarsanit, P., Mookdarsanit, L. (2021). The COVID-19 fake news detection in Thai social texts. Bulletin of Electrical Engineering and Informatics, 10(2): 988-998. https://doi.org/10.11591/eei.v10i2.2745
[6] Wani, A., Joshi, I., Khandve, S., Wagh, V., Joshi, R. (2021). Evaluating deep learning approaches for Covid 19 fake news detection. International Workshop on Combating Online Hostile Posts in Regional Languages during Emergency Situation, Springer, pp. 153-163. https://doi.org/10.1007/978-3-030-73696-5_15
[7] Paka, W.S., Bansal, R., Kaushik, A., Sengupta, S., Chakraborty, T. (2021). Cross-SEAN: A cross-stitch semi-supervised neural attention model for COVID-19 fake news detection, Applied Soft Computing, 107: 107393. https://doi.org/10.1016/j.asoc.2021.107393
[8] Heidari, M., Zad, S., Hajibabaee, P., Malekzadeh, M., HekmatiAthar, S., Uzuner, O., Jones, J.H. (2021). Bert model for fake news detection based on social bot activities in the COVID-19 pandemic. 2021 IEEE 12th Annual Ubiquitous Computing, Electronics & Mobile Communication Conference (UEMCON), pp. 0103-0109. https://doi.org/10.1109/UEMCON53757.2021.9666618
[9] Das, S.D., Basak, A., Dutta, S. (2021). A heuristic-driven ensemble framework for COVID-19 fake news detection. International Workshop on Combating On line Hostile Posts in Regional Languages during Emergency Situation, Springer, pp. 164-176. https://doi.org/10.1007/978-3-030-73696-5_16
[10] Patwa, P., Sharma, S., Pykl, S., Guptha, V., Kumari, G., Akhtar, M.S., Ekbal, A., Das, A., Chakraborty, T. (2021). Fighting an infodemic: COVID-19 fake news dataset. International Workshop on Combating On line Hostile Posts in Regional Languages during Emergency Situation, Springer, pp. 21-29. https://doi.org/10.1007/978-3-030-73696-5_3
[11] Madani, Y., Erritali, M., Bouikhalene, B. (2021). Using artificial intelligence techniques for detecting COVID-19 epidemic fake news in Moroccan tweets. Results in Physics, 25: 104266. https://doi.org/10.1016/j.rinp.2021.104266
[12] Elhadad, M.K., Li, K.F., Gebali, F. (2020). Detecting misleading information on COVID-19. IEEE Access, 8: 165201-165215. https://doi.org/10.1109/ACCESS.2020.3022867
[13] Abdelminaam, D.S., Ismail, F.H., Taha, M., Taha, A., Houssein, E.H., Nabil, A. (2021). CoAID-DEEP: An optimized intelligent framework for automated detecting COVID-19 misleading information on Twitter. IEEE Access, 9: 27840-27867. https://doi.org/10.1109/ACCESS.2021.3058066
[14] Ayoub, J., Yang, X.J., Zhou, F. (2021). Combat COVID-19 infodemic using explainable natural language processing models. Information Processing & Management, 58(4): 102569. https://doi.org/10.1016/j.ipm.2021.102569
[15] Saenz, J.A., Gopal, S.R.K., Shukla, D. (2021). COVID-19 fake news infodemic research dataset (COVID 19-FNIR Dataset). IEEE Dataport. https://dx.doi.org/10.21227/b5bt-5244
[16] Eroğlu, Y., Yildirim, M., Çinar, A. (2021). Convolutional Neural Networks based classification of breast ultrasonography images by hybrid method with respect to benign, malignant, and normal using mRMR. Computers in Biology and Medicine, 133: 104407. https://doi.org/10.1016/j.compbiomed.2021.104407
[17] Çinar, A., Yildirim, M. (2020). Detection of tumors on brain MRI images using the hybrid convolutional neural network architecture. Medical Hypotheses, 139: 109684. https://doi.org/10.1016/j.mehy.2020.109684
[18] Çınar, A., Yıldırım, M., Eroğlu, Y. (2021). Classification of pneumonia cell images using improved ResNet50 model. Traitement du Signal, 38(1): 165-173. https://doi.org/10.18280/ts.380117
[19] Yang, F., Zhang, H., Tao, S. (2021). Simplified multilayer graph convolutional networks with dropout. Applied Intelligence, 52: 4776-4791. https://doi.org/10.1007/s10489-021-02617-7
[20] Lee, S., Kim, H., Lieu, Q.X., Lee, J. (2020). CNN-based image recognition for topology optimization. Knowledge-Based Systems, 198: 105887. https://doi.org/10.1016/j.knosys.2020.105887
[21] Hochreiter, S., Schmidhuber, J. (1997). Long short-term memory. Neural Computation, 9(8): 1735-1780. https://doi.org/10.1162/neco.1997.9.8.1735
[22] Bengio, Y. (2009). Learning Deep Architectures for AI. Now Publishers Inc2009. http://dx.doi.org/10.1561/2200000006
[23] Rabin, N., Kahlon, M., Malayev, S., Ratnovsky, A. (2020). Classification of human hand movements based on EMG signals using nonlinear dimensionality reduction and data fusion techniques. Expert Systems with Applications, 149: 113281. https://doi.org/10.1016/j.eswa.2020.113281
[24] Saleh, M.A., Rass, A. (2020). Evaluation of supervised machine learning classifiers for detecting ransomware based on naïve bayes, SVM, KNN, C 4.5, and random forest algorithms. Int J Innov Sci Res Technol.
[25] Friedman, J.H. (2002). Stochastic gradient boosting. Computational Statistics & Data Analysis, 38(4): 367-378. https://doi.org/10.1016/S0167-9473(01)00065-2
[26] Rätsch, G., Onoda, T., Müller, K.R. (2001). Soft margins for AdaBoost. Machine Learning, 42: 287-320. https://doi.org/10.1023/A:1007618119488
[27] Kleinbaum, D.G., Klein, M. (2002). Analysis of matched data using logistic regression. Logistic Regression: A Self-Learning Text, 227-265. https://doi.org/10.1007/978-1-4757-4108-7
[28] Huberty, C.J. (1975). Discriminant analysis. Review of Educational Research, 45(4): 543-598. https://doi.org/10.3102/00346543045004543
[29] Pennington, J., Socher, R., Manning, C.D. (2014). Glove: Global vectors for word representation, Proceedings of the 2014 Conference on Empirical Methods in Natural Language Processing (EMNLP), pp. 1532-1543.
[30] Eroğlu, O., Yildirim, M. (2021). Automatic detection of eardrum otoendoscopic images in patients with otitis media using hybrid‐based deep models. International Journal of Imaging Systems and Technology, 32(3): 717-727. https://doi.org/10.1002/ima.22683
[31] Eroglu, Y., Yildirim, K., Çinar, A., Yildirim, M. (2021). Diagnosis and grading of vesicoureteral reflux on voiding cystourethrography images in children using a deep hybrid model. Computer Methods and Programs in Biomedicine, 210: 106369. https://doi.org/10.1016/j.cmpb.2021.106369