Yue Su | Xin Yang | Qiaolin Tang | Lina Hao | Wunian Yang*
OPEN ACCESS
Narsaq in Greenland, located in the Central Domain of the Ketilidian orogen and covered with snow and ice all year round has few geological works. In order to make geological survey better in this area, and to provide basic data for overseas mineral resources and potential evaluation, Landsat8 remote sensing data was used in this paper to establish remote sensing interpretation marks of various geological elements based on the full collection of existing geological data. Then the extraction of geological elements such as sedimentary rocks, magmatic rocks, metamorphic rocks, vein rocks and linear structures in the area was finished. Finally, the lithologic interpretation maps and structural interpretation maps of the study area were compiled. The results have shown that the false color image of Landsat8 data generated by multi-band combination can highlight the lithology-structural features of the study area and can meet the needs of mapping 1:100,000 scale remote sensing geological interpretation.
Greenland, interpretation mark, Landsat8, lithology, structure
The development of remote sensing has considerably broadened human being’s horizon and enhanced the visual capabilities. With its macroscopic, comprehensive, multi-scale, and multi-level characteristics, it has become an indispensable tool for geological research and geological exploration [1]. The studies conducted by means of remote sensing are related to tectonic, fault, geological disasters, magmatic rocks, and metamorphic rocks, etc., especially in large-scale geological surveys. Remote sensing has significantly improved the efficiency of field work and the accuracy of exploration and research. Traditional field geological work, due to the limitation of its observation horizon, has certain difficulties in understanding the geological bodies, which cannot objectively, truly and comprehensively reflect the relevant characteristics of regional geological bodies [2]. In recent years, therefore, remote sensing geological structure interpretation technology has become more and more crucial in regional geological surveys, especially in areas such as Greenland, where the regional geological surveys conducted by remote sensing are extremely essential due to its cold weather and inaccessible geographical location.
The results of previous geological and remote sensing study have shown that the study in the study area is still large-scale interpretation at a small scale, which is relatively incomplete, because no targeted remote sensing interpretation work has been performed, based on previous studies, Landsat8 data was used in this paper to perform lithological-structural interpretation of Greenland [3, 4] to provide important reference for regional geological survey mapping.
2.1 Study area
Greenland, located in North America, is a large island between the Arctic Ocean and the Atlantic Ocean. About 80% of the area is within the Arctic Circle and 81% of the area is covered by snow and ice. The area of bare rocks is 410,500 km2. Due to the Atlantic warm current, basically, Southwest coast of Greenland is not frozen in winter. The most significant geomorphological feature of Greenland is the vast thick ice sheet, which is second only to Antarctica in size and accounts for approximately 83.7% total area of Greenland. The study area (60° 57′30.53″ N, 45° 56′51.45″ W) is located in the town of Narsaq in Gardar Province, southern Greenland. There are many bays in the Kovane Bay, and few onshore road systems.
2.2 Regional geological overview
The southern part of Greenland is controlled by the ancient Proterozoic Ketilidian orogen, which can be subdivided from north to south into Northern Domian, Central Domain, and Southern Domain. The exposed strata in the area are from old to new: rock formations in the ancient and ancient Cortilian period, and intrusive rocks in the middle-protozoic Gardar.[5] Regional rocks have undergone strong deformation and metamorphism to develop various planar, linear structures, and ductile shear zones [6]. There are large-scale northeast strike ductile shear zones in the area, such as the Niaqornaarsuk shear zone.
Figure 1. The location of the study area in Greenland
3.1 Data processing
Landsat8 used in this paper came from the U.S. Geological Survey (http://earthexplorer.usgs.gov/). The temperature in the study area is relatively high in summer and the Illumination is fine. The remote sensing image during this period is rich in spectral information and suitable for geological interpretation. Thus, one scene image of July 2018 (track number:001/017) with about 5% cloud cover was selected. The spatial resolution of data is 30m.
To ensure that the Landsat8 image data in the study area can truly reflect the spectral and spatial information of the lithological units, the data needs to be pre-processed in a standardized manner. such as radiation calibration and atmospheric correction. Each method of atmospheric correction has its own advantages and disadvantages, and there are also certain restrictions [7]. According to the characteristics of the study area, atmospheric correction on Landsat8 data was performed using the FLAASH model in ENVI5.1; By removing the remote sensing interference factors can exclude the influence of vegetation, shadow, moraine, geological disaster deposits, alluvial on lithology classification, improve the accuracy of lithology classification, and increase the reliability of the final method of lithology unit identification; Finally, geometric registration, mosaicking and enhancing are performed to ensure that different images can accurately reflect the spectral and spatial characteristics of the same rock unit.
3.2 Band selection
Landsat 8 image includes many bands with strong band correlation and high data redundancy. Selecting the appropriate band combination is the key to remote sensing study [8]. According to the characteristics of each band, the area application range and the actual characteristics of the research area, by calculating the optimal synthesis scheme index (OIF), three bands with a larger OIF index are selected for color synthesis. OIF refers to the ratio of sum of the standard deviation of any three bands to sum of the correlation coefficients. Generally, the larger the OIF index, the better the synthesis effect.
The OIF index of Landsat8 data in the study area showed that the OIF index of the 754 band combination is comparatively large. Therefore, the use of the 754 (RGB) color band combination is beneficial to the special geological structure survey. By comparison to the 754 color synthesis scheme, it was found that the use of the 765 synthesis scheme was beneficial to distinguish granite, sandstone, and orthoclase. As shown in Figure 2, the color synthesis method of 765 effectively utilized the short-wave infrared band and near-infrared band of Landsat8, which could greatly assist the identification of different rocks. Thence, 765 and 754 false color synthetic images were mainly used in study area for remote sensing rock interpretation.
Figure 2. Landsat8 false color composite image (R, G, B combination: 765)
Lithology and geological structure identification are the basis of remote sensing geological interpretation, and other geological interpretations are performed on the basis of both [9]. This article follows the principles of gradually transitioning from regional macro interpretation to local micro issue research, from intuitive geological information extraction to weak information extraction, and from qualitative geological information extraction to quantitative information extraction. First, Landsat8 multi-band data is used for enhancement processing such as ratio, stretching, and color transformation, or through combination of different bands to identify the spectral characteristics and texture characteristics of different rocks and determine the lithological boundary [10, 11]. Different objects have different spectral characteristics. The texture and spectral characteristics of different features can be extracted to recognize different ground features. So, rock spectral features can be used to carry out image classification and assist lithology recognition [12]. Interpretation of line loop structures is primary content of remote sensing geological research [13]. The image characteristics of fault structure traces differ in distinct scales, and they are mainly shown as certain wide and anomalous bands on the low and medium resolution images. The width varies from place to place, and sometimes it can be subdivided into other anomalous lines or tones.
4.1 Sedimentary rock
As for the spectral characteristics of sedimentary rock, the weathered surface of the rocks is the most critical one. In general, light-colored minerals and rocks with lighter weathered surfaces have higher reflectance and lighter tones; they are mainly composed of dark, variegated minerals with more trivalent iron cements. weathered rocks have lower reflectivity and darker tones. Figure 3, shows the Sedimentary rocks are presented as bands or stripes on remote sensing images.
Figure 3. Curved strip-shaped graphic features of sedimentary rock (R, G, B combination: 754)
4.2 Magmatic rocks
The spectral characteristics of ultrabasic, basic, neutral and acid magmatic rocks have obvious rules to follow. On the remote sensing images synthesized by different bands, the basic and acid magmatic rocks also show different colors.
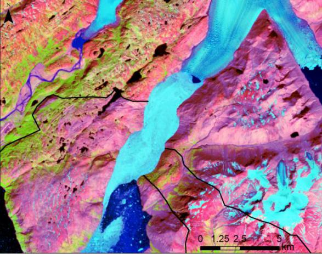
As shown in Figure 4, 754 combination of Landsat8 image was used for false color synthesis. The acid granite is reddish pink, and the basic orthoclase is purple dish red. Owing to the different silica content, these two types of rock show different shades in the 754 combination image, which is convenient for visual interpretation. Magmatic rocks are particularly obvious on remote sensing images. They are normally presented as ring structures of different shapes or radial water systems. The property of magmatic rocks can be understood by interpreting color tones. On the whole, acid intrusive bodies are light and basic intrusive bodies are dark.
Figure 4. Hue differences of different magmatic rocks (R, G, B combination: 754)
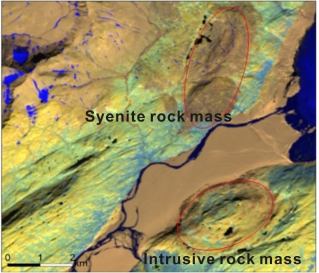
The rocks in the study area are mainly various types of extruded rocks and intrusive rocks in the Middle Proterozoic Gada period. The shape of the rock mass and the background rock strata of two kinds of rock are obviously different, and the spatial geometric distinction between them are prominent. They are often distributed in circles, ovals, and bars. As shown in Figure 5, there are an elliptic orthoclase rock mass and a circular intrusive rock mass.
Figure 5. Spatial geometric characteristics of the rock mass (R, G, B combination: 754)
4.3 Metamorphic rocks
In the main, the spectral and tone characteristics of positive metamorphic rocks are similar to those of magmatic rocks, and the spectral and tone characteristics of para-metamorphic rocks are close to those of sedimentary rocks and some volcanic rocks. It is the mineral composition that mainly determines the spectral characteristics of metamorphic rocks. The positive metamorphic rock has the dual image characteristics of magmatic rocks and metamorphic products.
4.4 Vein rock
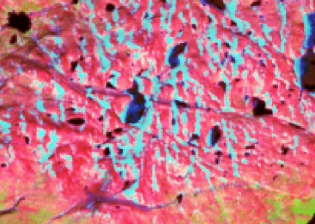
Vein rocks are generally well marked on images with high-quality exposed areas presented as slender strips (Figure 6). They often cut the shadow pattern of surrounding rocks, causing discontinuities or forming ridge-type landforms. On Figure 6, the two rock veins are in a continuous line shape. He color and texture of the rock veins are significantly different from the background image, and the shadow pattern of the surrounding image is cut by them.
Figure 6. Rock vein image features (R, G, B combination: 754)
4.5 Construction
4.5.1 fault structure
The fault structures in the study area are relatively developed, and the characteristics of the fault are obvious on the image. They are mainly composed of near-linear water systems, gullies, intermittent or continuous cliffs, Some faults constitute lithological boundaries and the image characteristics on their both sides are quite different.
The fault structures interpreted in this area are quite complicated, with a large number of amounts and long extension distances, and the directions of their extension are disorganized. The fault structures are mostly north-south faults, north-east-north-eas faults t, and north-west faults, of which the north-west faults are mostly cut through Northeast-Northeast eastward fault. Figure 7, shows the remote sensing faults in this area mainly include the following forms and several hidden or speculative faults.
Figure 7. Interpreted image features of the fracture structure
4.5.2 Ring structure
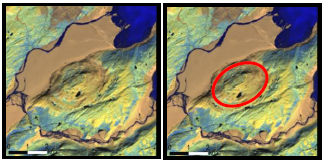
The ring structure is displayed on the remote sensing image by hue ring, landform ring, water system, vegetation ring, shadow ring, or compound type ring feature [14] As shown as the Figure 8, the ring structures in mountainous areas are often transformed into ring-shaped or arc-shaped ridges, valleys, near-circular mountain bodies or mountain basins. They might be represented by radial or concentric ring-shaped water systems. Some ring structures appear as a result of the characteristic shadow patterns and tones that can be distinguished from the background. Ring structure in plain areas usually have ring tone abnormality, which can be seen as blurry cyclic contour or halo. On top of that (in addition/additionally), hue in different parts of ring tones also varies. This abnormality is mostly resulted from differences in soil composition, moisture content, and vegetation development. Some ring structures in the plain areas are manifested by ring-shaped or arc-shaped residual mountains, small water bodies on the surface, and spot-like or plate-like shadow patterns with a circular combination. Large circular structures that extend from plains to mountains are usually clearer in the mountain section.
Figure 8. Interpreted image features of ring structure
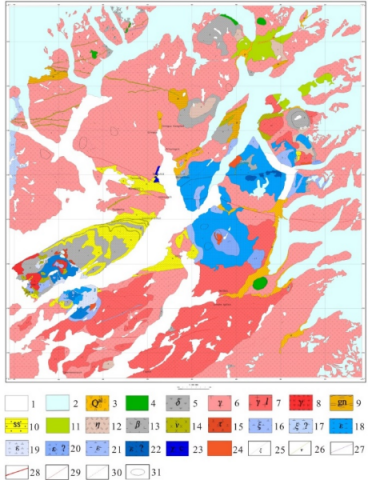
The false color synthetic images of Landsat8 band 754 and band 756 were used in this remote sensing geological structure interpretation. The above two images generated by FCC (False Color Composite) are with bright color, diverse layers and clear textural features which can highlight the structural characteristics of the study area. So they can basically meet the needs of 1: 100,000 structural interpretation. The interpretation results are shown in Figure 9.
1.Waters; 2.Glacier; 3.Alluvial; 4.Intrusive rock; 5.Diorite; 6.Granite; 7.Granite aplite; 8.Alkali granite; 9.Gneiss; 10.sandstone; 11.meta-acid volcanic rocks; 12.Pyroxene biotite monzonite;13.Basalt;14.Gabbro;15.Trachyte;16.Syenite;17.Syenite;
18.nepheline-syenite;19.nepheline-syenite; 20.Sodium hornblende isonepheline syenite; 21.Sodalite syenite; 22.Ferruginous nepheline syenite; 23.Carbonatite; 24.Unknown rock mass; 25.Syenite vein; 26.Gabbro vein; 27.Unknown vein; 28.Remote sensing interpretation of first-order faults; 29.Remote sensing interpretation of secondary faults; 30.inferred fault;31. Ring structure
(1) The Landsat8 remote sensing image is more optional when the scheme of FCC is chosen due to its varied bands with rich information. The characteristics of ground features in different combinations are significant. Using Landsat8 band 765 and band 754 images can highlight the geological characteristics of the study area. The disadvantage of them is that the spatial resolution is comparably low, so the detailed structural information is unclear. Results of recognition for large rocks using these two combinations, however, can be pretty good while further subdivision of rocks can be limited.
(2) By visual interpretation, the linear structure interpretation marks of the study area are summarized. Besides, structures are extracted and some small structures are interpreted, which enriches the geological contents of the study area.
(3) In line with comparative verification, the information such as the interpretation of geological boundaries and structures concluded by this paper is in good agreement with previous geological studies, providing a reference for further stratigraphic division of the study area and worthwhile information to greatly improve work efficiency.
(4) The surface of the study area is severely covered by moraine, geological disaster deposits, alluvial matter, etc., which has certain impact discovering stratum information by means of remote sensing technology.
The research is subsidized by the 22 kinds of important mineral resource saving and comprehensive utilization survey (DD20179132), Institute of Multipurpose Utilization of Mineral Resources, Chinese Academy of Geological Sciences.
[1] Wang, R.S., Xiong, S.Q., Nie, H.F. (2011). Remote sensing technology and its application in geological exploration. Acta Geologica Sinica, 85(11): 1699. http://doi.org/10.1007/s12583-011-0163-z
[2] Li, W. (2018). Remote sensing interpretation and application of sedimentary lithology ----A Case Study in Jimsar District of Xinjiang. Northwest University. https://doi.org/CNKI:CDMD:2.1018.104857
[3] Nie, F.J., Zhao, Y.Y., Li Z.Q., Liu, Y.F., Cao, Y., Ding, C.W. (2013). Geological characteristics and genesis of the Narunako gold deposit in southern Greenland. Acta Mineralogica Sinica, S2: 1054-1055. https://www.cnki.net/kcms/doi/10.16461/j.cnki.1000-4734.2013.s2.080.html
[4] Zhao, Y.Y., Lu, W., Nie, F.J., Li, Z.Q., Li, J.L. (2014). Greenland Geological Units and Metallogenic Types. Mineral Deposits, S1: 1147-1148. https://www.cnki.net/kcms/doi/10.16111/j.0258-7106.2014.s1.576.html
[5] Bell, R.M., Kolb, J., Waight, T.E., Bagas, L., Thomsen, T.B. (2016). A Palaeoproterozoicmulti-stage hydrothermal alteration system at Nalunaq gold deposit , South Greenland. Mineralium Deposita , 52(3): 383-404. https://doi.org/10.1007/s00126-016-0667-7
[6] Cong, Z. (2013). Metallogenesis , Metallogenic laws of the Nalunaq Gold Deposit, South Greenland. China University of Geosciences(Beijing).
[7] Zheng, W., Zeng, Z.Y. (2004). A review on methods of atmospheric correction for remote sensing images. Remote Sensing Information, (4): 66-70. https://doi.org/10.1023/B:APIN.0000033637.51909.04
[8] Zhang, Z., Luo, F., Zhang, Y.Y. (2018). Optimum Band Combination Selection of Tidal Flat Interpretation Based on OLI Image. Journal of Huaihai Institute of Technology (Natural Science Edition, 27(1): 81-87.
[9] Hu, G.B., Liu, F., Deng, W., Yang, K., Chen, Q.S. (2019). Application of remote sensing technology to geological mapping in the vegetation covered area of southwest Yunnan. Remote Sensing for Land & Resources.
[10] Yang J.Z., Sun, Y.G., Qin, X.W. (2013). High-resolution remote sensing geological survey. Beijing: Surveying and Mapping Press, 2013.
[11] Lihua, F., Wenhui, J., Benzan, W. (2014). Application of high resolution data in remote sensing geological survey. Hebei Remote Sense, 2014(3): 7-12.
[12] Liu, C., Wang, H.W. (2011). Study on remote sensing lithology recognition in high vegetation area. Acta Mineralogica Sinica, 31(S1): 966-967. https://www.cnki.net/kcms/doi/10.16461/j.cnki.1000-4734.2011.s1.433.html
[13] Shi, C., Li, S., Ren, Z.Q., Wang, X.P. (2016). The application of 3D remote sensing image to interpretation of geological structure:A case of vegetation covered Pinghe area, Fujian. Contributions to Geology & Mineral Resources Research, 36(1): 127-134. https://doi.org/10.6053/j.issn.1001-1412.2016.01.017
[14] Liu, X.X., Chen, J.P., Zeng, M., Dai, J.J., Pei, Y.R., Ren, M.Y., Wang, N. (2015). Geological structural interpretation of Qiangduo area in Tibet based on multi-source remote sensing data. Remote Sensing for Land & Resources, (3): 154-160. https://doi.org/10.6046/gtzyyg.2015.03.24