Thethati Narasimha Prasad Saibavani![]() | Narayan Parvathi*
| Narayan Parvathi*![]()
© 2023 IIETA. This article is published by IIETA and is licensed under the CC BY 4.0 license (http://creativecommons.org/licenses/by/4.0/).
OPEN ACCESS
Graph theory has grown in importance in applied mathematics as a result of its wide range of applications and utility. Geometry, algebra, number theory, topology, optimization, and computer science all employ graph theory to solve combinatorial issues. Both graph theory and applications rely on the concept of connectedness. Power domination is a generalization of the optimization method in which measuring devices in the specified field are put at precise spots in electronic and electrical power networks. In mathematics, graphs are used to define networks. The classic vertex cover problem and domination problem in graph theory are strongly related to monitoring an electric power system with as few phase measuring units (PMUs) as possible. If every vertex and every edge in the system are seen using the observation criteria of power system monitoring, a set S is a power dominant set (PDS) of a graph G. Thus, the concept of power domination in Strong and Complete graph is established using theorems and examples.
Power Domination Number (PDN), Complete Graph, Strong Graph
Euler was the first to introduce the concept of graph theory in 1736.A graph can be used to represent information about object relationships. Vertices, relations, and edges are used to represent the items. In recent years, there has been a surge in interest in Graph theory.
Because of its wide range of applications in domains including engineering, social science, and biology, graph theory has grown in prominence. A new idea in graph theory has been discovered by a group of mathematicians. Labeling, coloring, and dominance are novel concepts that are beneficial to all fields.
The difficulty of monitoring an electric power system with the fewest available measurement equipment is similar to the well-known domination problem in graphs. Considered this problem's graph theoretical representation as a version of the domination problem in 1998.
Yang et al. [1] produced some wheel-related graphs. Subbulakshmi and Valliammal [2], discuss the transformation of wheel graphs into stars. Chang and Liu [3] establish Cartesian Products of Some Regular Graphs. Akram et.al. [4, 5] established vague hyper graphs. Degree of vertices and regularity in vague graphs discussed Borzooei and Rashmanlou [6] and Borzooei et al. [7].
Chang et al. [8] produced power dominance graphs. Bounds on eigenvalues and chromatic numbers was introduced by Cao [9]. Dean [10] introduced power dominating sets of hypercubes, and Dorfling and Henning [11] discovered power domination in grid graphs Excellent domination in fuzzy graphs discusses Dharmalingam and Nithya [12]. Vague sets develop Gau and Buehrer [13], Yang and Zhang [14] established the independent domination number of the strong product of two cycles. Domination in the join of fuzzy incidence graphs developed Nazeer et al. [15]. In fuzzy graphs, Ismayil and Begum [16] have also displayed dominance.
Fuzzy Graph defines and classifies Karunambigai et.al [17]. The wheel-based cartesian product was investigated by Koh and Soh [18], Soh and Koh [19] and various wheel based Power Domination Number in this described idea of cyclic cartesian product by Liao and Lee [20] establish the power dominance of Sunlet graph and their ways of monitoring electrical power systems Saibavani and Parvathi [21, 22].
In Fuzzy graphs, Paired domination in fuzzy graphs was used to investigate by Manjusha and Sunitha [23, 24] Whitehead and Russel [25] established the cartesian product in graphs, and in two graphs, the cartesian product's dominance number and it's developed the problem in PMU, which Haynes et al. [26] described as a graph modelling problem.
Vague Graphs are defined by Rao et al. [27], the radius of graphs is discussed by Yu et al. [28]. The concept of approximation reasoning was created by Zadeh [29].
Electrical power companies must evaluate the status of their systems on a regular basis, as described by the characteristics. It is defined as the magnitude of voltage at loads and the device phase angle at generators. The most important part of the monitoring strategy is to maintain track of all edges and vertices using the process developed in the Phase Measurement Unit (PMU).
The task of finding the fewest number of PMUs to monitor the entire system is a graph theory problem similar to the well-known vertex covering and domination problems. As a result, this subject is of interest not just to the power system sector, but also to graph theory as a new challenge. For a more in-depth look at the problem of domination and associated subsets.
While dominance has been studied extensively, power dominance has only lately been introduced and examined, in particular, demonstrated that the power dominance problem is NP-complete even when constrained to bipartite or chordal graphs, and offered a linear algorithm for solving the PDS for trees.
The difficulty of finding the smallest collection of PMUs to monitor the entire network is analogous to the well-known vertex coverage and dominance problems in graph theory.
Let G = (V, E) be a graph representing an electric power system, with each vertex representing an electrical node (a substation bus that connects transmission lines, loads, and generators) and each edge representing a transmission line connecting two electrical nodes. The task of finding the fewest number of PMUs to monitor the entire system is a graph theory problem similar to the well-known vertex covering and domination problems. The state variable (voltage and phase angle) for the vertex at which it is situated, as well as its incident edges and end vertices, is measured by a PMU (these vertices and edges are said to be observed.)
Electric utilities must constantly monitor the condition of their systems, which is characterized by a set of state variables. Placing phase measuring units (PMUs) at strategic spots throughout the system is one way to keep track of these factors. Due to the high cost of a PMU, it is preferable to keep the number of PMUs to a minimum while yet being able to monitor (observe) the entire system. When all of the state variables of a system can be determined from a set of measurements, the system is said to be observed.
Definition 2.1
A graph G is a finite non empty set of objects called vertices together with a set of unordered pair of distinct vertices of G, called edges. The vertex set and the edge set of G are respectively denoted by V(G) and E(G). A graph G with vertex set and edge set is denoted by G = (V, E).
Definition 2.2
A Complete Graph is one in which any two different points are adjacent.
Definition 2.3
A graph $G=(V, E)$ is said to be strong if $E\left(v_{i i}, v_{j j}\right)<$ $\min \left(\left(v_{i i}\right),\left(v_{j j}\right)\right)$ for all $\left(v_{i i}, v_{j j}\right) \in V$.
Definition 2.4
If all the edges are strong edge in an G then it is called strengthened graph.
Definition 2.5
2-degree of v is defined as the sum of the degree of the vertices adjacent to v and it is denoted by t(v).
Definition 2.6
Average degree of v is defined as $\frac{t(v)}{d(v)}$ , where t(v).is the 2-degree of v and d(v) is the degree of $v$ and it is denoted by da(v).
Definition 2.7
A graph is called pseudo regular if every vertex of G has equal average degree.
Definition 3.1
Let G = (V, E) be a graph. A set S of vertices of G is a dominating set (DS) of G if each node of V(G)-S is adjacent to other node in S. A DS S of G is referred to as minimal DS in no proper subset of S is a DS.
Definition 3.2
A minimum DS in a graph $G$ is a DS of minimum cardinality. The cardinality of a minimum DS is called the domination number (DN) of G and is denoted by γ(G).
Definition 3.3
A set D of vertices of G is a strong DN of G if every vertex of V(G)-D is a strong neighbor of other vertex in D.
Definition 3.4
A minimum strong DS as a strong DS of minimum scalar cardinality. The scalar cardinality of a minimum strong DS is called the strong domination number of G.
Definition 3.5
A set S⊂V(G) is said to be a power domination set (PDS). If each vertex and each edge in G(V, E) observes by the vertices in PDS. The minimum cardinality of the PDS is called Power Domination Number $\gamma_P(G)$ .
Theorem 3.1
If G=(V, E) is a strengthened graph, then equal number of vertices of PDSs of G having equal value.
Proof:
Assume that G=(V, E) is a strengthened graph. Then every edge of G is strong edge. If possible, let (m11,m22) be an edge of G which is not strong edge. Then equal number of vertices PDSs of G having equal weight. But G is not a strengthened graph, which is a contradiction. Hence allPDSs of G having equal weight. We wanted to locate as many respiration cylinder companies as conceivable in order to save cash and time. Assume there are four distinct oxygen engine stores in a city that stockpile oxygen cylinders to health centers.
Example 3.1
Consider Figure 1 For the graph G=(V, E).
Figure 1. Strengthened graph
Theorem 3.2
Let G = (V, E) be a graph, and $\gamma_P(G)=0$ if c only includes one strong arc.
Proof:
Assume G=(V, E) as a graph. If c includes only one strong arc, then γP(G)=0. Conversely suppose that γP(G)=0. To prove that G contains only one strong arc. If possible, G contains more than one strong arc, then γP(G)≠0. which is a contradiction. Hence G contains only one strong arc.
Theorem 3.3
Let G = (V, E) be a graph and if G is Complete Graph then all PDSs of G have equal value.
Proof:
Assume that $G$ is Complete Graph. Then by the definition of Complete Graph, $\mu_2\left(m_{11}, m_{22}\right)=$ $\min \left(\mu_1\left(m_{11}\right), \mu_1\left(m_{22}\right)\right)$ for every $m_{11}, m_{22} \in V$. Suppose $G$ has at least one weak $\left(m_{11}, m_{22}\right)$ edge then, $\mu_2\left(m_{11}, m_{22}\right)<$ $\min \left(\mu_1\left(m_{11}\right), \mu_1\left(m_{22}\right)\right)$ and which implies that $\mu_2\left(m_{11}, m_{22}\right)<\min \left(\mu_1\left(m_{11}\right), \mu_1\left(m_{22}\right)\right) \quad, \quad$ for some $m_{11}, m_{22} \in V$. This contradicts our assumption that $G$ is Complete Graph. Hence all PDSs have equal value.
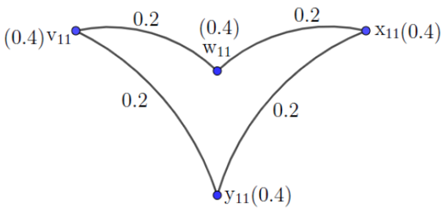
Example 3.2
Consider Figure 2 For the graph G=(V, E).
Figure 2. Graphs of PDS
Theorem 3.4
Let G be an graph and if G having at most two non strong arcs, then G contains PDS.
Proof:
Assume G to be a graph. If G having at most two non strong arcs, then G contains PDS.
Conversely, suppose that G contains PDS. To prove that G having at most two non strong arcs. If possible, G contains more than two non strong arcs, then G does not contain a PDS, which is a contradiction. Hence G having at most two non strong arcs.
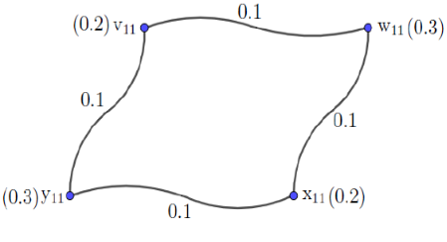
Example 3.3
Consider Figure 3 For the graph G = (V, E).
Figure 3. Graphs of PDN
Theorem 3.5
Let G be a graph with power dominate edges. If S is a minimal PDS, then V-S is a PDS.
Proof:
Let S be a minimal PDS of G. Assume V-S is not PDS. Then there exists a vertex to x $x \in S$ S such an extent that x is not power dominated by anyone vertex in V-S. Since G has power dominate edges, x is a power dominate of somewhere around one vertex in S-{x}. Then S-{x} is a PDS, which contradicts the minimality of S Subsequently, every vertex in S is a power dominate of no less than one vertex in V-S. Hence V-S is a PDS.
Example 3.4
Consider Figure 4 for the graph G=(V, E).
Figure 4. Graph of PDS
Theorem 3.6
A graph G=(V, E) as even cycle is both PRG and TPRG then G contains PDN.
Proof:
Let G=(V, E) be a PRG. Then its graph G as even cycle and G be both PRG and TPRG. Here are two cases that arise.
Case (i)
Let G be both PRG and TPRG with stable values in V and E. In G all arcs are strong and some PDSs of G having equal number of vertices. Then by the 2.5 definition G contains PDN.
Example 3.5
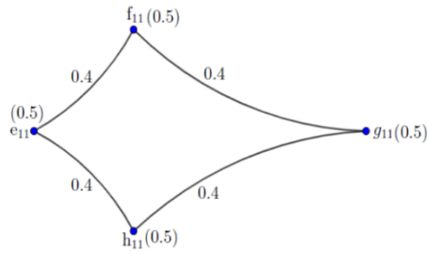
Let GPR be both PRG and TPRG with the vertices e11,f11,g11,h11 and edges (e11,f11),(e11,h11),(f11,g11),(g11,h11). Here all arcs are strong.
Case (ii)
Let G be both PRG and TPRG with stable values in V and with equal alternative values in E. In G all arcs are strong and some PDSs of G having equal number of vertices. Then by the 2.5 definition G contains PDN.
Example 3.6
In Figure 5, let G be both PRG and TPRG with the vertices e11,f11,g11,h11 and edges (e11,f11),(e11,h11),(f11,g11),(g11,h11). Here all arcs are strong.
Figure 5. PRG and TPRG with PDN
From Figure 4 and 5, Let G have n vertices and n edges. Since G is a connected graph, it has a spanning tree T with n vertices and n-1 edges. Let e be the edge not in T, with its endpoints u and v. There is a unique path γ between u and v in T (since T is a tree). The union of e and γ is a cycle. Suppose that there is some other cycle δ. If δ does not contain e, then it is contained in T, contradicting that T has no cycles. If δ does contain e, write it as the union of e and a path in T. Then it is a path from u to v. But γ is the only path from u to v in T.
Recognizing the critical importance of sustained oxygen supply-alongside pharmaceutical drugs such as dexamethasone - for the therapies of COVID-19, the Access to COVID Tools Incubator Therapeutics pillar is adopting a new role to coordinate and actively support for greater oxygen supply.
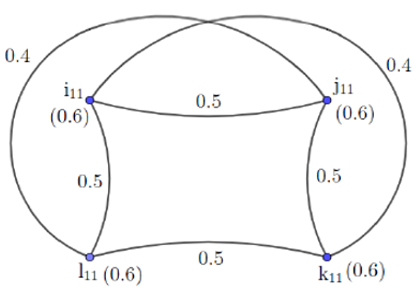
Consider the businesses i11, j11, k11 and l11that sell oxygen cylinders. The vertices in G represent the shops, while the edges represent the collaboration of one shop with another.
The PDSs for the figure are $D_1=\left\{l_{11}\right\}, D_2=$ $\left\{i_{11}, j_{11}\right\}, D_3=\left\{i_{11}, k_{11}\right\}, D_4=\left\{i_{11}, l_{11}\right\}, D_5=\left\{j_{11}, l_{11}\right\}, D_6=$ $\left\{j_{11}, k_{11}\right\}$.
Table 1. Power Domination Number of Figure 6
|
Power Dominating Set |
Power Domination Number |
|
D1 |
1 |
|
D2 |
2 |
|
D3 |
2 |
|
D4 |
2 |
|
D5 |
2 |
|
D6 |
2 |
In Table 1, calculating the base cardinality among other PDSs. Obviously D1 has the base cardinality among other PDSs, so we presume that it tends to be the most ideal decision since it will set aside time and cash for patients. Along these lines, the excess shops should expand oxygen cylinder creation, with the goal that patients can be distinguished at the earliest opportunity and don't need to go to various shops and went through a huge load of cash.
Example 4.1
For the graph G=(V, E).
Among other PDSs, calculating the base cardinality. Obviously, D1 has the lowest cardinality among all PDSs, so we assume it is the strongest decision because it will save time and funds for patients. In Tables 2 and 3, the edges and vertices has been referred for the application.
Table 2. Vertex values of Figure 6
|
Vertex |
Value |
|
i11 |
0.6 |
|
j11 |
0.6 |
|
k11 |
0.6 |
|
l11 |
0.6 |
Table 3. Edge values of Figure 6
|
Edge |
Value |
|
i11 j11 |
0.5 |
|
j11 k11 |
0.5 |
|
k11 l11 |
0.5 |
|
l11 i11 |
0.5 |
|
i11 k11 |
0.4 |
|
j11 l11 |
0.4 |
Figure 6. Graph of PDN
The dominance theory survey is intriguing because of the wide range of applications and dominant traits that can be established. The goal of this paper is to give a study of dominance theory in connection to different graphs. We constructed a solid [power supremacy] concept based on arcs. This paper introduces the concept of the power dominance number for entire graphs and presents some intriguing results.
The Power Domination Number for larger graphs created by different wheel family graphs with pathways and cycle graphs was investigated. The examples provided in regard to the current problem's nature are straightforward to comprehend. These concerns, as well as the aforementioned theorems, can be proven in a variety of power dominance models.
[1] Yang, B., Rafiulla, M., Siddiqui, H.M.A., Ahmad, S. (2019). On resolvability parameters of some wheel-related graphs. Journal of Chemistry, 1-9. https://doi.org/10.1155/2019/9259032
[2] Subbulakshmi, M., Valliammal, I. (2021). Decomposition of wheel graphs into stars, cycles and paths. Malaya Journal of Matematik, 9(1): 456-460. https://doi.org/10.26637/MJM0901/0076
[3] Chang, Y.W., Liu, S.P. (2021). Cartesian products of some regular graphs admitting antimagic labeling for arbitrary sets of real numbers. Journal of Mathematics, 1-8. https://doi.org/10.1155/2021/4627151
[4] Akram, M., Samanta.S., Pal, M. (2017). Cayley vague graphs. The Journal of Fuzzy Mathematics, 25(2): 449-462.
[5] Akram, M., Gani, A.N., Saeid, A.B. (2014). Vague hyper graphs. Journal of Intelligent & Fuzzy Systems, 26(2): 647-653. https://doi.org/10.3233/IFS-120756
[6] Borzooei, R.A., Rashmanlou, H. (2015). Degree of vertices in vague graphs. Journal of Applied Mathematics & Informatics, 33(5-6): 545-557. https://doi.org/10.14317/jami.2015.545
[7] Borzooei, R.A., Rashmanlou, H., Samanta, S., Pal, M. (2016). Regularity of vague graphs. Journal of Intelligent & Fuzzy Systems, 30(6): 3681-3689. https://doi.org/10.3233/IFS-162114
[8] Chang, G.J., Dorbec, P., Montassier, M., Raspaud, A. (2012). Generalized power domination of graphs. Discrete Applied Mathematics, 160(12): 1691-1698. https://doi.org/10.1016/j.dam.2012.03.007
[9] Cao, D. (1998). Bounds on eigenvalues and chromatic numbers. Linear Algebra and Its Applications, 270(1-3): 1-13. https://doi.org/10.1016/S0024-3795(96)00199-1
[10] Dean, N., Ilic, A., Ramirez, I., Shen, J., Tian, K. (2011). On the power dominating sets of hypercubes. IEEE 14th International Conference on Computational Science and Engineering, IEEE, pp. 488-491. https://doi.org/10.1109/CSE.2011.89
[11] Dorfling, M., Henning, M.A. (2006). A note on power domination in grid graphs. Discrete Applied Mathematics, 154(6), 1023-1027. https://doi.org/10.1016/j.dam.2005.08.006
[12] Dharmalingam, K.M, Nithya, P. (2017). Excellent domination in fuzzy graphs. Bulletin of the International Mathematical Virtual Institute, 7(2017): 257-266.
[13] Gau, W.L., Buehrer, D.J. (1993). Vague sets. IEEE Transactions on Systems, Man, and Cybernetics, 23(2): 610-614. https://doi.org/10.1109/21.229476
[14] Yang, H., Zhang, X.J. (2018). The independent domination numbers of strong product of two cycles. Journal of Discrete Mathematical Sciences and Cryptography, 21(7-8): 1495-1507. https://doi.org/10.1080/09720529.2017.1316988
[15] Nazeer, I., Rashid, T., Hussain, M.T., Garcia, J.L.G. (2021). Domination in join of fuzzy incidence graphs using strong pairs with application in trading system of different countries. Symmetry, 13(7): 1279. https://doi.org/10.3390/sym13071279
[16] Ismayil, A.M., Begum, H.S. (2021). Accurate split (non split) domination in fuzzy graphs. Advances and Applications in Mathematical Sciences, 20(5): 839-851.
[17] Karunambigai, M.G., Sivasankar, S., Palanivel, K. (2017). Different types of domination in intuitionistic fuzzy graph. Annals of Pure and Applied Mathematics, 14(1): 87-101. https://doi.org/10.22457/apam.v14n1a11
[18] Koh, K.M., Soh, K.W. (2019). On the Power Domination Number of the cartesian product of graphs. AKCE International Journal of Graphs and Combinatorics, 16(3): 253-257. https://doi.org/10.1016/j.akcej.2019.02.004
[19] Soh, K.W., Koh, K.M. (2018). Recent results on the Power Domination Numbers of graph products. New Zealand Journal of Mathematics, 48: 41-53.
[20] Liao, C.S., Lee, D.T. (2005). Power domination problem in graphs. In Computing and Combinatorics: 11th Annual International Conference, COCOON 2005 Kunming, China, August 16-19, 2005 Proceedings 11, Springer, Berlin, Heidelberg, pp. 818-828. https://doi.org/10.1007/11533719_83
[21] Saibavani, T.N., Parvathi, N. (2019). Power Domination Number of sunlet graph and other graphs. Journal of Discrete Mathematical Sciences and Cryptography, 22(6): 1121-1127. https://doi.org/10.1080/09720529.2019.1689610
[22] Saibavani, T.N., Parvathi. N. (2020). Graph Theory Approach for Monitoring Electrical Power System in Grid Network. Journal of Green Engineering, 10(10): 9422-9431.
[23] Manjusha, O.T., Sunitha, M.S. (2015). Strong domination in fuzzy graphs. Fuzzy Information and Engineering, 7(3): 369-377. https://doi.org/10.1016/j.fiae.2015.09.007
[24] Manjusha, O.T., Sunitha, M.S. (2019). Coverings, matchings and paried domination in fuzzy graphs using strong arcs. Iranian Journal of Fuzzy Systems, 16(1): 145-157. https://doi.org/10.22111/IJFS.2019.4490
[25] Whitehead, A.N., Russel, B. (1912). Principia Mathematica. Volume 2, Cambridge University Press, Cambridge.
[26] Haynes, T.W., Hedetniemi, S.M., Hedetniemi, S.T., Henning, M.A. (2002). Domination in graphs applied to electric power networks. SIAM Journal on Discrete Mathematics, 15(4): 519-529. https://doi.org/10.1137/S0895480100375831
[27] Rao, Y.S., Kosari, S., Shao, Z.H. (2020). Certain properties of vague graphs with a novel application. Mathematics, 8(10): 1647. https://doi.org/10.3390/math8101647
[28] Yu, A.M., Lu, M., Tian, F. (2004). On the spectral radius of graphs. Linear Algebra and Its Applications, 387: 41-49. https://doi.org/10.1016/j.laa.2004.01.020
[29] Zadeh, L.A. (1975). The concept of a linguistic variable and application to approximate reasoning-I. Information Sciences, 8(3): 199-249. https://doi.org/10.1016/0020-0255(75)90036-5