Noor Hussein*![]() | Abdul H. Shukur
| Abdul H. Shukur![]() | Zaid H. Majeed
| Zaid H. Majeed![]()
© 2023 IIETA. This article is published by IIETA and is licensed under the CC BY 4.0 license (http://creativecommons.org/licenses/by/4.0/).
OPEN ACCESS
In this paper, laboratory tests were used to determine the effects of skewness and pile-cap elevation on the local scour of complex bridge piers. The 1:50 scale river models represent the Beta complex bridge piers in Babylon Province and the Ali Al-Gharbi complex bridge piers in Missan Province. The model pier consists of circular columns, rectangular pile-cap, and 2×4 array of circular piles below for the Beta Bridge and 2×3 array of circular piles below for the Missan Bridge. Four different skew-angles (=0°, 30°, 45°, 60°) and pile-cap elevations corresponding to bed level are used. All experiments are conducted for twenty-four hours. Results suggest that locations of scour start, and maximum scour depth may be different, and that their relationship is dependent on pile-cap elevation and pier skew angle. Maximum equilibrium scour depth for aligned complex piers occurs when bottom of pile cap is above original bed level; for skewed complex piers, maximum equilibrium scour depth is much larger. Increase in depth of scouring is proportional to skew angle. Sensitivity of scour development to pier skew angle increases as pile-cap elevation increases, particularly when it is fully above original bed.
local scour, equilibrium scour depth, skewness, complex bridge pier, pile-cap elevation
The foundation of any hydraulic structure should be given the greatest importance in design and analysis as compared with other parts of the structure, because the foundation failure would destroy the whole structure [1]. The depth of pier foundation is one of the main requirements to design the bridge, this depth must be less than the maximum scour depth for the conditions resulting from 100-year flood [2]. One of leading causes of bridge pier failure is scour, resulting in a large number of bridge failures worldwide each year. Scour is a natural phenomenon caused by the flow of water in rivers and streams. It is the consequence of the erosive action of flowing water, which removes and erodes soil materials from the bed and banks of streams and also from the vicinity of bridge piles, piers and abutments. Also it can be defined as the lowering of the level of the river bed by water erosion such that there is a tendency to expose the foundations of structures such as bridges [3].
Local scour depth estimation around the bridge pier is a vital issue in the design of bridge piers. Various design methods and formula have been developed for estimating local scour depth in the vicinity of bridge piers. Scour depth studies started in the late 50s. Yang et al. [4] described the effects of flow and sediment parameters on the local scour around piers and discussed the functional trends of local scour based on laboratory data. Zhou et al. [5] discussed the generality of skew factors on scour geometry.
While a substantial amount of knowledge has been accumulated about the scour and flow structures around single piers over the past decade or so, comparatively little knowledge is available about the scour and flow field around pile groups and complex piers. Ghodsi et al. [6] studied the scour around submerged and un-submerged pile groups and presented a relationship to define the effect of pile spacing and attack angle on pile groups. Amini and Mohamed [7] investigated the effect of flow skew angle on local scour in pile groups. Ettema et al. [8] described scour geometry for pile groups with varying pile spacing. Accordingly, scour around pile groups may be caused by two mechanisms: 1) local scour in individual piles and, 2) global scour (general lowering of the bed) over the entire area of the pile group. Keshavarzi et al. [9] evaluated the commonly used equations to estimate the local scour depth in a group of piles for different spacing, arrangements, and submergences.
Complex geometry characterizes pier scour (i.e., complex piers) is an aspect of bridge scour that requires more study, particularly when considerable flow skew is occur. Typically, a complex pier is comprised of a column that supports bridge superstructure, a pile cap that underpins column, and a pile group below. pasts research at non-uniform piers on scour studied conditions for uniform piers, simple based on footings or caissons [10-14]. First investigations of scour at complex bridge piers were done by Jones and Sheppard [15]. Other studies of scour at complex bridge piers have been done [16-26]. However, none above research investigated the influence of pier skewness, which is a significant issue.
Using the equivalent pier width is an efficient strategy for addressing structural complexity of a complex pier, such that complex pier may be seen as cylinder with diameter equal to equivalent width. This approach is implicit in recommended approaches [16, 27]. In current research, series of experiments are conducted varying pile-cap elevations and pier skew angles to find variance in scour depth and pattern's characteristics.
Sousa and Ribeiro [28] studied the flow field around a pile supported pier positioned on a rough fixed bed with all components exposed to the approaching flow. They found that (1) the approaching boundary layer upstream the pile cap is separated into two vertical opposite directions, inducing an upward flow towards the column and a contracted downward flow below the pile cap and towards the piles; (2) the upward flow on the pile cap interacts with the down-flow in front of the column and deflects it towards the side of the pier; and (3) the flow at the rear of the pile cap is very complex, as the flow is simultaneously expanded to different directions.
The main purpose of present study investigates on scouring at pile-supported piers aligned and skewness to the flow direction, under clear-water conditions, close to the threshold of beginning of sediment motion, and the effects of the pile-cap elevation with three situations, the relative column width, number and configuration of piles pile group, and different discharges for different Iraqi soil types on the maximum scour depth at complex piers foundations.
2.1 Facilities
Experiments were carried out in rectangular recirculating flume constructed for flow conceptualization. The construction of the flume consists of glass walls and a steel frame. It is horizontal, non-tilting, and measures 7.5m in length, 1m in width, and 0.6m in depth, with smooth side walls. This section work consists of a 2m-long, 0.2m-deep depression that has been filled with various Iraqi soils and is placed 2.5m upstream of the flume inlet section.
On the upstream side of the flume is an overhead tank, into which water is pumped from the main reservoir tank. The primary purpose of this above tank is to provide the flume with a consistent flow of water at a continuous rate. In the upstream approach part, a wooden gate suppressor was also employed to calm the flow into the bed section. Every 50 centimeters from the flume entrance, baffles (two screens) are positioned to reduce turbulence and smooth flow to avoid any undesirable bed form (ripple or dune) at working section.
At the outlet portion of the flume, a (1*1) m rectangular gate has been installed to ensure that water depth at head and at end of the flume is equal, thus controlling the flow velocity. The utilized water from the flume is then released into the outlet tank, and the water from the reservoir at downstream end of flume is pumped to upstream end through a pipeline with a 4-inch diameter that runs immediately alongside the flume. There are four reservoir tanks: one in the outflow flume with dimensions of (1*0.9*0.55) m divided by a rectangular gate, and three alongside the flume with dimensions of (1.25*1.25*0.5) m.
A centrifugal pump placed at flume's downstream end delivered the flow rate via a conduit with a 3-inch diameter. A flow meter was employed to monitor water discharge in the water return pipe placed at flume's downstream end. Accuracy of the measurement instrument was + 0.4% of the flow rate. All depths are measured using a moveable point gauge installed on a brass rail at top of the side of flume, with an accuracy of +0.1mm.
2.2 Pier model and configuration
With a scale ratio of 1:50, a schematic of a complex bridge pier for a river with prototype measurements was made. produced from treated wood; that has been treated to resist water absorption, ease of manufacturing, ease of connecting parts, ease of handling and installation, closer to representing reality, delivers cost, health, and offers a low-carbon, environmentally-friendly. These types were made with a cylindrical column supported by pile group and rectangular pile cap. This final component configuration consists of two alignments of three or four cylindrical piles. As illustrated in Figure 1, longitudinal axis of complex pier models was aligned (α=0°) and skew-angled (α=30°, 45°, 60°) with the approach flow. The geometric properties of the model are described in Tables 1 and 2.
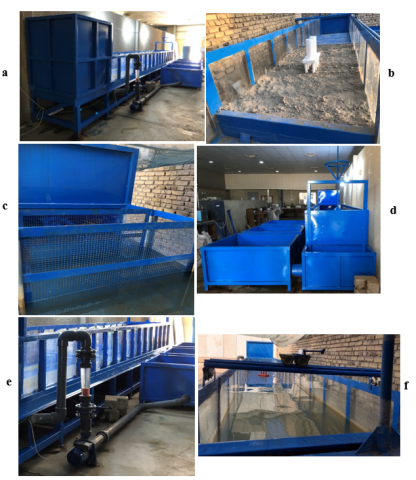
Figure 1. Laboratory flume: a. The channel design; b. Section work; c. Screens; d. The tanks; e. Pump and flow meter; f. Point gauge
Table 1. Dimensions of Beta complex pier model
|
Variable |
Dc |
Lc |
bpc |
Lpc |
T |
fcl |
fcb |
Dpg |
Sm |
Sn |
|
Dimension |
8 |
20 |
14 |
32 |
3 |
1 |
4 |
3 |
6 |
6 |
Table 2. Dimensions of Ali Al-Gharbi complex pier model
|
Variable |
Dc |
Lc |
bpc |
Lpc |
T |
|
Dimension |
2.5 |
10 |
14 |
23 |
2.5 |
|
Variable |
fcl |
fcb |
Dpg |
Sm |
Sn |
|
Dimension |
1 |
2.75 |
3 |
6 |
6 |
According to Melville et al. [29], to eliminate the influence of contraction on the scour depth, the flume width should be at least ten times the pier width, and the constant flow depth should be (7) cm.
3.1 Beta bridge in babylon province
Based on the Ministry of Construction, Housing, Municipalities, and Public Works' soil research. The soil extracted at a depth of 4-5 m from the Hilla River was sieved again and placed into test section, it's defined as (river sand with trace clay). The thickness of bed material is 20 cm with d50 0.45 mm, and slope of bed is parallel to surface of flume (S0=0).
3.2 Ali Al-gharbi bridge / missan province
According to the Ministry of Housing and Construction's National Center for Construction Labs and Research's soil studies. The soil obtained from the Missan River at a depth of 5 meters was sieved again and placed into test section; it is classed as sandy loam (black medium river sand). The thickness of the bed material is 20 cm with a d50 value of 0.37 mm, and slope of / bed is parallel to / surface of flume and set to 0 (S0=0).
3.3 Experimental procedure
(1) The model of the river was designed with the appropriate length scale to suit horizontal flume. The shape and position of bridge piers were developed based on bridge designs supplied by the general Authority for roads and bridges.
(2) The complex pier was first placed in the flume at the required location, firmly aligned and with skew-angles. Due to the different positions and directions of the piers, a substantial variation in the flow's manner may occur.
(3) Bed material (various Iraqi soils) was deposited in the bed recess, and the flume was leveled with a scraper. The initial bed elevations were measured using a point gauge at random locations to confirm that they were properly leveled. (20) cm of layer sand is present.
(4) The pump was then powered, and its speed gradually raised until desired flow rate was achieved. Tailgate was inspected to maintain the required flow depth in flume.
(5) During each test, the time is recorded using a stopwatch, flow is stopped, and flume is drained carefully to prevent any alteration of scour hole.
(6) The bed material (various Iraqi soils) was allowed to dry before the location and value of the maximum scour depth at three separate places were recorded. During the first hour, maximum scour depth values are obtained every several minutes. It should be emphasized that the first five hours of each test are critical, since many observations are necessary to define the initial phase of the graph of maximum scour depth against time.
(7) The bed material (various Iraqi soils) is then re-leveled, and the procedures are repeated after adjusting the alignment and skew-angle of the complex pier model to the flow direction.
4.1 Presentation of data / Bata bridge
Table 3 displays the results of the 18 24-hour-long tests conducted. There are several factors involved: the pier skew angle α, flow discharge, Q, pile-cap elevation Hc/h, and maximum scour depth ds.
Table 3. A summary of experimentally observed Beta River model data
|
Run |
$\alpha^o$ |
Q (l/s) |
V (m/s) |
Vc (m/s) |
Va (m/s) |
$\frac{V-(V a-V c)}{V c}$ |
Hc/h |
ds (cm) |
Rp |
F |
|
1 |
0 |
12.6 |
0.180 |
0.257 |
0.206 |
0.90 |
1.43 |
3.0 |
5400 |
0.217 |
|
2 |
0 |
13.5 |
0.193 |
0.257 |
0.206 |
0.95 |
1.43 |
3.8 |
5790 |
0.233 |
|
3 |
0 |
14.2 |
0.203 |
0.257 |
0.206 |
0.99 |
1.43 |
5.0 |
6090 |
0.245 |
|
4 |
30 |
14.2 |
0.203 |
0.257 |
0.206 |
0.99 |
1.43 |
7.5 |
6090 |
0.245 |
|
5 |
45 |
14.2 |
0.203 |
0.257 |
0.206 |
0.99 |
1.43 |
9 |
6090 |
0.245 |
|
6 |
60 |
14.2 |
0.203 |
0.257 |
0.206 |
0.99 |
1.43 |
11 |
6090 |
0.245 |
|
7 |
0 |
12.6 |
0.180 |
0.257 |
0.206 |
0.90 |
0.430 |
0.7 |
5400 |
0.217 |
|
8 |
0 |
13.5 |
0.193 |
0.257 |
0.206 |
0.95 |
0.430 |
1.3 |
5790 |
0.233 |
|
9 |
0 |
14.2 |
0.203 |
0.257 |
0.206 |
0.99 |
0.430 |
2.1 |
6090 |
0.245 |
|
10 |
30 |
14.2 |
0.203 |
0.257 |
0.206 |
0.99 |
0.430 |
2.5 |
6090 |
0.245 |
|
11 |
45 |
14.2 |
0.203 |
0.257 |
0.206 |
0.99 |
0.430 |
2.9 |
6090 |
0.245 |
|
12 |
60 |
14.2 |
0.203 |
0.257 |
0.206 |
0.99 |
0.430 |
3.3 |
6090 |
0.245 |
|
13 |
0 |
12.6 |
0.180 |
0.257 |
0.206 |
0.90 |
0 |
0.5 |
5400 |
0.217 |
|
14 |
0 |
13.5 |
0.193 |
0.257 |
0.206 |
0.95 |
0 |
0.75 |
5790 |
0.233 |
|
15 |
0 |
14.2 |
0.203 |
0.257 |
0.206 |
0.99 |
0 |
1.0 |
6090 |
0.245 |
|
16 |
30 |
14.2 |
0.203 |
0.257 |
0.206 |
0.99 |
0 |
1.3 |
6090 |
0.245 |
|
17 |
45 |
14.2 |
0.203 |
0.257 |
0.206 |
0.99 |
0 |
1.5 |
6090 |
0.245 |
|
18 |
60 |
14.2 |
0.203 |
0.257 |
0.206 |
0.99 |
0 |
1.7 |
6090 |
0.245 |
4.2 Influence of the pile-cap elevation
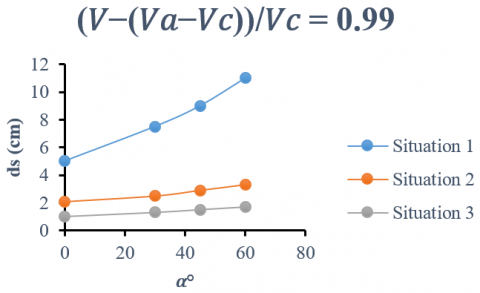
In alignment and skew-angle to the flow direction, 18 experiments with varying pile-cap positions were done. These tests consist of six per situation. In situation 1, a small increase in scour depth values may be justified by a correspondingly small increase in flow-exposed area. For the four Situation 2 tests (0°, 30°, 45°, and 60°), the scour depth development pattern is more comparable to the typical one found for Situation 1 experiments. This may be rationalized by fact that longitudinal axis of pile cap overlaps that of pile alignment, allowing upstream pile to contribute to scour process as soon as front of pile cap is exposed in scour hole. The progression of temporal scour depth for four tests of Situation 3 (0°, 30°, 45°, 60°) was, once again, a result of complicated pier geometry. In this test, where top of pile cap remained bottom of scour hole, as predicted, just first stage was found, as shown in Figures 2 and 3.
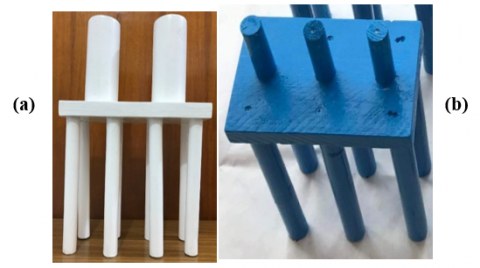
Figure 2. (a) Beta; (b) Ali Al-Gharbi: Complex bridge Pier model
Figure 3. Situation 1, 2, 3: Photograph of maximum scour hole for Beta bridge
4.3 Effluence of skew-angle
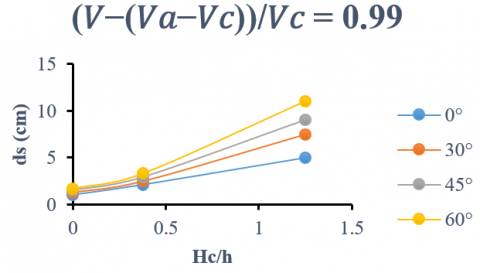
This is a follow-up experiment to [30, 31]. where skewness angle was the most important parameter in both. Experiments were conducted at angles (α= 0°, 30°, 45°, and 60°). In general, when the skewness angle increases, local scour depths increase considerably. However, this increase is more apparent at most upstream pier, which is skewed downstream. When most upstream and most downstream piers are situated at a skewness angle of α=60° in the downstream and upstream directions, respectively, scours developed around front piers increase by 35–50% compared to scours developed around vertical piers. Nonetheless, increased scour depths have been observed in skewness with asymmetry of very upstream pier. Around second pier, a 10-15% increase in scour depth was observed. Most downstream piers are skewed upstream; hence, an increase in scour depth may be expected as skewness angle increases. However, based on experimental results, there is no clear differentiation in scour depth. As skewness angle increases, intensity of vortices that move sediment particles around piers increases. When approach flow hits skewed pier, down-flow is separated into its components, and vertical component of down-flow decreases. Around cylindrical piers, smaller scour holes are created, and aggradation downstream of pier group decreases. Figure 4 shows variability in equilibrium scour depths with respect to skew-angle, as indicated in following figure.
Figure 4. Effect of pile-cap position on temporal evaluation of scour depth aligned and skew-angle for Beta bridge
4.4 Presentation of data / Ali Al-Gharbi bridge
Table 4 displays the results of the 18 24-hour-long tests conducted. There are several factors involved: The pier skew angle α, flow discharge, Q, pile-cap elevation Hc/h, and maximum scour depth ds.
Table 4. A summary of experimentally observed Ali Al-Gharbi River model data
|
Run |
$\boldsymbol{\alpha}^o$ |
Q (l/s) |
V (m/s) |
Vc (m/s) |
Va (m/s) |
$\frac{V-(V a-V c)}{V c}$ |
Hc/h |
ds (cm) |
Rp |
F |
|
1 |
0 |
10.9 |
0.155 |
0.257 |
0.206 |
0.80 |
1.1 |
2.2 |
4650 |
0.187 |
|
2 |
0 |
12.6 |
0.180 |
0.257 |
0.206 |
0.90 |
1.1 |
2.7 |
5400 |
0.217 |
|
3 |
0 |
14.2 |
0.203 |
0.257 |
0.206 |
0.99 |
1.1 |
4.0 |
6090 |
0.245 |
|
4 |
30 |
14.2 |
0.203 |
0.257 |
0.206 |
0.99 |
1.1 |
5.3 |
6090 |
0.245 |
|
5 |
45 |
14.2 |
0.203 |
0.257 |
0.206 |
0.99 |
1.1 |
6.0 |
6090 |
0.245 |
|
6 |
60 |
14.2 |
0.203 |
0.257 |
0.206 |
0.99 |
1.1 |
8.1 |
6090 |
0.245 |
|
7 |
0 |
10.9 |
0.155 |
0.257 |
0.206 |
0.80 |
0.36 |
0.5 |
4650 |
0.187 |
|
8 |
0 |
12.6 |
0.180 |
0.257 |
0.206 |
0.90 |
0.36 |
0.7 |
5400 |
0.217 |
|
9 |
0 |
14.2 |
0.203 |
0.257 |
0.206 |
0.99 |
0.36 |
1.0 |
6090 |
0.245 |
|
10 |
30 |
14.2 |
0.203 |
0.257 |
0.206 |
0.99 |
0.36 |
1.5 |
6090 |
0.245 |
|
11 |
45 |
14.2 |
0.203 |
0.257 |
0.206 |
0.99 |
0.36 |
1.9 |
6090 |
0.245 |
|
12 |
60 |
14.2 |
0.203 |
0.257 |
0.206 |
0.99 |
0.36 |
2.1 |
6090 |
0.245 |
|
13 |
0 |
10.9 |
0.155 |
0.257 |
0.206 |
0.80 |
0 |
0.35 |
4650 |
0.187 |
|
14 |
0 |
12.6 |
0.180 |
0.257 |
0.206 |
0.90 |
0 |
0.5 |
5400 |
0.217 |
|
15 |
0 |
14.2 |
0.203 |
0.257 |
0.206 |
0.99 |
0 |
0.75 |
6090 |
0.245 |
|
16 |
30 |
14.2 |
0.203 |
0.257 |
0.206 |
0.99 |
0 |
1.0 |
6090 |
0.245 |
|
17 |
45 |
14.2 |
0.203 |
0.257 |
0.206 |
0.99 |
0 |
1.2 |
6090 |
0.245 |
|
18 |
60 |
14.2 |
0.203 |
0.257 |
0.206 |
0.99 |
0 |
1.5 |
6090 |
0.245 |
4.5 Influence of the pile-cap elevation and pier skewness
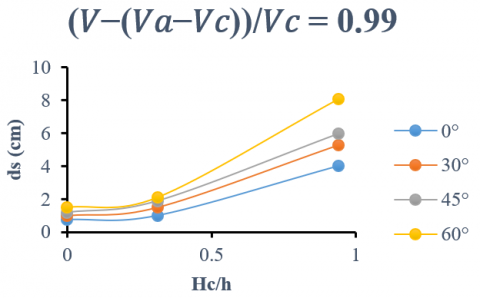
Results listed in Table 4 are shown in Figures 5 and 6, using the normalized scour depth ds with relation to normalize pile-cap elevation Hc/h, where h is flow depth. For aligned (α=0°) complex piers, scour depth increases as distance between undisturbed bed level and pile-cap decreases and reaches maximum when top of pile above bed (Hc/T=3 in this research). After this, as elevation of pile-cap decreases, pile-cap is at a level that is undisturbed and slightly less than bed level. Scour depth rapidly decreases, during this case, which is ascribed by more studies to protective influence of pile-cap, which disrupts the down-flow in front of pier. Results for piers aligned with flow are generally similar to results of other investigations.
Figure 5. Variation of equilibrium scour depth relative with skewness angle for Beta bridge
Figure 6. Situation 1,2,3: Photograph of maximum scour hole for Ali Al-Gharbi bridge
For complex skew angle piers, variation in scour depth with pile-cap elevation is fully variable. Once a relatively slight skew angle occurs, scour depth increases dramatically, particularly when pile-cap is elevated above the bed level. In addition, as illustrated in Figure 7, increase in scour depth is proportional to skew angle. Consequently, conditions considered safe for aligned piers (Hc/T=0) may be very unsafe when flow direction changes as a result of flow obstructions, flow constriction, or a specific flood event.
If column is significantly inserted into the flow for skewed complex piers, it causes greater disruption to flow and much stronger down-flow than pile group and pile-cap. Thus, the increased scour depth of skewed piers is mostly attributable to column's wall-like appearance, as illustrated in Figure 8. Complex piers behave much like wide piers with increasing flow skewness. This phenomenon also produces variations in flow shallowness and sediment coarseness as a function of skew angle.
Figure 7. Effect of pile-cap position from initial bed on temporal evaluation of scour depth for Ali Al-Gharbi bridge
Figure 8. Variation of equilibrium scour depth relative with skewness angle for Ali Al-Gharbi bridge
(1) For complex pier is aligned with flow, maximum scour depth occurs when pile cap above original bed level with increase (80%) compares with the pile-cap fully buried to the bed level for Beta Bridge and (81%) for Selebat Bridge. This similar to results of previous investigations. The protective effect of pile cap lowers scour depth significantly after occurrence of peak value upon increasing the pile cap position by disrupting the down-flow in front of pier.
(2) Equilibrium scour depth for skewed complex piers increases significantly compared to aligned piers. Increase in depth of scouring is proportional to skew angle α, it is (18%, 17%, and 33%) for (60°, 45°, 30°, and 0°) sequentially for Beta Bridge; and (26%, 12%, and 25%) for Selebat Bridge. Sensitivity of scour development to pier skew angle increases as pile-cap elevation increases, particularly when it is completely above original bed with increase (82.7%, 83.3%, and 84.6%) for (30°, 45°, and 60°) sequentially compare with the pile-cap fully buried to the bed level for Beta Bridge and (81%, 80%, and 81.5%) for Selebat Bridge.
(3) For complex piers skewed to flow direction, maximum scour depth typically occurs at downstream end of upstream row of piles, where pile group is exposed after scouring; maximum scour depth occurs at two upstream piles, or under front edge of pile-cap, depending on degree of pile-exposure cap's after scouring, when pier is aligned to flow; and maximum scour depth typically occurs at middle two piles, when pier is perpendicular to flow. Maximum scour depth generally occurs in front of pile-cap (aligned pier) or at pile-side for piers when pile-cap is partially submerged after scour. cap's (skewed pier). If pile-cap is completely submerged after scouring, as in column-only case, maximum scouring depth occurs at one of column's upstream edges. Typically, this situation shows the deepest scour.
[1] Al-Quraishi, Z.A. (2016). Effect of bridge pier shape on the depth and configuration of local scour. A thesis submitted to the college of engineering. University of Babylon. In partial fulfillment of the requirements for Degree of Master in Science in Water Resources.
[2] Yang, Y., Melville, B.W., Macky, G.H., Shamseldin, A.Y. (2020). Experimental study on local scour at complex bridge pier under combined waves and current. Coastal Engineering, 160: 103730. https://doi.org/10.1016/j.coastaleng.2020.103730
[3] Eldeeb, H.M., Fahmy, M.R. (2015). Effect of fully and partial submerged pile cap on local scour depth around piles. International Journal of Engineering Research & Technology (IJERT), 4(4). http://dx.doi.org/10.17577/IJERTV4IS040961
[4] Yang, Y., Melville, B.W., Macky, G.H., Shamseldin, A.Y. (2020). Temporal evolution of clear-water local scour at aligned and skewed complex bridge piers. Journal of Hydraulic Engineering, 146(4): 04020026. http://dx.doi.org/10.1061/(ASCE)HY.1943-7900.0001732
[5] Zhou, K., Duan, J.G., Bombardelli, F.A. (2020). Experimental and theoretical study of local scour around three-pier group. Journal of Hydraulic Engineering, 146(10): 04020069. https://doi.org/10.1061/(ASCE)HY.1943-7900.0001794
[6] Ghodsi, H., Khanjani, M.J., Beheshti, A.A. (2018). Evaluation of harmony search optimization to predict local scour depth around complex bridge piers. Civil Engineering Journal, 4(2): 402-412. http://dx.doi.org/10.28991/cej-0309100
[7] Amini, A., Mohammad, T.A. (2017). Local scour prediction around piers with complex geometry. Marine Georesources & Geotechnology, 35(6): 857-864. https://doi.org/10.1080/1064119X.2016.1256923
[8] Ettema, R., Constantinescu, G., Melville, B.W. (2017). Flow-field complexity and design estimation of pier-scour depth: Sixty years since Laursen and Toch. Journal of Hydraulic Engineering, 143(9): 03117006. https://doi.org/10.1061/(ASCE)HY.1943-7900.0001330
[9] Keshavarzi, A., Shrestha, C.K., Melville, B., Khabbaz, H., Ranjbar-Zahedani, M., Ball, J. (2018). Estimation of maximum scour depths at upstream of front and rear piers for two in-line circular columns. Environmental Fluid Mechanics, 18: 537-550. https://doi.org/10.1007/s10652-017-9572-6
[10] Jones, J.S., Kilgore, R.T., Mistichelli, M.P. (1992). Effects of footing location on bridge pier scour. Journal of Hydraulic Engineering, 118(2): 280-290. https://doi.org/10.1061/(ASCE)0733-9429(1992)118:2(280)
[11] Melville, B.W., Raudkivi, A.J. (1996). Effects of foundation geometry on bridge pier scour. Journal of Hydraulic Engineering, 122(4): 203-209. https://doi.org/10.1061/(ASCE)0733-9429 (1996)122:4(203)
[12] Parola, A.C., Mahavadi, S.K., Brown, B.M., El Khoury, A. (1996). Effects of rectangular foundation geometry on local pier scour. Journal of Hydraulic Engineering, 122(1): 35-40. https://doi.org/10.1061/(ASCE)0733-9429(1996)122:1(35)
[13] Lu, J.Y., Shi, Z.Z., Hong, J.H., Lee, J.J., Raikar, R.V. (2010). Temporal Variation of scour depth at nonuniform cylindrical piers. Journal of Hydraulic Engineering, 137(1): 45-56. https://doi.org/10.1061/(ASCE)HY.1943-7900.0000272
[14] Kothyari, U.C., Kumar, A. (2012). Temporal variation of scour around circular compound piers. Journal of Hydraulic Engineering, 138(11): 945-957. https://doi.org/10.1061/(ASCE)HY.1943-7900.0000593
[15] Jones, J.S., Sheppard, D.M. (2000). Local scour at complex pier geometries. In Proceedings of the ASCE 2000 Joint Conference on Water Resources Engineering and Water Resources Planning and Management, pp. 1-9. https://doi.org/10.1061/40517(2000)409
[16] Coleman, S.E. (2005). Clearwater local scour at complex piers. Journal of Hydraulic Engineering, 131(4): 330-334. https://doi.org/10.1061/(ASCE)0733-9429(2005)131:4(330)
[17] Sheppard, D.M., Glasser, T. (2009). Local scour at bridge piers with complex geometries. In Contemporary Topics in In Situ Testing, Analysis, and Reliability of Foundations. International Foundation Congress and Equipment Expo 2009, ASCE, pp. 506-513. https://doi.org/10.1061/41022(336)65
[18] Ataie-Ashtiani, B., Baratian-Ghorghi, Z., Beheshti, A.A. (2010). Experimental investigation of clear-water local scour of compound piers. Journal of Hydraulic Engineering, 136(6): 343-351. https://doi.org/10.1061/(ASCE)0733-9429(2010)136:6(343)
[19] Grimaldi, C., Cardoso, A.H. (2010). Methods for local scour depth estimation at complex bridge piers. In Procedings of 1st IAHR European Division Congress, pp. 1-6.
[20] Moreno, M., Maia, R., Couto, L., Cardoso, A. (2012). Evaluation of local scour depth around complex bridge piers. Proceedings of River Flow, 2: 935-942.
[21] Moreno, M., Maia, R., Couto, L., Cardoso, A. (2014). Contribution of complex pier components on local scour depth. In Proc. 3rd IAHR Europe Congress, pp. 1-10.
[22] Moreno, M., Maia, R., Couto, L. (2015). Effects of relative column width and pile-cap elevation on local scour depth around complex piers. Journal of Hydraulic Engineering, 142(2): 1-9. https://doi.org/10.1061/(ASCE)HY.1943-7900.0001080
[23] Moreno, M., Maia, R., Couto, L. (2016a). Prediction of equilibrium local scour depth at complex bridge piers. Journal of Hydraulic Engineering, 142(11): 1-13. https://doi.org/10.1061/(ASCE)HY.1943-7900.0001153
[24] Moreno, M., Maia, R., Couto, L., Cardoso, A.H. (2016b). Subtraction approach to experimentally assess the contribution of the complex pier components to the local scour depth. Journal of Hydraulic Engineering, 06016030. https://doi.org/10.1061/(ASCE)HY.1943-7900.0001270
[25] Ferraro, D., Tafarojnoruz, A., Gaudio, R., Cardoso, A.H. (2013). Effects of pile cap thickness on the maximum scour depth at a complex pier. Journal of Hydraulic Engineering, 139(5): 482-491. https://doi.org/10.1061/(ASCE)HY.1943-7900.0000704
[26] Amini, A., Melville, B.W., Ali, T.M. (2014). Local scour at piled bridge piers including an examination of the superposition method. Canadian Journal of Civil Engineering, 41(5): 461-471. https://doi.org/10.1139/cjce-2011-0389
[27] Sheppard, D.M., Renna, R. (2010). Bridge scour manual. Florida Department of Transportation, Florida.
[28] Sousa, A.M., Ribeiro, T.P. (2021). Local scour at complex bridge piers–experimental validation of current prediction methods. ISH Journal of Hydraulic Engineering, 27(sup1): 286-293. https://doi.org/10.1080/09715010.2019.1639223
[29] Melville, B.W., Coleman, S.E. (2000). Bridge scour. Water Resources Publications, LLC, Colorado, U.S.A.
[30] Bozkus, Z., Yildiz, O. (2004). Effect of inclination of bridge piers on scouring depth. Journal of Hydraulic Engineering, Middle East Technical University, 827-832. https://doi.org/10.1061/(ASCE)0733-9429(2004)130:8(827)
[31] Bozkus, Z., Çeşme, M. (2010). Reduction of scouring depth by using inclined piers. Canadian Journal of Civil Engineering, 37(12): 1621-1630. https://doi.org/10.1139/L10-099