Nunik Destria Arianti*![]() | Muhamad Muslih
| Muhamad Muslih![]() | Carti Irawan
| Carti Irawan![]() | Edo Saputra
| Edo Saputra![]() | Sariyusda
| Sariyusda![]() | Ramayanty Bulan
| Ramayanty Bulan![]()
© 2023 IIETA. This article is published by IIETA and is licensed under the CC BY 4.0 license (http://creativecommons.org/licenses/by/4.0/).
OPEN ACCESS
The established assessment of post-harvest attributes, such as the age of harvesting day, requires destructive sampling that the availability of fruit of trees can often limit and is expensive. In contrast, non-destructive post-harvest attribute assessment utilizing the NIR data spectrum is fast and reliable, especially for mango. However, NIR spectral data frequently produce non-linearity with the reference dataset used. Therefore, this study conducted research on using NIR spectral data to classify the harvesting age of mango fruits using machine learning algorithms. A total of five supervised machine learning algorithms were explored to generate the classification model, including gradient boost (GB), k-nearest neighbor (k-NN), decision tree (DT), random forest (RF), and linear discriminant analysis (LDA). In this study, 237 NIR spectral data from mango fruits with Arumanis cultivars from orchard sites in the Garut district, West Java Province (Indonesia) were measured to determine the appropriate harvest time using NIR spectra 1000 to 2500 nm. The data sets were randomly divided into training and testing datasets, 80% and 20%, respectively. Hyperparameter optimization was performed using the GridSearchCV function from scikit-learn by observing the evaluation of the confusion matrix. Generally, all machine learning algorithms can show performance in classifying the harvest age of mango fruit based on NIR spectra data. Based on the accuracy evaluation matrix, the best machine learning algorithm arranged to classify the age of mango fruit harvest is DT>GB>LDA>RF>k-NN. Finally, predictions generated using the DT algorithm from more established machine learning algorithms as a training and testing set consistently yielded higher prediction accuracy in classification models. This study provides a framework for understanding the feasibility of machine learning algorithms on NIR data spectral to the accuracy of classification prediction of the harvesting age of mango. In addition, this study presents the importance of assessing the performance of the classification model using confusion metrics.
artificial intelligent, classification, decision tree, near-infrared, postharvest attributes
The quality of the fruit, which includes textural attributes and flavor traits, is essential to determine the customer's preference for mango. From farmers to packing plants, the evaluation of post-harvest fruit quality typically considers some vital characteristics, such as firmness, soluble solid content, and titratable acidity. According to reports, firmness is a critical element that affects customer acceptability, with the concentration of soluble solids and titratable acidity enhancing the consumer experience. Therefore, the firmness of climacteric fruits has strongly correlated with their moisture content and post-storage soluble solid content and is generally recognized as a reliable measure of fruit quality [1-4].
Classical post-harvest characteristic measurements are time-consuming, challenging, and harmful. Fruit options for destructive sampling are often restricted in mango farms. Farmers struggle to collect uniformly mature fruit in addition to the specified amount of fruit [5]. Furthermore, little is known about selection-specific markers of maturity, which can result in very varied samples when paired with the regular within-canopy heterogeneity in maturity.
As a nondestructive alternative, NIR spectroscopy offers a respectable level of precision for assessing internal properties. Due to its simple, trustworthy, and affordable examination of postharvest features, nondestructive NIR-based prediction has been widely used in various fruits and vegetables. The NIR spectrum has attracted great interest in recent years, combined with machine learning and deep learning for data analysis. It has been proven to be a reliable predictor of the quality characteristics of different fruit crops, such as apples, mangoes, and pears [6-9].
Chemometrics is needed to extract and deconvolute detailed physical and chemical data to associate destructive observations with nondestructive NIR spectra. Chemometric applications in NIR spectroscopy frequently use partial least-squares regression to calibrate and validate the identification of quantitative correlations between two sets of measurement data, destructively obtained trait information, and nondestructive NIR spectra [10-12]. A calibration set builds a regression model to attempt to explain the relationship between various datasets. The regression model is then used to forecast the values of the desired attribute in an external validation set, taking the place of the traditional approach.
Partial least-squares regression (PLSR) is the most used method for NIR spectral analysis, since it is a linear multivariate analysis. However, because of the nonlinear connection between spectral data and the dependent variable, the accuracy of PLSR as a linear multivariate regression approach tends to decline. Therefore, nonlinear methods were introduced in the literature as better alternatives to partial least squares regression for spectroscopic analyses. Among those models, are based on machine learning, including artificial neural networks, support vector regression, random forests, gradient boost, recession tree, and k nearest neighbors have been shown to improve prediction performance [13-15].
Machine learning algorithms have recently attracted more and more interest in NIR spectral investigations. It offers several benefits, including resilience to noise, the ability to be used even when the predictor variables are more significant than the observations, the ability to suffer from modest overfitting, and the ability to assess the significance of each variable [16-18]. The machine learning technique can therefore manage non-linear and hierarchical behaviors when adding variability to the generic spectrum library for local sample prediction. Although few studies on the use of machine learning algorithms for the analyses of data spectra have been conducted, to our best knowledge, not much research and comparison of performance machine learning algorithm classification based on NIR spectra can be found in the literature. Some recent studies have investigated the feasibility of NIRS combined with machine learning to determine various quality attributes in fruits, as shown in Table 1.
Table 1. Overview of NIR combined with machine learning to predict some quality attributes of fruits
|
Attributes |
Fruits |
Ref. |
|
Total adicity |
Manggo |
[3] |
|
Maturity |
Manggo |
[19] |
|
Geographical origin |
Manggo |
[15] |
|
Flavonoid content |
Grapes |
[20] |
|
Internal qualities |
Newhall navel oranges |
[13] |
|
Rottenness |
Citrus fruits |
[14] |
To our knowledge, there are no reports on the application of NIR spectroscopy to classify the harvesting age of mangoes using a machine learning algorithm. Therefore, the overarching goal of this study was to evaluate the feasibility of several machine learning algorithms to generate a classification model from the spectral NIR data. The specific purpose of this study was to evaluate the performance classification accuracy of five machine learning algorithms for the prediction of the age of mango fruit harvesting based on spectral NIR data.
2.1 Sampling and spectral data acquisition
This study used four harvest age classes of Arumanis mango varieties, including 84, 91, 98, and 105 days after flowering (DAF). Mango fruit was obtained from an orchard in the Garut Regency, West Java (Indonesia). Spectral data were obtained by scanning using an NIRFlex N-500 spectrometer. The applied wavelength ranges from 1000 to 2500 nm with an interval of 0.4 nm. Measurements were carried out at room temperature (25℃).
2.2 Analysis of data using machine learning
A total of 5 machine learning algorithms were used to model the age classification of mangoes based on NIR spectral data. The five machine learning algorithms are gradient boost (GB), k-nearest neighbor (k-NN), decision tree (DT), random forest (RF), and linear discriminant analysis (LDA). All machine learning algorithm classifications ran in the Scikit-Learn Machine Learning Python library [21]. To evaluate the robustness model, we estimated the overall accuracy using 80% of the data for training and 30% for testing, randomly selected from 238 data spectra.
Due to its effectiveness, precision, and interpretability, gradient boosting (GB) is well known in machine learning. It has produced outstanding results in various machine learning applications, particularly multiclass classification [20]. However, it has not been widely applied in spectral data analysis, especially NIR.
The k-nearest neighbor (k-NN) algorithm is a classification method to establish several classes in the data. The nearest neighbors or surrounding samples in the search area are used to categorize each new piece. A new model is assigned a classification based on the class to which most of its k closest neighbors belong. Additionally, a parameter k that can be changed determines the number of neighbors examined. The Euclidean distance, the most popular and utilized in this study, must therefore be established as a metric to measure the distance between two data points [22].
A simple method to describe choices and their possibilities based on a tree-like graph is the Decision Tree (DT) algorithm. The primary application of decision trees is in the issues of categorization and regression. The choice is a class label in classification cases. Building binary decision trees and representing them using decision trees are well-known machine learning concepts. This phrase can sometimes be a little misleading because it can refer to a specific tree-building technique or be used as a catch-all word for any binary tree model [23].
The random forest (RF) algorithm is a well-known and influential ensemble algorithm that uses the bagging idea to build base learners, while GB uses the boost idea. Although RF has shown to be a cutting-edge approach that allows for maximum accuracy, it is still not widely used. Only 4.5% of the 286 studies that used RF machine learning methods implemented it, according to a recent evaluation of categorization problems using NIR spectra [20, 24].
The linear discriminant analysis (LDA) method for supervised pattern recognition maximizes variance between and minimizes variation within categories by computing the matrix covariance center and considering each class's covariance. LDA enables the creation of the best classification rule by guiding to a type that was a priori allocated to each sample of fish fillets or patties. The model looked for paths with the best possible separation among categories to improve class separability [25].
2.3 Optimizing algorithm hyperparameters
The GridSearchCV function was combined with a fit and score technique to produce the best results. In this approach, a model is initially fitted using a classifier using hyperparameter values on the training data (Table 2). After that, the mean absolute error is used to validate and grade the final model. The procedure is repeated with other combinations of hyperparameter values, enabling a thorough cross-validated search over a user-defined grid of classifier hyperparameters, with the optimal classifier hyperparameters providing the lowest error score.
Table 2. Hyperparameters for optimatation of machine algorithms
|
Algorithms |
Hyperparameter |
Tunning ranges |
|
GB |
Loss |
logloss, deviance, exponential |
|
n-estimators |
1 – 10 |
|
|
Sub-samples |
0 – 1.0 |
|
|
criterion |
Friedman mse, squared error, mse |
|
|
k-NN |
n-neighbors |
1 – 50 |
|
DT |
Min samples leaf |
1 – 10 |
|
Max leaf nodes |
1 – 10 |
|
|
RF |
Estimators |
10 – 100 |
|
Max depth |
5 – 20 |
|
|
Min weight fraction leaf |
0.1, 0.2, 0.3 |
|
|
LDA |
Solver |
svd, lsqr, eigen |
|
|
n-components |
1 – 50 |
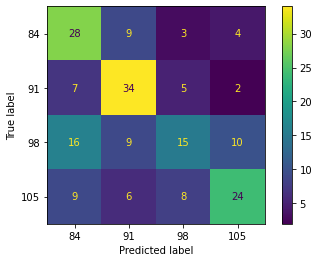
3.1 Gradient boosting algorithm for NIR spectral dataset
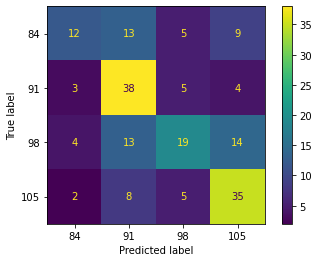
The performance of the gradient boosting (GB) algorithm plotted in the confusion matrix is shown in Figure 1. Generally, the classification of mango fruit harvesting age based on NIR spectral data is almost evenly distributed to all classes using this algorithm. The GB algorithm can only correctly classify the mango fruit harvest age at 84 days after inflorescence or flowering (DAF) in the training and testing stages, with 27 samples and 15 samples from a dataset, respectively. For the harvest age of mangoes at 91 DAF, the GB algorithm can only classify them correctly at the training and testing stages, as many as 45 samples and 9 samples from a dataset, respectively. Also, 41 samples (training) and 5 samples (testing) from the dataset can be classified correctly by the GB algorithm for the mango fruit harvest age class at 98 DAF. For the last class of 105 DAF, the GB algorithm can only correctly classify it at the training stage as many as 36 samples and 6 samples were detected at the testing stage.
The optimum performance of the GB algorithm for classifying the harvest age of mangoes based on the NIR spectral data of 1000-2500 nm can be completed by optimizing the hyperparameters. The optimization is accomplished using the GridSearchCV in Scikit-learn's model selection function. The results of hyperparameter optimization using the GridSearchCV function suggest using function to measure the quality of a split is MSE through loss function to be optimized is deviance. The number of boosting stages to perform is nine from default 100, with fraction of samples to be used for fitting the individual base learners is 0.6 from default 1.0. By optimizing these hyperparameters, the performance of the model is presented in Table 3. Specifically, it was found that the accuracy of using this algorithm at the training and testing stages was 79% and 73%, respectively. The performance of this algorithm is satisfactory for application practice compared to previous research, which found that GB can perform better than others for similar agricultural products [20, 26, 27].
Training
Testing
Figure 1. Confusion matrix of GB algorithm
Table 3. Evaluation metrics of the GB algorithm
|
Class |
Training |
Testing |
||||||
|
Pre |
Rec |
F1-S |
Acc |
Pre |
Rec |
F1-S |
Acc |
|
|
84 |
0.82 |
0.69 |
0.75 |
0.79 |
0.88 |
0.83 |
0.86 |
0.73 |
|
91 |
0.78 |
0.90 |
0.83 |
0.50 |
0.90 |
0.64 |
||
|
98 |
0.77 |
0.82 |
0.80 |
0.83 |
0.50 |
0.62 |
||
|
105 |
0.80 |
0.72 |
0.76 |
0.86 |
0.60 |
0.71 |
||
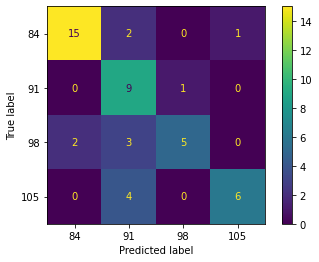
3.2 K-nearest neighbor algorithm for NIR spectral dataset
The performance of the k-nearest neighbor (k-NN) algorithm plotted in the confusion matrix is shown in Figure 2. The k-NN algorithm can correctly classify the mango fruit harvest age at 84 DAF in the training and testing stages, with 28 samples and 5 samples from a dataset, respectively. For the harvest age of mangoes at 91 DAF, the k-NN algorithm can classify them correctly at the training and testing stages, as many as 34 samples and 7 samples from a dataset, respectively. Also, 15 samples (training) and 3 samples (testing) from the dataset can be classified correctly by the k-NN algorithm for the mango fruit harvest age class at 98 DAF. For the last class of 105 DAF, the k-NN algorithm can correctly classify it at the training stage as many as 24 samples, and 7 samples were detected at the testing stage.
Training
Testing
Figure 2. Confusion matrix of k-NN algorithm
The optimal hyperparameter for the k-NN algorithm is achieved by determining the correct number of neighbors to suppress the classification model error as low as possible. GridSearchCV in Scikit-learn's model selection function can do that in python programming. The results show that the optimal number of neighbors (k) as a hyperparameter of the k-NN algorithm is six. By optimizing these hyperparameters, the model's performance is depicted in Table 4. Precisely, it was found that the accuracy of using this algorithm at the training and testing stages was 53% and 46%, respectively. The performance of the k-NN algorithm is insufficient for application practice compared to the previously analyzed GB algorithm. Also, the model generated by k-NN algorithm tends to be overfitting which can be seen when testing with independent dataset testing, resulting in a sharp drop in accuracy.
Table 4. Evaluation metrics of the k-NN algorithm
|
Class |
Training |
Testing |
||||||
|
Pre |
Rec |
F1-S |
Acc |
Pre |
Rec |
F1-S |
Acc |
|
|
84 |
0.47 |
0.64 |
0.54 |
0.53 |
0.31 |
0.38 |
0.34 |
0.46 |
|
91 |
0.59 |
0.71 |
0.64 |
0.47 |
0.58 |
0.52 |
||
|
98 |
0.48 |
0.30 |
0.37 |
0.43 |
0.30 |
0.35 |
||
|
105 |
0.60 |
0.51 |
0.55 |
0.70 |
0.54 |
0.61 |
||
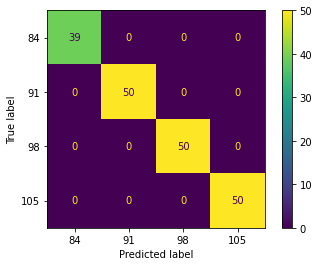
3.3 Decision tree algorithm for NIR spectral data
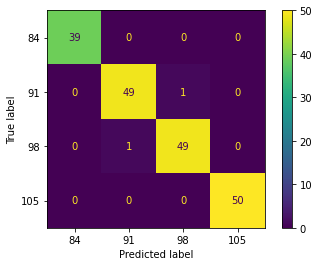
The performance of the decision tree (DT) algorithm plotted in the confusion matrix is shown in Figure 3. The DT algorithm can correctly classify the mango fruit harvest age at 84, 91, 98 and 105 DAF in the training and testing stages perfectly. From these results, there is no doubt that the DT algorithm can perfectly classify the harvesting age of mangoes based on the optical properties of NIR (1000-2500 nm).
Training
Testing
Figure 3. Confusion matrix of DT algorithm
The optimal hyperparameter for the DT algorithm is achieved by determining function to measure the quality of a split tipe and strategy used to choose the split at each node tipe to suppress the classification model error as low as possible. In python programming, it can be optimized using packages from Scikit-learn's via the GridSearchCV model function. The results demonstrate that the optimal function to measure the quality of a split type and strategy used to choose the split at each node are log_loss and randomly, respectively. By optimizing these hyperparameters, the model's performance is depicted in Table 5. Rigorously, it was found that the accuracy of using this algorithm at the training and testing stages was perfect to discriminate the harvest age of mangoes. The performance of the DT algorithm is the best for application practice compared to all analyzed algorithm in this study. In fact, there are not many research results that try to explore this algorithm, especially for NIR spectral data, except reported by Kucheryavskiy [23] for tecator and beer.
Table 5. Evaluation metrics of the DT algorithm
|
Class |
Training |
Testing |
||||||
|
Pre |
Rec |
F1-S |
Acc |
Pre |
Rec |
F1-S |
Acc |
|
|
84 |
1.0 |
1.0 |
1.0 |
1.0 |
1.0 |
1.0 |
1.0 |
1.0 |
|
91 |
1.0 |
1.0 |
1.0 |
1.0 |
1.0 |
1.0 |
||
|
98 |
1.0 |
1.0 |
1.0 |
1.0 |
1.0 |
1.0 |
||
|
105 |
1.0 |
1.0 |
1.0 |
1.0 |
1.0 |
1.0 |
||
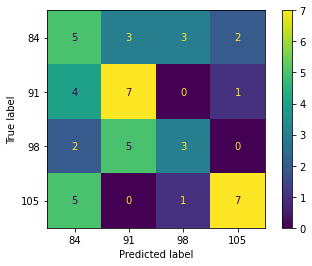
3.4 Random forest algorithm for NIR spectral data
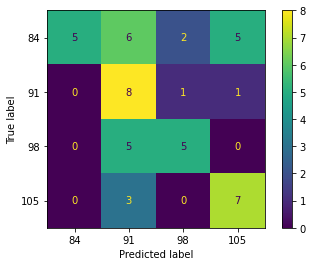
The performance of the random forest algorithm (RF) plotted in the confusion matrix is shown in Figure 4. The RF algorithm can correctly classify the mango fruit harvest age at 84 DAF in the training and testing stages, with 12 samples and 5 samples from a dataset, respectively. For the harvest age of mangoes at 91 DAF, the RF algorithm can classify them correctly in the training and testing stages, up to 38 samples and 8 samples from a dataset, respectively. Also, 19 samples (training) and 5 samples (testing) from the dataset can be correctly classified by the RF algorithm for the mango fruit harvest age class at 98 DAF. For the last class of 105 DAF, the RF algorithm can correctly classify it in the training stage as many as 35 samples, and 7 samples were detected in the testing stage.
Training
Testing
Figure 4. Confusion matrix of RF algorithm
The optimal hyperparameter for the RF algorithm is achieved by determining a function to measure the quality of a split tipe and strategy used to choose the split at each node type. The package from scikit-learn's with the GridSearchCV function can be used for optimizing these hyperparameters. The results show that the optimal function to measure the quality of a split tipe and strategy used to choose the split at each node tip are log_loss and random. By optimizing these hyperparameters, the model's performance is depicted in Table 6. Specifically, it was found that the precision of using this algorithm in the training and testing stages was 55% and 52%, respectively. The performance of the RF algorithm is better for application practice compared to the previously analyzed k-NN algorithm. However, it still loses compared to the GB, DT, and LDA algorithm. However, the model generated by the RF algorithm tends to be more stable and avoids under- and over-fitting which can be seen when testing with independent dataset testing compared to the LDA algorithm. In addition, the accuracy value of the RF algorithm is better than that of the k-NN algorithm.
Table 6. Evaluation metrics of the RF algorithm
|
Class |
Training |
Testing |
||||||
|
Pre |
Rec |
F1-S |
Acc |
Pre |
Rec |
F1-S |
Acc |
|
|
84 |
0.57 |
0.31 |
0.40 |
0.55 |
1.00 |
0.28 |
0.43 |
0.52 |
|
91 |
0.53 |
0.76 |
0.62 |
0.36 |
0.80 |
0.50 |
||
|
98 |
0.56 |
0.38 |
0.45 |
0.62 |
0.50 |
0.56 |
||
|
105 |
0.56 |
0.70 |
0.62 |
0.54 |
0.70 |
0.61 |
||
3.5 Linear discriminant analysis algorithm for NIR spectral data
The performance of the linear discriminant analysis (LDA) algorithm plotted in the confusion matrix is shown in Figure 5. The LDA algorithm can correctly classify the mango fruit harvest age at 84 DAF in the training and testing stages, with 39 samples and 9 samples from a dataset, respectively. For the harvest age of mangoes at 91 DAF, the LDA algorithm can classify them correctly in the training and testing stages, as many as 49 samples and 8 samples from a dataset, respectively. Also, 49 samples (training) and 8 samples (testing) from the dataset can be correctly classified using the LDA algorithm for the mango fruit harvest age class at 98 DAF. For the last class of 105 DAF, the LDA algorithm can correctly classify it in the training stage as many as 50 samples, and 8 samples were detected in the testing stage.
Training
Testing
Figure 5. Confusion matrix of LDA algorithm
The optimal hyperparameter for the RF algorithm is achieved by the number of components for dimensionality reduction is one where this parameter only affects the transform method. Solver by singular value decomposition (svd) because this solver is recommended for data with a large number of features. By optimizing these hyperparameters, the model performance is depicted in Table 7. Specifically, it was found that the accuracy of using this algorithm at the training and testing stages was 99% and 69%, respectively. The performance of the LDA algorithm is insufficient for application practice compared to the previously analyzed GB and DT algorithm in the training stages but not in the testing stages. Additionally, the model generated by the LDA algorithm tends to be overfitting, which can be seen when testing with independent dataset testing, resulting in a sharp drop in accuracy.
Table 7. Evaluation metrics of the LDA algorithm
|
Class |
Training |
Testing |
||||||
|
Pre |
Rec |
F1-S |
Acc |
Pre |
Rec |
F1-S |
Acc |
|
|
84 |
1.0 |
1.0 |
1.00 |
0.99 |
0.82 |
0.50 |
0.62 |
0.69 |
|
91 |
0.98 |
0.98 |
0.98 |
0.62 |
0.80 |
0.70 |
||
|
98 |
0.98 |
0.98 |
0.98 |
0.50 |
0.80 |
0.62 |
||
|
105 |
1.0 |
1.0 |
1.00 |
1.00 |
0.80 |
0.89 |
||
3.6 Discussion
Generally, the resume accuracy of the evaluation matrix of the machine learning algorithm used in the study is shown in Figure 6. It can be seen that the DT algorithm is the superior machine learning algorithm and k-NN is a machine learning algorithm that has not performed satisfactorily in classifying the harvesting age of mangoes based on NIR spectral data in the range of 1000 to 2500 nm. The advantages of the DT algorithm are easy to understand and interpret, as the final model is a tree-based representation and can handle both categorical and numerical data. But, behind that, there are drawbacks, namely, being prone to overfitting, especially with many features or a complex tree structure. Also can be biased towards features with many outcomes, leading to suboptimal results. However, this weakness can be overcome by repeated data-splitting tests. The benefits of kNN are that it is simple to understand and implement, can handle large feature spaces, and is helpful for non-linearly separable data. But the weaknesses are that it is computationally expensive during testing, sensitivity to irrelevant features and the scale of the data and can be affected by the curse of dimensionality.
The GB, k-NN and DT algorithms are more consistent in achieving classification modeling in this study. This can be seen from the difference in accuracy at the training and testing stages of less than 10%. In contrast to the RF and LDA algorithms, the difference in accuracy between training and testing exceeds 10%. On the one hand, the LDA algorithm seems to perform well in the training phase. On the other hand, the LDA algorithm cannot confirm it when the resulting classification model is tested using an independent training data set. The benefits of the LDA algorithm are that it is computationally efficient, easy to implement, well-suited for high-dimensional data and multiclass problems, and handles irrelevant features well. Besides, the burden of LDA assumes a Gaussian distribution of the input data, which is prone to overfitting when the number of elements is much larger than the number of samples. The advantages of the GB algorithm are that it is flexible, can handle heterogeneous features, efficient in dealing with overfitting, and provides essential feature values. Also, the disadvantages of GB are that it requires careful tuning of hyperparameters, is sensitive to noisy data, is prone to overfitting when the number of trees is too large and is computationally expensive.
Figure 6. Comparison performance accuracy of machine learning algorithm
This study found that machine learning algorithms can be used in classification modeling based on NIR spectral data. Among the machine learning algorithms used in this study to classify the harvest age of mangoes are GB, k-NN, DT, RF, and LDA. However, from the point of view of accuracy performance, the algorithm can be arranged from the best to DT>GB>LDA>RF>k-NN. The results of this study suggest the use of the machine learning DT algorithm in practical application to perform an initial screening to classify the harvest age of mangoes. In addition, future work based on the results of this study is to conduct testing using unknown mango samples to re-test the robustness of the classification model generated from the DT algorithm before it can be applied in the field.
This study highlighted the evaluation of five machine learning algorithms based on the NIR spectral for the classification of the harvesting age of mango. In general, testing to determine the classification harvest age of mango using a machine learning algorithm exhibited high prediction accuracy. Akurasi pada tahap training dari lima algorithm machine learning yang dipelajari dalam studi ini masing-masing adalah 79% (GB), 53% (k-NN), 100% (DT), 55% (RF), dan 99% (LDA). Dari itu, susunan algorithm machine learning terbaik untuk menangani klasifikasi umur panen buah mangga adalah DT>GB>LDA>RF>k-NN. Our work provided an empirical framework and guidelines for applying machine learning algorithms in the classification of mango harvest age with satisfactory results. Furthermore, our study showed that the spectral analysis of NIR data followed by a machine learning process is a reliable, cheap and fast classification tool that can draw a complete classification of the harvest age of mango. The next step of this work will be to study the robustness of the classification model developed using unknown dataset samples from several mango plantations before deployment in a real field.
[1] dos Santos Neto, J.P., de Assis, M.W.D., Casagrande, I.P., Cunha Júnior, L.C., de Almeida Teixeira, G.H. (2017). Determination of ‘Palmer’ mango maturity indices using portable near infrared (VIS-NIR) spectrometer. Postharvest Biology and Technology, 130: 75-80. https://doi.org/10.1016/j.postharvbio.2017.03.009
[2] Raghavendra, A., Guru, D.S., Rao, M.K. (2021). Mango internal defect detection based on optimal wavelength selection method using NIR spectroscopy. Artificial Intelligence in Agriculture, 5: 43-51. https://doi.org/10.1016/j.aiia.2021.01.005
[3] Munawar, A.A., Zulfahrizal, Meilina, H., Pawelzik, E. (2022). Near infrared spectroscopy as a fast and non-destructive technique for total acidity prediction of intact mango: Comparison among regression approaches. Computers and Electronics in Agriculture, 193: 106657. https://doi.org/10.1016/j.compag.2021.106657
[4] Sitorus, A., Novrinaldi, N., Bulan, R. (2020). Non-invasive moisture content measurement system based on the ESP8266 microcontroller. Bulletin of Electrical Engineering and Informatics, 9(3): 924-932. https://doi.org/10.11591/eei.v9i3.2178
[5] Agustina, S., Devianti, Bulan, R., Muslih, M., Sitorus, A. (2022). Performance evaluation of pre-processing and pre-treatment algorithm for near-infrared spectroscopy signals: Case study pH of intact mango “arumanis”. International Journal of Design and Nature and Ecodynamics, 17(4): 571-577. https://doi.org/10.18280/ijdne.170411
[6] Liu, Y.D., Ying, Y.B., Fu, X.P., Lu, H.S. (2007). Experiments on predicting sugar content in apples by FT-NIR technique. Journal of Food Engineering, 80(3): 986-989. https://doi.org/10.1016/j.jfoodeng.2006.06.035
[7] Lakade, A.J., Venkataraman, V., Ramasamy, R., Shetty, P.H. (2019). NIR spectroscopic method for the detection of calcium carbide in artificial ripening of mangoes (magnifera indica). Food Additives & Contaminants: Part A, 36(7): 989-995. https://doi.org/10.1080/19440049.2019.1605206
[8] Pu, Y.Y. Sun, D.W. (2016). Prediction of moisture content uniformity of microwave-vacuum dried mangoes as affected by different shapes using NIR hyperspectral imaging. Innovative Food Science & Emerging Technologies, 33: 348-356. https://doi.org/10.1016/j.ifset.2015.11.003
[9] Maheswari, P., Raja, P., Apolo-Apolo, O.E., Pérez-Ruiz, M. (2021). Intelligent fruit yield estimation for orchards using deep learning based semantic segmentation techniques-A review. Frontiers in Plant Science, 12: 684328. https://doi.org/10.3389/fpls.2021.684328
[10] Sarkar, S., Basak, J.K., Moon, B.E., Kim, H.T. (2020). A comparative study of PLSR and SVM-R with various preprocessing techniques for the quantitative determination of soluble solids content of hardy kiwi fruit by a portable Vis/NIR spectrometer. Foods, 9(8): 1078. https://doi.org/10.3390/foods9081078
[11] Amuah, C.L.Y., Teye, E., Lamptey, F.P., Nyandey, K., Opoku-Ansah, J., Adueming, P.O.W. (2019). Feasibility study of the use of handheld NIR spectrometer for simultaneous authentication and quantification of quality parameters in intact pineapple fruits. Journal of Spectroscopy, 2019: 5975461. https://doi.org/10.1155/2019/5975461
[12] Liu, Y.D., Sun, X.D., Ouyang, A. (2010). Nondestructive measurement of soluble solid content of navel orange fruit by visible-NIR spectrometric technique with PLSR and PCA-BPNN. LWT-Food Science and Technology, 43(4): 602-607. https://doi.org/10.1016/j.lwt.2009.10.008
[13] Liu, C., Yang, S.X., Deng, L. (2015). Determination of internal qualities of newhall navel oranges based on NIR spectroscopy using machine learning. Journal of Food Engineering, 161: 16-23. https://doi.org/10.1016/j.jfoodeng.2015.03.022
[14] Gómez-Sanchis, J., Martín-Guerrero, J.D., Soria-Olivas, E., Martínez-Sober, M., Magdalena-Benedito, R., Blasco, J. (2012). Detecting rottenness caused by penicillium genus fungi in citrus fruits using machine learning techniques. Expert Systems with Applications, 39(1): 780-785. https://doi.org/10.1016/j.eswa.2011.07.073
[15] Gao, P., Xu, W., Yan, T.Y., Zhang, C., Lv, X., He, Y. (2019). Application of near-infrared hyperspectral imaging with machine learning methods to identify geographical origins of dry narrow-leaved oleaster (elaeagnus angustifolia) Fruits. Foods, 8(12): 620. https://doi.org/10.3390/foods8120620
[16] McNeish, D.M. (2015). Using lasso for predictor selection and to assuage overfitting: A method long overlooked in behavioral sciences. Multivariate Behavioral Research, 50(5): 471-484. https://doi.org/10.1080/00273171.2015.1036965
[17] Park, Y. Ho, J.C. (2021). Tackling overfitting in boosting for noisy healthcare data. IEEE Transactions on Knowledge and Data Engineering, 33(7): 2995-3006. https://doi.org/10.1109/TKDE.2019.2959988
[18] Anderson, R.P., Gonzalez, I. (2011). Species-specific tuning increases robustness to sampling bias in models of species distributions: An implementation with maxent. Ecological Modelling, 222(15): 2796-2811. https://doi.org/10.1016/j.ecolmodel.2011.04.011
[19] Sohaib Ali Shah, S., Zeb, A., Qureshi, W.S., Malik, A.U., Tiwana, M., Walsh, K., Amin, M., Alasmary, W., Alanazi, E. (2021). Mango maturity classification instead of maturity index estimation: A new approach towards handheld NIR spectroscopy. Infrared Physics & Technology, 115: 103639. https://doi.org/10.1016/j.infrared.2021.103639
[20] Brillante, L., Gaiotti, F., Lovat, L., Vincenzi, S., Giacosa, S., Torchio, F., Segade, S.R., Rolle, L., Tomasi, D. (2015). Investigating the use of gradient boosting machine, random forest and their ensemble to predict skin flavonoid content from berry physical-mechanical characteristics in wine grapes. Computers and Electronics in Agriculture, 117: 186-193. https://doi.org/10.1016/j.compag.2015.07.017
[21] Pedregosa, F., Varoquaux, G., Gramfort, A., Michel, V., Thirion, B., Grisel, O., Blondel, M., Müller, A., Nothman, J., Louppe, G., Prettenhofer, P., Weiss, R., Dubourg, V., Vanderplas, J., Passos, A., Cournapeau, D., Brucher, M., Perrot, M., Duchesnay, E. (2011). Scikit-learn: Machine learning in Python. Journal of Machine Learning research, 12: 2825-2830. https://doi.org/10.48550/arXiv.1201.0490
[22] Ramirez-Morales, I., Aguilar, L., Fernandez-Blanco, E., Rivero, D., Perez, J., Pazos, A. (2021). Detection of bovine mastitis in raw milk, using a low-cost NIR spectrometer and k-NN algorithm. Applied Sciences, 11(22): 10751. https://doi.org/10.3390/app112210751
[23] Kucheryavskiy, S. (2018). Analysis of NIR spectroscopic data using decision trees and their ensembles. Journal of Analysis and Testing, 2(3): 274-289. https://doi.org/10.1007/s41664-018-0078-0
[24] Sun, Y., Liu, N., Kang, X.M., Zhao, Y.F., Cao, R., Ning, J.S., Ding, H.Y., Sheng, X.F., Zhou, D.Q. (2021). Rapid identification of geographical origin of sea cucumbers Apostichopus japonicus using FT-NIR coupled with light gradient boosting machine. Food Control, 124: 107883. https://doi.org/10.1016/j.foodcont.2021.107883
[25] Grassi, S., Casiraghi, E., Alamprese, C. (2018). Handheld NIR device: A non-targeted approach to assess authenticity of fish fillets and patties. Food Chemistry, 243: 382-388. https://doi.org/10.1016/j.foodchem.2017.09.145
[26] Chia, K.S., Suarin, N.A.S.B. (2022). Neural network and extreme gradient boosting in near infrared spectroscopy. 2022 International Conference on Innovations and Development of Information Technologies and Robotics, pp. 123-127. https://doi.org/10.1109/IDITR54676.2022.9796490
[27] Zhao, Q.H., Zhang, Z.F., Huang, Y.C., Fang, J.L. (2022). TPE-RBF-SVM model for soybean categories recognition in selected hyperspectral bands based on extreme gradient boosting feature importance values. Agriculture, 12(9): 1452. http://dx.doi.org/10.3390/agriculture12091452