Irfan Ullah Khan
© 2022 IIETA. This article is published by IIETA and is licensed under the CC BY 4.0 license (http://creativecommons.org/licenses/by/4.0/).
OPEN ACCESS
Significance of machine learning (ML), deep learning (DL) techniques and the availability of Electronic Health Records (EHR) has motivated the need of automated diagnosis system. Furthermore, this development has transformed the health care systems. Recently, several ML and DL models has been proposed for various diseases and has shown the significant outcomes as well. Unfortunately, Urinary tract infections (UTI) is among the minor diseases that is not investigated a lot interms of diagnosing using computation intelligence techniques. However, these models lack the reliability due to the black box nature of the highly complex logic model. Therefore, we attempt to develop an interpretable deep learning (DL) model for the diagnosis of UTI using the dataset of emergency department (ED) patients from UK. Several sets of experiments were conducted using complete dataset, reduced attribute set identified using recursive feature elimination (RFE) and using the attributes identified by the baseline study. The proposed DL model has improved the baseline study accuracy from 0.875 to 0.9275 for 184 feature and 0.859 to 0.943 for the reduced feature. Furthermore, the model has outperformed interms of sensitivity and specificity as well. Due to the data imbalance positive predicted value (PPV), negative predicted value (NPV) and Youden Index was also used for evaluating the performance of the model. The proposed DL model has achieved the highest outcome using 18 attributes selected with RFE technique. The proposed model will produce reliability in the diagnosis made by the model and provide confidence to the doctors to adopt the system in the real life.
deep learning, machine learning, urinary tract infection, explainable artificial intelligence
Urinary tract infection (UTI) is one of the most common microbial infections in females and is a cause of morbidity [1]. Each year 8.3 million of patients visit the doctors and emergency department. while 1 million hospitalizations due to UTI [2]. It was found that 1 out of 5 women were infected with UTI during their life. Furthermore, it is more prevalent in female as compared to male. This is due to the shorter urethra the bacteria can easily enter. However, UTI is also found in the older persons as well due to the difficulty of clearing the bladder completely during urination and will lead to the risk of cystitis. Furthermore, frequent UTI can cause several other health complications such as kidney damage, prostate cancer, and pyelonephritis. Although the patients with diabetes are more prone to UTI as compared to others [3, 4].
Some of the common symptoms are difficulty in urination, burning sensation, frequent urination, strong smell, cloudy urine, pelvic pain, and hematuria. To diagnose UTI several physical examinations, lab assessments and ultrasound are usually used. For the treatment of UTI several antibiotics were recommended by the doctors. Frequently taking the antibiotics can create the antimicrobial resistance and then can also lead to other complications. Timely diagnosis can reduce the risk of further complications and control the prevalence of disease.
Because of the low discriminatory accuracy of individual clinical findings, multi-variate statistical models have been developed to better distinguish cases of UTI from those of other conditions. Over several years, Machine Learning (ML) and Deep Learning (DL) has automated the diagnosis of various diseases and produce significant results [5-11]. However, there is always a tradeoff among the interpretability and the performance of the models. Usually, the highly interpretable model doesn’t produce the high results. Therefore, interpretability need to be compromised and, in some cases, it is highly significant and can’t be compromised. Therefore, Explainable Artificial Intelligence (XAI) is an emerging subject nowadays, that mainly concentrates on the addressing the interpretability and comprehensibility of the black box ML and DL models [12, 13]. The aim of these techniques is to make the backbox models as the glass box. These ML and DL models’ performance in the healthcare has achieved the remarkable outcome. However, the healthcare professionals encountered the challenge of lack of trust and reliability on these complex low interpretable models. Specifically, if the wrong diagnosis has been made, then finding out the reasons is not possible in highly complex less interpretable model. And will ultimately lead to resistance in applying these AI based models in the real life. Therefore, XAI has achieved significant consideration in various fields specifically the healthcare [14]. Some of the studies have been made to diagnose UTI using various ML models. However, to the best of the author knowledge so far none of the study has used XAI and DL for the diagnosis of UTI. Therefore, in the current study an attempt has been made to develop a model with the significant predictive performance, while also maintaining the interpretability of the model to enhance the trust.
Finally, the main contributions of the proposed study are:
(1) The proposed study attempts to explore the significance of DL for the diagnosis of UTI.
(2) Develop a model with the enhanced interpretability using XAI.
(3) Identification of reduced set of attributes for the early diagnosis of UTI in order to reduce the risk of further complications.
(4) Over-all, the proposed model outperformed the baseline study.
To further elaborate, the remainder of this work is structured as followed, section II contains the review of related studies. Section III discusses the proposed methodology, DL technique followed by section IV which contains experimental setup, results, and discussion. Finally, section V presents the conclusion and recommendation emanating from this work.
Some studies have been made to diagnose UTI using different ML algorithm. Heckerling et al. [15] developed an artificial neural network (ANN) based model for the diagnosis of UTI among the 212 female patients with the age 19-84. They used symptoms, urine analysis and culture findings. Furthermore, Genetic algorithms was used for feature selection. The study achieved the ROC of 0.853 to 0.792. Furthermore, Rockenschaub et al. [16] developed a risk prediction model for the urine culture growth in the suspected UTI patients using emergency department in UK. The study used a dataset of suspected UTI patients during the year 2011-2017, containing clinical, demographic data and lab results. Several experiments were performed using the data after different hours after the admission. logistic regression (LR) model was used as a prediction model with the goal of improve the prescription of antibiotics decision.
Additionally, an expert system was developed using ANN to predict the outcome of consuming antibiotics for treating UTIs [17]. The study covers the patient’s data containing two bacteria i.e., Klebsiella pneumoniae and Escherichia coli. Most of the records in the dataset contains the patients with Escherichia coli bacteria. Therefore, the proposed ANN algorithm produced sensitivity of 0.998 for the prevalent class and 0.72 for the other class. However, another study [18] was performed to predict the resistance of drugs using ML models such as ANN, support vector machine (SVM) and Catboost and cloud platform namely “DSaaS”. Catboost achieved the highest accuracy of 0.717, sensitivity of 0.904 for predicting the multi-drug resistant UTI.
Similarly, another study was made to identify the significant attributes for the prediction of uncomplicated UTI using ML [19]. Random forest (RF) and SVM was used for classification, while feature selection was performed using RFE method. They found that urine cloudiness, turbidity score and immunology biomarkers as one of the most discriminating features for predicting the UTI and non UTI urine analysis of 183 patients. Several sets of experiments were conducted using clinical, immunological biomarkers, cloudiness, and turbidity. The study achieved the highest AUC of 0.86 using SVM with selected features i.e., clinical biomarkers and turbidity. Similarly, the highest PPV of 0.82 was found using immunological biomarkers. However, the best NPV of 0.79 was achieved using RF and the selected features were cloudiness and clinical biomarkers. The study achieved significant results however it also suffers from the limitation of small size dataset.
Furthermore, another study was performed to develop an automated system for UTI detection using the data from three centers [20]. The aim of the study was to reduce the classical diagnosis overhead. Three supervised learning algorithms namely NN, extreme gradient boosting (XGB) and RF was compared. The dataset was divided into three subsets i.e., pregnant women, under 11 years and other category. They achieved the highest sensitivity of 0.95 for other categories using XGB. The study found that the proposed model has reduce the overload of UTI detection to 41%.
Taylor at al. [18] performed a study on 80387 patients’ sample in the emergency department using 211 features of different categories. Several ML algorithms were used such as RF, Adaboost (AB), XGB, SVM, ANN, LR, and Elastic Net. As compared to the previously mentioned study, they have used the largest number of patient’s sample and covering different attribute categories such as vital signs, medication, demographic information, patient’s past history, comorbidity, and different examination (physical, neurological, abdominal etc.). Experiments were conducted using the complete and reduced features. The selection of the reduced features was based on the features that were identified as significant in the previous studies. The reduced set contains 10 features. XGB achieved the best results with the reduced and full feature set. The highest AUC of 0.90 was achieved with complete feature set and 0.87 with the reduced set. However, best accuracy of 0.875 was achieved using XGB with the full feature set.
Recently, Møller et al. [21] developed a preemptive UTI diagnosis system to identify the patients at risk during the hospitalization. Several ML models have been used such as NN, DT, GB, and regression model to predict the hospital acquired and catheter acquired UTI at the time of admission and after 48 hours. DT achieved the highest ROC of 0.81 at the time of admission and 0.74 after 48 hours. The significant outcome from the current study motivates the implication and further investigation of ML models for identifying the at-risk patients for hospital acquired diseases.
In spite of several studies have examined to identify the risk factors for UTIs and early diagnosis of UTI. These studies have proved the significance of ML in the diagnosis. As per the authors knowledge very few studies have been performed on the diagnosis of UTI using ML and no study has used XAI. The main aim of the current study is to develop an interpretable preemptive UTI diagnosis system using the patient’s dataset in the emergency department. Due to the successful implication of DL models in the prediction, we will use the DL models for the prediction.
To the best of author knowledge, no study has so far has investigated the DL and XAI for UTI diagnosis. Large datasets are required for better training the DL model therefore, in the current study the dataset of 80,387 patients was used [18]. During the study, three set of experiments were conducted using different feature set to explore the impact of feature type in the diagnosis of UTI using emergency department patients. First the experiment was conducted using full attribute after removing the redundant attributes. Secondly, RFE technique was applied to select the reduced attributes i.e., 18. Nevertheless, DL models doesn’t suffer from the curse of dimensionality. But the aim of feature selection was to reduce the overhead of multiple lab results and for the early diagnosis using initial data. Similarly, to compare the performance of the proposed model with the baseline study experiment was also conducted using the reduced features identified by Taylor et al. study [18].
The proposed study used deep learning model for UTI prediction. Figure 1 contains the methodology used in the current study.
Figure 1. Proposed methodology of the current study
3.1 Deep learning model
Deep learning (DL) is currently one of the widely used supervised learning technique used for diagnosis and prediction of different diseases [11]. However, to the best of the authors knowledge DL models has so far not investigated for the diagnosis of UTI. DL models has the capability to express the complex relationship. However, training DL models require huge amount of data. The dataset used in the current study contains 80387 emergency department patients, which is sufficient enough to train the DL model. Initially DL models were proposed for the images, later due to its successful implication in images they were also utilized for other type of data such as audio, textual and tabular data.
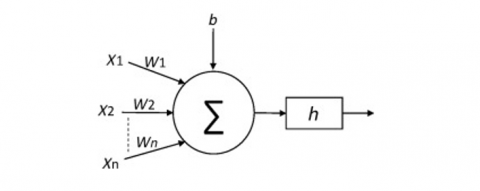
Figure 2. The conceptual view of an artificial neuron
A DL is a set of neurons structured in a series of numerous layers, where neurons getting as input the neuron activations from the previous layer and performing a simple computation. Figure 2 shows a representation of a neuron:
$z=\sum_{i=1}^n w_i x_i+b$ (1)
$y \equiv h(z)$ (2)
where, wi are the weights applied to the inputs xi, b is the bias and h represents an activation function. The Sigmoid and Rectified Linear Unit (ReLU) activation function are used in the proposed study. The equations of these activation functions are:
$h(z)=\frac{1}{1+e^{-z}}$ (3)
The TensorFlow Keras sequential API was used to build the model. The 6 block deep neural network with each block containing two layers followed by a dropout layer with rate = 0.2 to avoid overfitting the model and forcing the model to learn more robust features. The number of neurons in each block is 1024, 512, 256, 128, 64 and 32 respectively. The final layer is a classification layer with a single neuron to differentiate between positive and negative UTI patients. The early stopping strategy was used to monitor the model performance during training. The rectified linear unit (ReLU) activation function is used for the hidden layers as it is the best and most widely used activation function in deep learning tasks, while a sigmoid activation function is used for the output layer. Binary cross entropy was set as the loss function and Adam as the optimization algorithm, while metrics were set for accuracy only. To train the model, the epochs were set to 100, the batch size to 64 together with additional setting of callbacks whereby the monitor was set to “validation accuracy”, save best only to “True” and mode to “max”.
3.2 Evaluation measures
The performance of the proposed model was compared in terms of accuracy, F-score, sensitivity, specificity, PPV, NPV and Youden index (YI). In order to calculate the aforementioned measures, True Positive, True Negative, False Positive and False Negative need to be determined.
True positive represents the number of those patients that have been diagnosed as UTI positive and were also classified by the proposed model as UTI-positive. While true negative (TN) are those patients’ sample that were diagnosed as UTI-negative and classified by the model as well as the negative. The models with high TP and TN values indicate the significance of the model. However false positive (FP) and false negative (FN) indicate the misclassification of the prediction model. FP indicate the patient’s sample that were originally diagnosed as UTI negative, but the prediction model labeled it as UTI positive. Similarly, FN indicate the number of patient’s sample that were originally UTI positive patients although the model has labeled it as negative. The model will the high FP and FN rate can lead to adverse outcome on the patient health. Therefore, in the automated diagnosis system, significant consideration was given to reduce the FP and FN especially it the dataset suffers from imbalance. The dataset used in the current study suffers from imbalance therefore, other measure such as specificity, sensitivity, F-score, NPV, and PPV measures were used in addition to the accuracy of the model. The formula for calculating these measures is mentioned in the below equations.
Accuarcy $=\frac{(T P+T N)}{\text { Total number of patient sample }}$ (4)
Precision $=\frac{(T P)}{(T P+F P)}$ (5)
The aforementioned measure like accuracy is highly sensitive to imbalanced data. As seen in the Eq. (4), the accuracy of the model considers the number of correctly predicted patients, so if the dataset suffers from imbalance, this measure will not indicate the actual performance of the model. These measures cannot consider the correctly classified results for all the classes. Therefore, measures such as F-score, specificity, sensitivity, PPV, NPV and Youden Index is used.
$F_1-$ score $=\frac{T P}{T P+\frac{1}{2}(F P+F N)}$ (6)
Specificity $(S P)=\frac{T N}{(T N+F P)}$ (7)
Sensitivity $(S N)=\frac{T P}{(T P+F N)}$ (8)
$P P V=\frac{T P}{(T P+F P)}$ (9)
$N P V=\frac{T N}{(F N+T N)}$ (10)
Youden Index $(Y I)=S N+S P-1$ (11)
Youden Index (YI) one of the significant measures for the diagnosis test for measuring the discrimination power of the test. YI index near to zero indicates poor discrimination power, however closer to one indicates the significance of the diagnostic test.
3.3 Generating explanations
Interpretability is one of the significant factors in the healthcare to enhance the reliability and trust of the automated models. The emergence of XAI has integrated the interpretability in the complex black box ML models like SVM, ANN, ensemble-based models etc. and also in the DL models. The study has used the post-hoc XAI approach, that generate the explanation without affecting the performance of the model. The post-hoc XAI, generate the explanation at two levels, global and the local level. The global explanations, integrate the transparency by letting the doctors to gain a deeper understanding about the inner mechanism of the proposed AI based models like how these clinical biomarkers (features) contribute to the diagnosis. In the current study for the global interpretation Shapley additive explanation (SHAP) has been used. It uses a concept of game theory to represent how much each feature is contributing. Figure 3 represents the global explanation of the proposed DL model. In the figure, the features are represented on Y-axis while the X-axis represents the SHAP value. Furthermore, red color indicates higher value (negative impact), blue value indicates low value (positive impact).
While Figure 4 represents the local interpretation of the proposed model. The local interpretation was generated using LIME. The local interpretation will explain that for a given instance, which biomarkers are significant for the diagnosis. This will enable the doctors to identify which particular range for the specific biomarker, has led to the UTI. It will provide the deeper understanding not only to identify which attribute is significant, but also within each attribute which specific range of values are adding to the correct prediction. The numbers in the figure represents the prediction probability. Furthermore, induced decision tree was used to extract the rules from the proposed DL model and is represented in the Figure 5.
Figure 3. Global interpretation of the proposed DL model using SHAP
Figure 4. Local interpretation of the proposed DL model using LIME
Figure 5. Induced tree for the proposed DL model
The rules extracted from the induced DT is mentioned below. The rules contain the attribute values, probability of the prediction and also the number of samples that support the prediction made.
if (ua_wbc<=2.5) & (ua_nitrite<=0.5) & (ua_wbc<=1.5)→ class: 1 (proba: 99.09%) | based on 51,374 samples
if (ua_wbc<=2.5) & (ua_nitrite<=0.5) & (ua_wbc>1.5)→ class: 1 (proba: 83.26%) | based on 15,525 samples
if (ua_wbc<=2.5) & (ua_nitrite>0.5) & (ua_wbc > 1.5)→ class: 1 (proba: 64.4%) | based on 3,683 samples
if (ua_wbc>2.5) & (ua_epi >0.5) & (ua_bacteria <= 3.5)→ class: 1 (proba: 61.41%) | based on 2,620 samples
if (ua_wbc<=2.5) & (ua_nitrite>0.5) & (ua_wbc<=1.5)→ class: 1 (proba: 79.95%) | based on 1,776 samples
if (ua_wbc>2.5) & (ua_epi<=0.5) & (ua_bacteria>0.5)→ class: 1 (proba: 88.93%) | based on 1,400 samples
if (ua_wbc>2.5) & (ua_epi>0.5) & (ua_bacteria>3.5)→ class: 1 (proba: 77.64%) | based on 1,145 samples
if (ua_wbc>2.5) & (ua_epi<=0.5) & (ua_bacteria<=0.5) → class: 1 (proba: 66.37%) | based on 452 samples
else class: 0
The study was implemented using python programming language version 3.8.5 and Google Colab GPU. Several libraries were used like Sklearn (ver. 0.23.2), NumPy (ver. 1.18.5), Pandas (ver. 1.3.4), Dalex (ver. 1.4.1), SHAP (ver. 0.40.0), LIME (ver. 0.2.0.1) and Keras (ver. 2.4.3). The study was performed using 80387 sample for the emergency department patients. The dataset contains several types of features such as demographic, hospital data, sign, symptoms, lab investigations, comorbidity, examination (general physical, neurological, abdomen examination) and medication. The data was collected between March 2013- May 2016. Initially the dataset contains 217 attributes and 80387 patient’s sample with 17166 samples for positive class and 63221 for the negative class. In initial dataset 8 attributes were demographic, three attributes were related to hospital data like deposition, depo, arrival, 11 attributes were related to signs, 18 attributes were related to symptoms, 61 attributes related to lab results, 39 attributes were related with comorbidities, 30 attributes were related to general, physical and neurological examination, and finally 43 attributes were related to the medication.
Some of the attributes contains multiple values such as O2 saturation, O2 amount, temp, heart rate, systolic blood pressure, diastolic blood pressure, respiratory rate, Glasgow coma scale. These attributes contain patients first, last, min, max and mean. Mean values of these attributes were used to train the model. Furthermore, repeating attributes such as disposition, dispo were removed. Similarly, some of the symptoms contains missing values and were imputed using the information in the chief complaints. There are some symptoms like fever, hematuria, back pain, dysuria, flank pain and fatigue, contains some missing values represented as “not reported” in the dataset. These symptoms information is also available in the chief complaint attributes. Therefore, the missing values were imputed using the data from the chief complaints. The dataset contains 68% of the female patients, 30.5% of male and 1.34% of the patient’s gender was not reported. Similarly, among the positive UTI patients 72% of the patients were female. The mean age of the patient in the dataset is 53.81 and similarly the interquartile (IQR) range is 38. However, the mean age of the positive patients is 57.36 while, for negative patients it is 52.8.
The chief complaint attribute contains 22 categories related to the symptoms like abdominal pain, fever, hematuria, vaginal bleeding, flank pain, dizziness, fatigue, dysuria, back pain, etc. Furthermore, there is one more category “fever-9 weeks to 74 years:20” is replaced by fever. Similarly, initially in the chief complaint attribute contains 1080 samples as ‘not reported’ and 18,559 samples as ‘other’. The values of these categories were imputed using the data related to these symptoms in the dataset. After the imputation, ‘not reported’ samples were reduced to 601 and ‘other’ to 10907. Abdominal pain is one of the most frequent complaints among the patients in the dataset. Table 1 shows the baseline characteristics of the selected attributes for the reduced model after the preprocessing.
Table 1. Baseline characteristics of the selected attributes of the dataset used in the current study
|
Characteristics |
Feature Name |
Datatype |
No of categories |
Missing Values |
|
Demographic |
Age (min-max) |
Numeric |
18-109 |
0 |
|
Sign & symptoms |
Chief Complaints |
Categorical |
22 |
0.75 |
|
Hospital Data |
Disposition |
Categorical |
11 |
0.07 |
|
Urine Analysis and Lab Results |
Bacteria |
Categorical |
6 |
37.60 |
|
Blood |
Categorical |
6 |
0.04 |
|
|
Clarity |
Categorical |
3 |
18.46 |
|
|
Epithelial Cell |
Categorical |
6 |
34.94 |
|
|
Leukocytes |
Categorical |
6 |
0.04 |
|
|
Nitrite |
Categorical |
4 |
0.03 |
|
|
Red Blood Cell (RBC) |
Categorical |
6 |
28.96 |
|
|
White Blood Cell (WBC) |
Categorical |
6 |
26.61 |
|
|
Urobili |
Categorical |
3 |
5.30 |
|
|
ANC |
Categorical |
6 |
27.91 |
|
|
Anion_gap |
Categorical |
6 |
13.70 |
|
|
Absolute_Lymphocyte_count |
Categorical |
6 |
38.68 |
|
|
Hematocrit |
Categorical |
6 |
11.65 |
|
|
MPV |
Categorical |
6 |
11.89 |
|
|
UCX_abnormal |
Categorical |
2 |
0.00 |
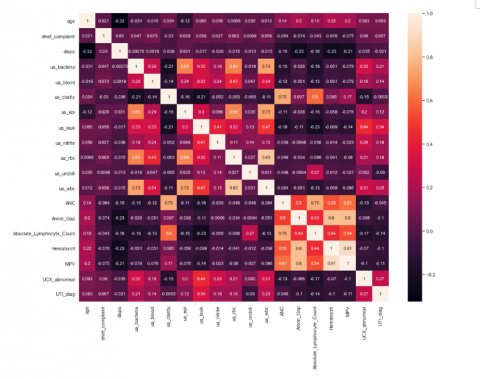
The correlation is represented by the heatmap in Figure 6. The attributes are selected using RFE technique. RFE is a wrapper-based feature selection technique for classification and regression problem [22]. In the RFE, the algorithm starts with the complete set and recursively removing the features until the model achieved the highest outcome. The ranking of the features was made using the feature importance function. Feature importance function use different coefficient measure or classifiers for ranking the features. The number of selected attributes for the reduced model were 18.
Figure 6. Heatmap of the selected attributes in the dataset
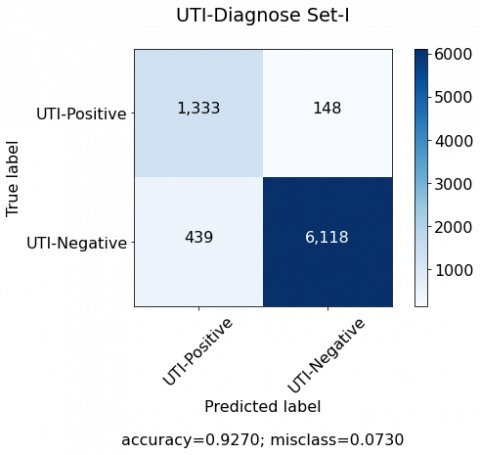
10-Fold cross validation was used for distributing the data into training and testing. Three set of experiments were conducted. Initially the experiment was conducted using the complete dataset. While for the second experiment, features were selected using RFE and top 18 features were selected. However, last experiment was performed using the reduced features identified by the Taylor’s study [18]. The number of attributes for the third experiment were 10. Table 2 contains the names of the selected features for each experiment. The confusion matrix that the DL model generates on the test data is shown in Figure 7, while the result of the proposed model is shown in the Table 3. DL model with 18 features produced the best outcome. Although, DL models can’t suffer from the curse of dimensionality, nonetheless the aim of the study is to develop a diagnosis model with the reduced set of features in order to reduce the overhead of several diagnosis methods used in the clinical setting.
Table 2. Experimental results obtained from the test set using 10-fold stratified cross-validation
|
Experiment |
No of Features |
Name of the features |
|
Set II |
18 |
'age','chief_complaint’, 'dispo','ua_bacteria','ua_blood', 'ua_clarity', 'ua_epi', 'ua_leuk', 'ua_nitrite’, 'ua_rbc', 'ua_urobili', 'ua_wbc', 'ANC', 'Anion_Gap', 'Absolute_Lymphocyte_Count', 'Hematocrit', 'MPV’, 'UCX_abnormal', |
|
Set III |
10 |
'age’, 'gender’, 'ua_leuk’, 'ua_nitrite’, 'ua_wbc', 'ua_bacteria’, 'ua_blood’, 'ua_epi’, 'dysuria’, 'dispo' |
Table 3. Experimental results obtained from the test set using 10-fold stratified cross-validation
|
Experiment |
ACC |
F-Score |
SN |
SP |
PPV |
NPV |
|
Set 1 |
0.93 |
0.82 |
0.75 |
0.98 |
0.90 |
0.93 |
|
Set II |
0.95 |
0.87 |
0.80 |
0.99 |
0.96 |
0.95 |
|
Set III |
0.90 |
0.89 |
0.60 |
0.98 |
0.89 |
0.90 |
The reduced attributes are age, gender, leukocytes, nitrites, White Blood Cell (WBC), bacteria, blood, epithelial cell, dysuria, and history of UTI in the Taylor study [18]. Some of the attributes selected by the current study is similar to Taylor study. Common attributes are age, dysuria, bacteria, blood, nitrite, WBC, leukocytes, and epithelial cell. Similarly, the study [15] also used some of the features like WBC, RBC, dysuria, leukocytes, bacteria and epithelial cell.
(a) Set-I
(b) Set-II
(c) Set-III
Figure 7. Confusion matrix generates by the DL model for (a) Set-I, (b) Set-II and (c) Set-III
Conversely, Gadalla et al. [19] identified the attributes for handling the uncomplication UTI. They found urine cloudiness, immunology biomarkers and turbidity score as the significant attribute. The NPV and PPV achieved by the current study is better when compared with the study [19]. Furthermore, the study also suffered from the limitation of dataset size. As shown in the table set II achieved the highest outcome in terms of accuracy, and F-score. However, the sensitivity, specificity, and PPV of set I is almost similar to set II, but the number of features is very less in set II when compared with set I. While the NPV of set I is higher than set II. The YI for set I is 0.928, set II is 0.921 and set III is 0.909. The YI for set 1 and set 2 is similar, but the number of features is very huge as compared to the features in set 1.
In order to further validate the performance of the proposed model, the outcome was compared with the Taylors study. Because the dataset used in the current study was first utilized by Taylor et al. [18]. Table 4 represents the comparison of the proposed model with the baseline study.
Table 4. Comparison of the proposed DL model with the Taylor’s study [18]
|
Study |
Model |
Accuracy |
SN |
SP |
|
Taylor et al. [18] |
XGB |
0.88 |
0.62 |
0.95 |
|
0.86 |
0.55 |
0.95 |
||
|
Current study |
DL |
0.93 |
0.75 |
0.98 |
|
0.95 |
0.80 |
0.99 |
Regardless of the considerable outcomes accomplished by the current study, there is even room for further development and investigation. The study was performed using a single dataset and need to be further investigated on multiple datasets. Furthermore, the dataset suffers from missing values and imbalance. However, the proposed study produced significant outcome for both full and reduced features when compared with Taylor et al. [18].
To summarize, in the current study an XAI based model was developed for the diagnosis of UTI using Deep Learning (DL) model. Despite of the significance of ML, DL and XAI in the automated diagnosis of several diseases, yet XAI and DL has not been previously investigated for the diagnosis of UTI. Furthermore, limited number of studies have been performed on the diagnosis of UTI using ML. The study has also identified the significant attributes for the diagnosis. The results have shown the significance of DL in the diagnosis of UTI using the dataset from the emergency department. Comparing the results of the proposed study with the benchmark has also confirmed the significance. The accuracy was improved from 0.875 to 0.9276 with the full feature set and 0.859 to 0.943 for the reduced feature set. Due to the data imbalance the results of the model were validated in terms of the measures such as SN, SP, PPV, NPV and YI that are insensitive to class imbalance. Nevertheless, the study achieved considerable outcome, but the proposed model needs to be further investigated on other datasets. Owing to the unavailability and scarcity of the open-source datasets for UTI, we were unable to test the proposed DL models using multiple datasets. The current study has proposed an interpretable DL model to enhance the trust and reliability in automated prediction. This tool will assist the health professional in diagnosis.
[1] Gajdács, M., Ábrók, M., Lázár, A., Burián, K. (2021). Urinary tract infections in elderly patients: A 10-year study on their epidemiology and antibiotic resistance based on the WHO Access, Watch, Reserve (AWaRe) classification. Antibiotics, 10(9): 1098. https://doi.org/10.3390/antibiotics10091098M
[2] UTI-WHO-2021. https://www.who.int/gpsc/information_centre/cauda-uti_eccmid.pdf, accessed on Nov. 10, 2021.
[3] Shah, M.A., Kassab, Y.W., Anwar, M.F., et al. (2019). Prevalence and associated factors of urinary tract infections among diabetic patients. Health Science Journal, 13(2): 646. https://doi.org/10.21767/1791-809X.1000646
[4] Zaha, D.C., Jurca, C.M., Daina, L.G., Vesa, C.M., Popa, A.R., Jurca, A.D., Muresan, M., Micle, M. (2020). Prevalence of urinary tract infection and antimicrobial susceptibility among diabetic patients. Farmacia, 68(2): 250-255. https://doi.org/10.31925/farmacia.2020.2.9
[5] Alqudaihi, K.S., Aslam, N., Khan, I.U., et al. (2021). Cough sound detection and diagnosis using artificial intelligence techniques: challenges and opportunities. Ieee Access, 9: 102327-102344. https://doi.org/10.1109/ACCESS.2021.3097559
[6] Khan, I.U., Aslam, N., Anwar, T., Aljameel, S.S., Ullah, M., Khan, R., Rehman, A., Akhtar, N. (2021). Remote diagnosis and triaging model for skin cancer using efficientnet and extreme gradient boosting. Complexity, 2021. https://doi.org/10.1155/2021/5591614
[7] Khan, I.U., Aslam, N. (2020). A deep-learning-based framework for automated diagnosis of COVID-19 using X-ray images. Information, 11(9): 419. https://doi.org/10.3390/info11090419
[8] Alalharith, D.M., Alharthi, H.M., Alghamdi, W.M., et al. (2020). A deep learning-based approach for the detection of early signs of gingivitis in orthodontic patients using faster region-based convolutional neural networks. International Journal of Environmental Research and Public Health, 17(22): 8447. https://doi.org/10.3390/ijerph17228447
[9] Aljameel, S.S., Khan, I.U., Aslam, N., Aljabri, M., Alsulmi, E.S. (2021). Machine learning-based model to predict the disease severity and outcome in COVID-19 patients. Scientific Programming 2021. https://doi.org/10.1155/2021/5587188
[10] Garg, A., Mago, V. (2021). Role of machine learning in medical research: A survey. Computer Science Review, 40: 100370. https://doi.org/10.1016/j.cosrev.2021.100370
[11] Shamshirband, S., Fathi, M., Dehzangi, A., Chronopoulos, A.T., Alinejad-Rokny, H. (2021). A review on deep learning approaches in healthcare systems: Taxonomies, challenges, and open issues. Journal of Biomedical Informatics, 113: 103627. https://doi.org/10.1016/j.jbi.2020.103627
[12] Adadi, A., Berrada, M. (2018). Peeking inside the black-box: a survey on explainable artificial intelligence (XAI). IEEE Access, 6: 52138-52160. https://doi.org/10.1109/ACCESS.2018.2870052
[13] Arrieta, A.B., Díaz-Rodríguez, N., Del Ser, J., et al. (2020). Explainable Artificial Intelligence (XAI): Concepts, taxonomies, opportunities and challenges toward responsible AI. Information Fusion, 58: 82-115. https://doi.org/10.1016/j.inffus.2019.12.012
[14] Tjoa, E., Guan, C. (2020). A survey on explainable artificial intelligence (xai): Toward medical XAI. IEEE Transactions on Neural Networks and Learning Systems, 32(11): 4793-4813. https://doi.org/10.1109/TNNLS.2020.3027314
[15] Heckerling, P.S., Canaris, G.J., Flach, S.D., Tape, T.G., Wigton, R.S., Gerber, B.S. (2007). Predictors of urinary tract infection based on artificial neural networks and genetic algorithms. International Journal of Medical Informatics, 76(4): 289-296. https://doi.org/10.1016/j.ijmedinf.2006.01.005
[16] Rockenschaub, P., Gill, M.J., McNulty, D., Carroll, O., Freemantle, N., Shallcross, L. (2020). Development of risk prediction models to predict urine culture growth for adults with suspected urinary tract infection in the emergency department: protocol for an electronic health record study from a single UK university hospital. Diagnostic and Prognostic Research, 4(1): 1-9. https://doi.org/10.1186/s41512-020-00083-2
[17] Deumić, A., Imamović, E., Ramić, I., Pokvić, L.G., Avdić, M., Jakovac, S., Badnjevic, A., Hukić, M. (2020). Decision support system based on artificial neural network for prediction of antibiotic sensitivity of causative agents of urinary tract infection in certain geographical regions. In European Medical and Biological Engineering Conference, pp. 314-323. https://doi.org/10.1007/978-3-030-64610-3_37
[18] Taylor, R.A., Moore, C.L., Cheung, K.H., Brandt, C. (2018). Predicting urinary tract infections in the emergency department with machine learning. PloS one, 13(3): e0194085. https://doi.org/10.1371/journal.pone.0194085
[19] Gadalla, A.A., Friberg, I.M., Kift-Morgan, A., et al. (2019). Identification of clinical and urine biomarkers for uncomplicated urinary tract infection using machine learning algorithms. Scientific Reports, 9(1): 1-11. https://doi.org/10.1038/s41598-019-55523-x
[20] Burton, R.J., Albur, M., Eberl, M., Cuff, S.M. (2019). Using artificial intelligence to reduce diagnostic workload without compromising detection of urinary tract infections. BMC Medical Informatics and Decision Making, 19(1): 1-11. https://doi.org/10.1186/s12911-019-0878-9
[21] Møller, J.K., Sørensen, M., Hardahl, C. (2021). Prediction of risk of acquiring urinary tract infection during hospital stay based on machine-learning: A retrospective cohort study. PloS One, 16(3): e0248636. https://doi.org/10.1371/journal.pone.0248636
[22] Guyon, I., Elisseeff, A. (2003). An introduction to variable and feature selection. Journal of Machine Learning Research, 3: 1157-1182.