Paulo Escandón-Panchana* | Fernando Morante-Carballo | Gricelda Herrera-Franco | Héctor Rodríguez | Fausto Carvajal
© 2022 IIETA. This article is published by IIETA and is licensed under the CC BY 4.0 license (http://creativecommons.org/licenses/by/4.0/).
OPEN ACCESS
Refineries, fuel depots, airports and storage terminals commonly use fluid level measurement in storage tanks. Different fluid level measurement techniques and devices differ in the inaccuracy of measurement results, costs, and company needs. In addition, these measurements seek reliability of measurement data, immediate response times, control in operations, oil movement, custody transfer and inventory control. The objective is to develop a computer system for measuring fluid levels in oil storage tanks, using ultrasonic and temperature sensors, creating a web application for an automated measurement system (SAM) for managing volumes of Petroleum. The study methodology is i) Analysis of measurement reports. ii) Selection of physical components of the computer system. iii) SAM algorithm design and web application, and iv) Validate the system. The SAM application developed in open source proposes functional modules for administration, control, security, management and monitoring of storage tanks, the status of physical components and generation of dynamic reports in real-time. The results show the control characteristics of storage tanks such as maximum and minimum volume, temperature, time, precise data records in less time than certain current computer structures.
automatic fluid measurement, algorithm, computer system, oil storage tanks
The measurement of fluid levels is of the utmost importance in petroleum activities management, like the production, storage, transportation, and marketing of petroleum [1-3] because it perceives the productivity of an oil field [4, 5]. The current hydrocarbon industry requires technical and precise fluid measurement systems. Therefore, it emphasizes the use of digital methods due to their precision, accuracy [6] and reliability in the measurement of fluids [7, 8].
Oil storage traditionally uses steel tanks [9], concrete platforms [10] and floating roof tanks [11]. Oil storage tank gauging is a fluid gauging that quantifies product volume and mass [12]. The main characteristics of a fluid level measurement system in oil storage tanks are continuous tank monitoring, automatic measurement system and inventory methods [13] to detect leaks, avoid accidents, fluid overflow [14], environmental risks [15, 16] and economic losses [17, 18].
There are different methods of measuring fluids in oil storage tanks, depending on the type of tank, type of fluid and use [19]. The use of liquid measurement methods evolved from the manual measurement system (liquid level indicator as measuring ruler) to automatic measurement systems (sensors) [4]. In addition, there are different special tank measurement systems such as level radars or pressure radars, float gauges, [10], differential pressure-based devices, capacitive sensors, microwave, radiation, displacer, vibratory switches, optical fibre and ultrasonic sensors [20].
The main characteristics of measurement sensors are accuracy and stability, which depend on the detection performance and technique, such as resistive, capacitive [21], inductive, optical and ultrasonic [14]. For example, in an ultrasonic sensor, a transmitted sound pulse is reflected from the fluid surface and received as an echo by the receiver [22]. Sometimes these sensors are applied to oil and gas measurements [23].
Several authors analyzed research on fluid level measurement systems in storage tanks. For example, the study [24] designed a low-cost capacitance sensor for conducting liquids. First, they connected the sensor to the liquid storage tank, where the electrodes form the column of working fluid and the coil. They then measured the change in capacitance by changing the liquid level across the De' Sauty bridge. The sensor application results are acceptable for any fluid level measurement in industrial activity.
In the investigation [4], a comparison of fluid level measurement systems in storage tanks was made, with the methods: liquid level (automatic tank gauge, ATG), static pressure (hydrostatic tank gauging, HTG) and the hybrid method. In addition, he used the supervisory control and data acquisition (SCADA) information system to monitor oil storage in real-time. As a result, he concluded that automatic gauging systems in storage tanks improve work efficiency and provide accurate and reliable data for production activities.
On the other hand, they implemented a human-machine interface (HMI) model for the automated fluid level control system using a programmable logic controller, SCADA and level sensors. This model monitors and controls the storage tank fluid level without float sensors [25].
Nassar and Al-Hajri [26] demonstrated the automatic tank gauging (ATG) system accuracy, using a manual tank gauging still-pipe, the same one that verified the accuracy of the ATG. The results allowed to reduce the movements caused by the assembly of the system, tube and radar.
Kulha's research fabricated conductive electrodes for capacitive sensors. They used interdigital capacitors, reference sensors (recognition of measured fluids), and a measurement software application with an embedded microcontroller. The measurement reading system calculated the electrodes' capacitance proportional to the fluid level (water and oil). The results ensured measurements of condenser charge time as a function of liquid level with low sensitivity, digitally sent to a computerized unit [27].
Zhang et al. [28] carried out a study to calculate the sound pressure of the echo, using the Kirchhoff approximation theory, they found a method to detect the liquid level from the outside of sealed containers. For the simulations, they used the MATLAB application, where they verified the feasibility of the model with acceptable precision results.
Implemented a novel method to control the liquid level in sealed containers by balancing the echo energy received by the sensors. They used a transmitting transducer, two receiving sensors, and measurement simulations performed using MATLAB. They analyzed the propagation and attenuation characteristics of ultrasonic waves in a solid. The results indicated accuracy and efficiency in liquid level measurement.
The oil refining industry is strategic for the world economy; it includes some activities related to processing crude oil, storage in tanks, terminals, and transportation of oil products [29, 30]. Therefore, applications based on fluid level measurement in storage tanks are important, which affects the approach to the following question: How to establish ways to measure liquid level in oil storage tanks through a system computer controlled by a web application, with approximate measurements to reality?
The purpose of the study is to implement a computer system for fluid level measurement in oil storage tanks on a pilot scale through the interconnection of ultrasonic and temperature sensors and a SAM (measurement algorithm) web application. SAM is a web application that allows real-time control and monitoring of fluid level measurement operations in oil storage tanks. It proposes an algorithm that contains the steps that define the measurement process from the reading, through sensors, the synchronization of devices with the minicomputer, the processing and storage of volume history that leads to the control, monitoring and management of measurements. Finally, the validation and verification of the measure in the tanks reports acceptable goodness of fit. In this way, SAM becomes a free and reliable application.
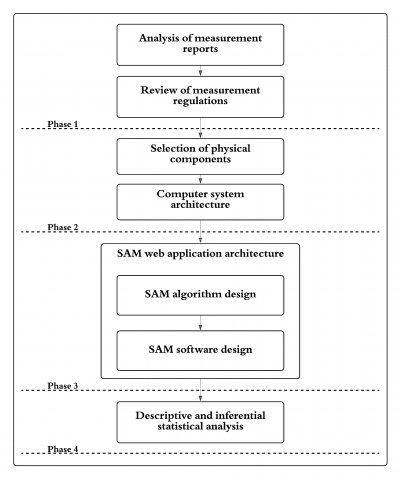
Figure 1 presents a general scheme of the research methodology, based on four fundamental phases: Phase 1: Analysis of measurement data in oil storage tanks. Phase 2: Physical components and architecture selection of computer system for measuring fluid levels. Phase 3: The architecture of the SAM web application consists of the algorithm's design and the web application's design. Phase 4: System Validation.
Figure 1. Methodological scheme of the research
2.1 Analysis of measurement data in oil storage tanks
This study used data from volumetric inspection reports of 3 terminal storage tanks at the La Libertad-Ecuador refinery. It established variables and parameters within the framework of Manual of Petroleum Measurement Standards (MPMS) regulations and the American Petroleum Institute (API), which will allow the fluid level measurement algorithm construction. Furthermore, it determined characteristics of the storage tanks (volume and type of tank), of the sensors (types, signal, temperature) and the users (operator, supervisor, administrator) [4, 26, 31].
Table 1. Volumetric measurement of fluids from storage tanks
|
Compartment |
Tank 1 |
Tank 2 |
Tank 3 |
|
(m3) |
(m3) |
(m3) |
|
|
1 |
0,00195 |
0,0014 |
0,00076 |
|
0,0021 |
0,00149 |
0,00085 |
|
|
0,00257 |
0,00154 |
0,00141 |
|
|
2 |
0,01814 |
0,01113 |
0,01125 |
|
0,01861 |
0,01123 |
0,01135 |
|
|
0,01893 |
0,01132 |
0,01144 |
|
|
3 |
0,03702 |
0,02254 |
0,02285 |
|
0,03812 |
0,02264 |
0,02294 |
|
|
0,03827 |
0,02273 |
0,02303 |
|
|
4 |
0,05555 |
0,03404 |
0,03384 |
|
0,05602 |
0,03413 |
0,03394 |
|
|
0,05618 |
0,03423 |
0,03403 |
Table 1 presents a sample of three measurements (closest approximation) of different fluid levels in each compartment of the storage tanks, at a scale of 1:100, with the unit of measurement cubic meters.
2.2 Selection of physical components and architecture of the computer system for measurement of fluid levels
The research raised the computer system by selecting physical devices, a Raspberry Pi computer, ultrasonic sensor (proximity sensor) HCSR04, temperature sensor DS18B20 and the logical component of the SAM web application.
Figure 2 presents a graphic scheme of the computer system architecture with each device. The sensor sends the voltage signals to the Raspberry, which receives these signals as inputs through the general-purpose pins, to process and store the information. At the same time, the web application performs the management, monitoring and storage of measurements.
Figure 2. Computer system architecture
The Raspberry Pi 4 computer, model B, 8 GB of RAM, USB3 connection, 4-core processor, gigabit ethernet, Wi-Fi and Bluetooth 5.0, 40-pin GPIO connector [32], generated the necessary control signals for the measurement system [33]. Performed the processing and storage of information, control and monitoring of the measurement of fluids in tanks through the SAM web application. In addition, the computer-facilitated the connection with the proximity and temperature sensors through the general-purpose input and output (GPIO) pins [34].
The HCSR04 sensor was used for its great precision, reaching 3 mm. It is an ultrasonic proximity sensor (an approximation range of 0.02 to 4 meters without contact) [35]. That allows measuring the storage tank fluid level using the proximity from the sensor to the surface of the liquid [36-38].
Another device used was the DS18B20 sensor, which measures temperature with an accuracy of ±0.5°C [39] and checks for temperature variation in the ultrasonic sensor measurement reading, improving the accuracy of ultrasonic distance measurement [40, 41].
Finally, the logical component of the computer system proposes the SAM web application, which performs the control and monitoring of the storage tank.
2.3 Algorithm design
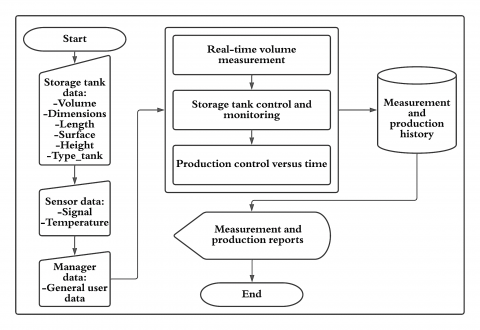
The algorithm design considered the variables of the measurement data analysis for the elaboration of the SAM algorithm. Figure 3 presents the structure of the algorithm, identifying the following phases: i) Data entry, storage tanks (type of tank, volume, dimensions, surface area, height), sensor (signal and temperature) and managers (operator, supervisor and administrator); ii) Storage tank measurement, control and monitoring processes, production control; iii) Databases generated by the measurement history and iv) Measurement results of fluid levels in the tank (measurement and production reports).
Figure 3. SAM algorithm
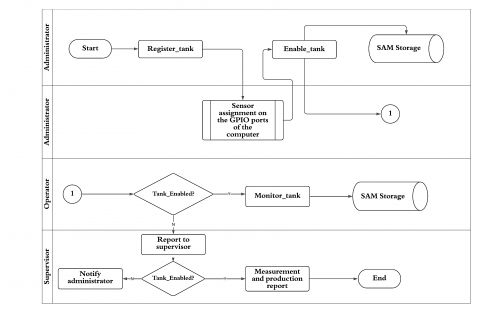
The primary process of the SAM algorithm is the control and monitoring of tanks. Users manage this process according to their functional role (i.e. operator, supervisor and administrator) to avoid alteration of measurement data. Figure 4 shows the process diagram of the control and monitoring of the storage tank determined by the following workflow: 1) Process registers _tanque: registration of storage tanks carried out only by the user with the administrator role. 2) Assign sensors in the GPIO ports of the Raspberry Pi computer. 3) Enable_tank process: once the tank is registered, the administrator user is in charge of enabling the tank. 4) Tank control through the tank_enabled condition: the functional role of the operator user is to monitor the storage tank through the SAM application. For this process to occur, the admin user enables the tank. Therefore, the operator user performs the tank monitoring process; otherwise, he reports the news to the supervisor. The latter verifies the authorisation of the tank before the report and storage of the measurements; if there is no authorised tank, the supervisor notifies the administrator, avoiding the alteration in the measure. 5) Storage of records and operations in SAM.
Figure 4. Diagram of tank control and monitoring processes
2.4 SAM web application design
The custom development of the SAM web application used the Python programming language, with a MariaDB database manager, both open-source programs [42]. Python allowed the development of a friendly application with a graphical user interface (GUI), with execution libraries such as bootstrap, data tables, jquery moment [32, 43]. Furthermore, python is a language compatible with the Raspberry Pi 4 computer; it allows internet connections through the ethernet port, Wi-Fi or Bluetooth [44, 45].
2.5 SAM validation
The validation compared the actual measurements of the oil company reports versus the SAM measurements using the percentage of average absolute relative error (%AARE), an indicator of measurement quality [7, 46].
$\%$ AARE $=\frac{\text { actual measurements }-\text { SAM measurements }}{\text { actual measurements }} * 100$ (1)
The lower error rates allowed a better understanding of the relationship between the actual and SAM measurements. Furthermore, the determination coefficient checked measurement results at 95% significance and demonstrated the measurement algorithm confidence level [47, 48].
3.1 SAM web application modules
The SAM web application development relates to the algorithms methodologies proposed by Apsari, Sam and Noori [7, 49, 50]. Figure 5 shows the SAM platform interface, developed in the Python programming language. The algorithm obtained a management and monitoring tool for fluid level measurement in storage tanks composed of 6 functional modules that allowed obtaining the following windows: 1) Management and supervision process. 2) Security levels, activity log of storage tanks and users. 3) Management of storage tanks. 4) Tank monitoring, which monitors the fluid level measurement process. 5) Sensor management and monitoring (ultrasonic and temperature). 6) Software reports, list of tanks with respective measurements, and production processes about time.
Figure 5. SAM platform. (a) Main process management and supervision window; (b) Window security levels; (c) Storage tank management window; (d) Storage tank monitoring window; (e) SAM reports (metering) and (f) SAM reports (production)
3.2 Actual measurements versus SAM measurements
Table 2 compares the actual volumetric measurements of the storage tanks and measurements reported by the SAM application. The results report measurements grouped by tanks' different compartments at different depths (1 ft, 10 ft, 20 ft and 30 ft, respectively). The measurement process considered the temperature of the measurements necessary because the fluid can expand or contract concerning temperature. Therefore, the average temperature of the measures is 15.56℃ in a range of 15.34℃ to 15.86℃.
Table 2. Actual volumetric measurements versus SAM measurements
|
Compartment and depth |
Tank 11 |
Tank 2 |
Tank 3 |
|||
|
(ft) |
(m3) |
(m3) |
(m3) |
|||
|
Actual measurement |
SAM measurement |
Actual measurement |
SAM measurement |
Actual measurement |
SAM measurement |
|
|
1 (1) |
0,00195 |
0,00195 |
0,0014 |
0,00137 |
0,00076 |
0,00071 |
|
0,0021 |
0,0021 |
0,00149 |
0,00149 |
0,00085 |
0,0008 |
|
|
0,00257 |
0,00255 |
0,00154 |
0,00153 |
0,00141 |
0,0014 |
|
|
2 (10) |
0,01814 |
0,0181 |
0,01113 |
0,0111 |
0,01125 |
0,01121 |
|
0,01861 |
0,0186 |
0,01123 |
0,01121 |
0,01135 |
0,01131 |
|
|
0,01893 |
0,0189 |
0,01132 |
0,0113 |
0,01144 |
0,01141 |
|
|
3 (20) |
0,03702 |
0,03701 |
0,02254 |
0,02251 |
0,02285 |
0,02284 |
|
0,03812 |
0,03811 |
0,02264 |
0,02261 |
0,02294 |
0,02291 |
|
|
0,03827 |
0,03825 |
0,02273 |
0,02271 |
0,02303 |
0,023 |
|
|
4 (30) |
0,05555 |
0,0555 |
0,03404 |
0,03401 |
0,03384 |
0,0338 |
|
0,05602 |
0,056 |
0,03413 |
0,0341 |
0,03394 |
0,0339 |
|
|
0,05618 |
0,05615 |
0,03423 |
0,03421 |
0,03403 |
0,034 |
|
|
%AARE |
0,63 |
0,9 |
1,35 |
|||
1 The volumetric scale of storage tanks 1:100.
Table 3. Determination coefficients of volumetric measurements
|
Compartment |
Coefficient of determination |
||
|
R2 |
|||
|
Tank 1 |
Tank 2 |
Tank 3 |
|
|
1 |
0,9956 |
0,9916 |
0,9945 |
|
2 |
0,9984 |
0,9961 |
0,9959 |
|
3 |
0,9978 |
0,9963 |
0,9927 |
|
4 |
0,9978 |
0,9946 |
0,9998 |
|
Average R2 |
0,9959 |
||
The analysis used a sample of 3 measurements out of 12 per compartment, selecting the closest to reality. Therefore, the %AARE related actual sizes and SAM measurements of each tank. Hence, being 0.96, the average %AARE of the three storage tanks.
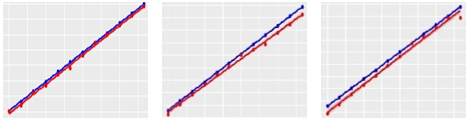
The actual comparison and approximate measurements by SAM reflect linear regressions, with average goodness of fit of 0,9959; as shown in Table 3.
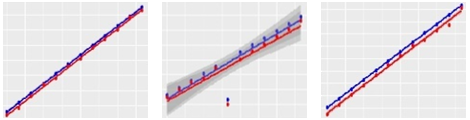
Table 4 presents the comparisons between measurements of each storage tank compartments at 1 ft, 10 ft, 30 ft and 40 ft, respectively. Real linear model (blue colour) versus proposed linear model (red colour). It obtained results very reality, justified by the %AARE of 0.96 and the goodness of models fit.
Statistical parameters confirm the proximity between actual and SAM measurements, which implies reliability in the proposed method. For this reason, the technique found some advantages in controlling and monitoring tanks according to the architecture of the computer system (Table 5).
3.3 SAM validation
The measurements at the scale of the SAM application report results that are very close to the actual measurements. The regression models present coefficients of determination (R2) greater than 0.99, establishing a solid relationship between these measurements. The measures reported by SAM are evaluated with a significance of 95%, achieving an application with a confidence level greater than 90%. Table 6 presents the statistical parameters that determine the confidence interval, the significance and the confidence level of the SAM application.
The confidence level of the algorithm included the calculation of correlations between actual measurements and SAM measurements. Then, the standard deviation of correlations, and based on this deviation, the analysis of confidence intervals to obtain the confidence level based on the significance level [47, 48].
Table 4. Linear models between real and approximate measurements by SAM
|
Compartment and depth |
Tank 1 |
Tank 2 |
Tank 3 |
|
(ft) |
|||
|
1 (1) |
|||
|
2 (10) |
|||
|
3 (20) |
|||
|
4 (30) |
|
||
Table 5. Advantages of the proposed method
|
Components |
Advantages |
|
Hardware |
Compatible with the SAM algorithm. Helpful in obtaining scale measurements in real-time. It handles large amounts of data processing and storage. |
|
Software |
SAM is an interactive, dynamic and manageable tool. The program is compatible with various operating systems. The program used an open-source programming language. The method is considered automated error analysis. |
|
Computer Staff |
Security levels according to the functional role of the users. Avoid alteration of measurements. |
Table 6. SAM algorithm’s confidence level
|
Statistical parameters |
Values |
|
Significance level |
0,95 |
|
Standard deviation |
0,02363 |
|
Confidence interval |
0,00686 |
|
Confidence level |
98,62% |
The SAM web application proposes a fluid level measurement monitoring and management algorithm to control the volume of oil storage tanks. SAM is interactive, dynamic, storable, manageable, with high levels of security and compatible with various operating systems. Different from distributed systems with complex administration characteristics, limited compatibility and little information security [51]. The application allows the user to enter tank characteristics for any storage tank for oil and its derivatives.
The computer application provides a history of tank measurements (distributed in different compartments), user records, tanks, volume, sensor monitoring, which implies a robust and specific application for an automated measurement system in storage tanks. Other studies used devices like petroleum volume estimator and tracker (PPVET) that automatically measures the volume of any petroleum product [19] and supervisory control and data acquisition (SCADA) system, which monitors and controls the level of storage tanks [25]. SAM applies functionalities of PPVET and SCADA technologies, but it has a multi-platform feature, which allows its installation and application on different devices and web browsers.
The SAM implementation considered fundamental elements of a computer system. The hardware is useful for obtaining scale measurements in real-time, such as the Raspberry Pi minicomputer and HCSR04, DS18B20 sensors, compatible with the proposed tool. Other studies related to management and monitoring fluid tank measurements used the same ultrasonic sensor but compatible microcontrollers like ATMega328 [38] and ATMega16 [52]. It should be noted that the SAM hardware platform is a minicomputer with important features such as GPIO pins, handles large amounts of data processing and storage, internet connection and input and output peripherals, unlike microcontrollers that have low processing capacity. and storage, which do not have an internet connection and input and output peripherals.
The fluid measurements generated by the operation of the proposed computer system are largely approximations to reality. The statistics check the proximity relationship between the real measurements and those reported by SAM. Some studies analyzed the manual measurement error in the fluid measurement system [25, 53], and very few analyzed the errors by automated measurements, as considered in this study.
Other industrial and agricultural activities evaluated the automatic fluid level control and monitoring system, with approximate measurements justified by determination coefficients [36]. For example, comparing empirical and real measurements of oil flow rates reported R2 from 0.70 to 0.72 with error percentages of 2 to 3% in their measurements [5]. Alternatively, comparing temperature measurements in palm oil storage tanks reflected R2 of 0.99 [54]. Also, the water storage tank system detected an R2 of 0.97 when comparing measurements from different sensors [52]. Therefore, the regression models of this study determine the precision of the measurements proposed by SAM compared to the real measurements with R2 above 0.99.
Proper measurement improves the accuracy and precision of fluid measurement and optimizes the measurement control and management process [55]. The API regulation raises its attention in measurement equipment. However, it does not determine preferences for technologies [31]. The SAM architecture proposes a contribution to the measurement process through a computerized technological tool, with error percentages of less than 1%.
Some studies have shown that the manual measurement uncertainty has a growing trend that implies economic losses for the oil system [2, 56]; this means that the proposed system is considered a possible replacement for manual measurement and a new alternative to automated systems.
SAM is a web application developed in the Python programming language through an algorithm for controlling and managing oil storage tanks, which determines the measurement of fluid levels for volume management. The architecture of the computer system is compatible with the web application, which allows SAM to approximate real measurements with a confidence level of over 90% in storage tanks for oil and its derivatives. In addition, SAM has a database capable of storing information in large volumes generating a measurements detailed history.
The AARE percentage between the actual measurements and SAM is less than 1%, which presents adjustments that are very close to reality for automated measurement systems in oil storage tanks and alternatives for expansion and application to a range of fluids in the industry sector. Furthermore, the SAM algorithm allows the entry of different characteristics of storage tanks, sensors, and users, which implies an ideal and adaptable computer tool for controlling, monitoring, managing, synchronising, and securing oil volume measurement data.
As a recommendation, the SAM system requires technological devices with state-of-the-art processing speed and information transmission that are compatible with the mini-processor quality to ensure immediacy and minimum error.
The authors thank the Faculty of Engineering Sciences of the Santa Elena Peninsula University (UPSE, acronym in Spanish) and the La Libertad Refinery - EP Petroecuador for their support.
|
AARE |
average absolute relative error |
|
API |
American petroleum institute |
|
ATG |
automatic tank gauge |
|
ft |
feet |
|
GPIO |
general purpose input and output pins |
|
GUI |
graphical user interface |
|
HMI |
man-machine interface |
|
HTG |
hydrostatic tank gauging |
|
MPMS |
manual of petroleum measurement standards |
|
m3 |
cubic meters |
|
PPVET |
oil volume estimator and tracker |
|
R2 |
coefficient of determination |
|
SAM |
automated measurement system |
|
SCADA |
supervisory control system and data acquisition |
[1] Dupuis, E., Hwang, G. (2010). Custody transfer: Flowmeter as cash register: When bulk liquid or gas products change hands, everyone has to agree on the quantity and the product quality. This puts very special demands on instrumentation. Control Engineering, 28-32.
[2] Smart, D. (2015). Well pad production storage management. The SPE/AAPG/SEG Unconventional Resources Technology Conference, San Antonio, Texas, USA. https://doi.org/10.15530/URTEC-2015-2173528
[3] Al Omari, A., Herzalla, O., Toubar, A., Almalood, N., Al Hammadi, H. (2019). Floating roof storage tanks life extension: A novel risk revealed. In Abu Dhabi International Petroleum Exhibition & Conference. https://doi.org/10.2118/197387-MS
[4] Wei, S. (2018). Analysis of automatic metering for oil storage tank. In IOP Conference Series: Materials Science and Engineering, 452(2): 022049. https://doi.org/10.1088/1757-899x/452/2/022049
[5] Faraj, Y., Wang, M., Jia, J., Wang, Q., Xie, C.G., Oddie, G., Primrose, K., Qiu, C. (2015). Measurement of vertical oil-in-water two-phase flow using dual-modality ERT–EMF system. Flow Measurement and Instrumentation, 46: 255-261. https://doi.org/10.1016/j.flowmeasinst.2015.08.010
[6] Mohamed, N.M. (2021). Dual displacer-gamma ray system for level measurement of fluids-interface in oil separator. Radiation Physics and Chemistry, 184: 109453. https://doi.org/10.1016/j.radphyschem.2021.109453
[7] Apsari, N.F., Megantoro, P., Sattar, M.U., Maseleno, A., Tanane, O. (2020). Design of laboratory scale fluid level measurement device based on Arduino. Journal of Robotics and Control (JRC), 1(5): 145-149. https://doi.org/10.18196/jrc.1530
[8] Li, S., Zhang, F., Jiang, S., Shang, Y., Wang, C., Ni, J. (2021). Fluid velocity monitoring in oil well using fiber laser vibration sensing. Optical Fiber Technology, 65: 102617. https://doi.org/10.1016/j.yofte.2021.102617
[9] Lewis, P.R. (2016). Forensic Polymer Engineering: Why polymer products fail in service. Woodhead Publishing. pp. 111-146. https://doi.org/10.1016/b978-0-08-101055-6.00004-5
[10] Devold, H. (2013). Oil and Gas Production Handbook: An Introduction to Oil and Gas Production, Transport, Refining and Petrochemical Industry. ABB Oil and Gas.
[11] Li, W., Shao, Q., Liang, J. (2019). Numerical study on oil temperature field during long storage in large floating roof tank. International Journal of Heat and Mass Transfer, 130: 175-186. https://doi.org/10.1016/j.ijheatmasstransfer.2018.10.024
[12] Emerson. (2021). La guía del ingeniero para la medición de tanques.
[13] Sacile, R. (2007). Remote real-time monitoring and control of contamination in underground storage tank systems of petrol products. Journal of Cleaner Production, 15(13-14): 1295-1301. https://doi.org/10.1016/j.jclepro.2006.07.012
[14] Singh, Y., Raghuwanshi, S.K., Kumar, S. (2019). Review on liquid-level measurement and level transmitter using conventional and optical techniques. IETE Technical Review, 36(4): 329-340. https://doi.org/10.1080/02564602.2018.1471364
[15] Kang, J., Liang, W., Zhang, L., Lu, Z., Liu, D., Yin, W., Zhang, G. (2014). A new risk evaluation method for oil storage tank zones based on the theory of two types of hazards. Journal of Loss Prevention in the Process Industries, 29: 267-276. https://doi.org/10.1016/j.jlp.2014.03.007
[16] Duan, J., Liu, H., Xu, S., Li, J., Shen, T., Lin, K., Yan, H. (2021). Numerical modelling for leak oil flow in tunnel of the cave storage. Petroleum, 7(3): 335-342. https://doi.org/10.1016/j.petlm.2020.10.005
[17] Al-Mithin, A.W., Sardesai, V., Al-Harbi, B., Hannan, A.S.A. (2012). Risk based inspection (RBI) of aboveground storage tanks to improve asset integrity. In IPTC 2012: International Petroleum Technology Conference, Bangkok, Thailand. https://doi.org/10.3997/2214-4609-pdb.280.iptc14434_noPW
[18] Farhan, M.M., Al-Jumialy, M.M., Al-Muhammadi, A.D., Ismail, A.S. (2017). Development of a new method for reducing the loss of light hydrocarbons at breather valve of oil tanks. Energy Procedia, 141: 471-478. https://doi.org/10.1016/j.egypro.2017.11.061
[19] Ejofodomi, T., Ofualagba, G. (2020). Automated volume measurement, adulteration detection, and tracking of petroleum products. SPE-203694-MS.
[20] Meribout, M., Al Naamany, A., Al Busaidi, K., Vizureanu, P. (2011). Interface layers detection in oil field tanks: A critical review. In Expert Systems for Human, Materials and Automation (No. 10). IntechOpen.
[21] Abdallah, A., Pauritsch, M., Gasser, C., Stangl, F., Primas, M., Traussnigg, U. (2018). 3D printed capacitive fluid level sensor. In Multidisciplinary Digital Publishing Institute Proceedings, 2(13): 861. https://doi.org/10.3390/proceedings2130861
[22] Milligan, W.J., Muir, D.I., Harrison, D.K. (2013). Oil level measurement in oil-injected screw compressor packages used in the petroleum, petrochemical, refrigeration and fuel gas markets. In Institution of Mechanical Engineers - 8th International Conference on Compressors and Their Systems, pp. 77-85. https://doi.org/10.1533/9781782421702.2.77
[23] Shi, X., Tan, C., Dong, F., Escudero, J. (2022). Flow rate measurement of oil-gas-water wavy flow through a combined electrical and ultrasonic sensor. Chemical Engineering Journal, 427: 131982. https://doi.org/10.1016/j.cej.2021.131982
[24] Bera, S.C., Ray, J.K., Chattopadhyay, S. (2006). A low-cost noncontact capacitance-type level transducer for a conducting liquid. IEEE Transactions on Instrumentation and Measurement, 55(3): 778-786. https://doi.org/10.1109/tim.2006.873785
[25] Das, R., Dutta, S., Sarkar, A., Samanta, K. (2013). Automation of tank level using PLC and establishment of HMI by Scada. IOSR Journal of Electrical and Electronics Engineering (IOSR-JEEE), 7(2): 61-67.
[26] Nassar, R.H., Al-Hajri, A.R. (2013). Field experience with still pipes installation and supporting in KOC storage tanks. In SPE Middle East Oil and Gas Show and Conference. OnePetro. https://doi.org/10.2118/164155-MS
[27] Kulha, P., Hilber, W., Laposa, A., Jakoby, B. (2018). Screen printed and laminated electrodes for low-cost capacitive level measurement systems. Journal of Electrical Engineering, 69(2): 177. https://doi.org/10.2478/jee-2018-0022
[28] Zhang, B., Song, W.A., Wei, Y.J., Zhang, D.S., Liu, W.Y. (2017). A study on the model of detecting the liquid level of sealed containers based on Kirchhoff approximation theory. Sensors, 17(6): 1394. https://doi.org/10.3390/s17061394
[29] Granados-Hernández, E., López-Andrade, X., Bravo-Álvarez, H., Sosa-Echeverría, R. (2013). Refinación de petróleo y su impacto económico-tecnológico para la producción de gasolinas en México al 2030. Ingeniería, Investigación y Tecnología, 14(4): 475-487.
[30] Romo, D. (2016). Refinación de petróleo en México y perspectiva de la reforma energética. Problemas del desarrollo, 47(187): 139-164. https://doi.org/10.1016/j.rpd.2016.10.005
[31] Energy API. (2021). Petroleum Measurement. [Online]. Available: https://www.api.org/standards.
[32] Casado, P., Blanes, J.M., Torres, C., Orts, C., Marroquí, D., Garrigós, A. (2022). Raspberry Pi based photovoltaic IV curve tracer. HardwareX, e00262. https://doi.org/10.1016/j.ohx.2022.e00262
[33] Kirby, J., Chapman, L., Chapman, V. (2018). Assessing the Raspberry Pi as a low-cost alternative for acquisition of near infrared hemispherical digital imagery. Agricultural and Forest Meteorology, 259: 232-239. https://doi.org/10.1016/j.agrformet.2018.05.004
[34] Bermúdez-Ortega, J., Besada-Portas, E., López-Orozco, J.A., Bonache-Seco, J.A., De la Cruz, J.M. (2015). Remote web-based control laboratory for mobile devices based on EJsS, Raspberry Pi and Node.js. IFAC-PapersOnLine, 48(29): 158-163. https://doi.org/10.1016/j.ifacol.2015.11.230
[35] Olisa, S.C., Asiegbu, C.N., Olisa, J.E., Ekengwu, B.O., Shittu, A.A., Eze, M.C. (2021). Smart two-tank water quality and level detection system via IoT. Heliyon, 7(8): e07651. https://doi.org/10.1016/j.heliyon.2021.e07651
[36] Fisher, D.K., Sui, R. (2013). An inexpensive open-source ultrasonic sensing system for monitoring liquid levels. Agricultural Engineering International: CIGR Journal, 15(4): 328-334. http://www.cigrjournal.org.
[37] Alobaidi, W.M., Alkuam, E.A., Al-Rizzo, H.M., Sandgren, E. (2015). Applications of ultrasonic techniques in oil and gas pipeline industries: A review. American Journal of Operations Research, 5(4): 274-287. https://doi.org/10.4236/ajor.2015.54021
[38] Hidayat, M.R., Sambasri, S., Fitriansyah, F., Charisma, A., Iskandar, H.R. (2019). Soft water tank level monitoring system using ultrasonic HC-SR04 sensor based on ATMega 328 microcontroller. In 2019 IEEE 5th International Conference on Wireless and Telematics (ICWT), Yogyakarta, Indonesia, pp. 1-4. https://doi.org/10.1109/ICWT47785.2019.8978229
[39] Cheng, X., Yan, X., Grantz, D.A., Xiang, Y., de Oliveira, R.F., Huang, L., Wang, Z.G., Du, T.S., Cheng, Q. (2021). In-situ and non-invasive measurement of stem water content of trees using an innovative interdigitated-electrodes dielectric sensor less susceptible to stem diameter variation. Agricultural and Forest Meteorology, 307: 108473. https://doi.org/10.1016/j.agrformet.2021.108473
[40] Jin, G.Z., Cong, L.L., Wang, H., He, M., Li, J.L., Piao, X.F., Zhu, W.H., Li, D.H., Li, D.H. (2014). A simple and rapid analysis for gas-phase polycyclic aromatic hydrocarbons using an organic-solvent-based method. Atmospheric Environment, 89: 367-372. https://doi.org/10.1016/j.atmosenv.2014.01.022
[41] Hashmi, A., Kalashnikov, A.N. (2019). Sensor data fusion for responsive high resolution ultrasonic temperature measurement using piezoelectric transducers. Ultrasonics, 99: 105969. https://doi.org/10.1016/j.ultras.2019.105969
[42] Mudaliar, M.D., Sivakumar, N. (2020). IoT based real time energy monitoring system using Raspberry Pi. Internet of Things, 12: 100292. https://doi.org/10.1016/j.iot.2020.100292
[43] Bills, M.V., Loh, A., Sosnowski, K., Nguyen, B.T., Ha, S.Y., Yim, U.H., Yoon, J.Y. (2020). Handheld UV fluorescence spectrophotometer device for the classification and analysis of petroleum oil samples. Biosensors and Bioelectronics, 159: 112193. https://doi.org/10.1016/j.bios.2020.112193
[44] Jaskolka, K., Seiler, J., Beyer, F., Kaup, A. (2019). A Python-based laboratory course for image and video signal processing on embedded systems. Heliyon, 5(10): e02560. https://doi.org/10.1016/j.heliyon.2019.e02560
[45] Jabbar, W.A., Wei, C.W., Azmi, N.A.A.M., Haironnazli, N.A. (2021). An IoT Raspberry Pi-based parking management system for smart campus. Internet of Things, 14: 100387. https://doi.org/10.1016/j.iot.2021.100387
[46] Sithole, B., Rimer, S., Ouahada, K., Mikeka, C., Pinifolo, J. (2016). Smart water leakage detection and metering device. In 2016 IST-Africa Week Conference, Durban, South Africa, pp. 1-9. https://doi.org/10.1109/ISTAFRICA.2016.7530612
[47] Zhang, K., Chen, H., Yang, Z., Duan, Y. (2020). Experimental PVT property for the liquid HFO1234ze (E) using the isochoric method. The Journal of Chemical Thermodynamics, 149: 106160. https://doi.org/10.1016/j.jct.2020.106160
[48] Escandón-Panchana, P., Morante-Carballo, F., Herrera-Franco, G., Pineda, E., Yagual, J. (2021). Computer Application to estimate PVT conditions in oil wells in the Ecuadorian amazon. Mathematical Modelling of Engineering Problems, 8(5): 727-738. https://doi.org/10.18280/mmep.080507
[49] Sam, G., Kaestenbauer, M., Burgstaller, C., Chevelcha, E. (2011). Fully automated fluid level measurement tool. the SPE Asia Pacific Oil and Gas Conference and Exhibition, Jakarta, Indonesia, Paper Number: SPE-145434-MS. https://doi.org/10.2118/145434-MS
[50] Noori, N.S., Waag, T.I., Viumdal, H., Sharma, R., Jondahl, M.H., Jinasena, A. (2020). Non-Newtonian fluid flow measurement in open venturi channel using shallow neural network time series and non-contact level measurement radar sensors. In SPE Norway Subsurface Conference. OnePetro, pp. 1-11. https://doi.org/10.2118/200741-MS
[51] Plaza, A., Granado, E., Torre, M. (2005). Diseño conceptual de un sistema SCADA basado en software de código abierto. Jornadas de Sistemas de Automatización y Control, Caracas, Venezuela, 100-105.
[52] Jeswin, C.J., Marimuthu, B., Chithra, K. (2017, February). Ultrasonic water level indicator and controller using AVR microcontroller. In 2017 International Conference on Information Communication and Embedded Systems (ICICES), Chennai, India, pp. 1-6. https://doi.org/10.1109/ICICES.2017.8070773
[53] Al Muhairi, M.B., Al Zaabi, M.A. (2012). High precision monitoring of crude oil storage. In Abu Dhabi International Petroleum Conference and Exhibition. OnePetro. https://doi.org/10.2118/161701-MS
[54] Hafiz, M., Renjani, R.A., Haryanto, A., Araswati, N., Subrata, I.D.M. (2016). Design of temperature and volume control system at crude palm oil (CPO) storage tank. Proceedings of the AESAP, Bogor, Indonesia.
[55] Oriji, A.B., Odagme, B.S. (2015). Application of metering process in oil and gas production in Niger delta fields. Ind. J. Sci. Res. and Tech., 3(6): 1-6.
[56] Shunashu, I.L., Casmir, R. (2020). Assessing the impact of measurement uncertainty in custody transfer to the development of oil & gas industry in Tanzania. Business Education Journal (BEJ), 9(1): 1-16.