Faisal Rahman* | Sugiono Sugiono | Achmad As’ad Sonief | Oyong Novareza
© 2022 IIETA. This article is published by IIETA and is licensed under the CC BY 4.0 license (http://creativecommons.org/licenses/by/4.0/).
OPEN ACCESS
Reliability engineering is needed for scheduling maintenance to improve system or equipment performance. The purpose of this paper is to provide recommendations for maintenance schedules based on reliability, availability, and maintainability (RAM) analysis that optimizes the availability of mobile cranes operating in Indonesian oil and gas companies. This paper begins with searching for a critical system using the Pareto principle. The critical system is then made a reliability block diagram to facilitate the analysis. However, before conducting the analysis, it is necessary to know the characteristics of the probability distribution of the data so that the analysis results are accurate and stable. Analysis of reliability, availability, and maintainability (RAM) is then carried out in the probability distribution equation for each system. The analysis results show that the implementation of maintenance at the time of reliability reaches the mean time between failure, and the maximum maintainability time is 240 minutes. The result is an increase in the availability of the lower structure (LS) system by 0.53% (98.78% to 99.31%), electrical and safety equipment (ESE) by 0.19% (99.02% to 99.21%), upper structure (US) was 0.07% (99.32% to 99.39), and overall system availability was 0.07% (99.31% to 99.38%).
mobile crane, oil and gas company, preventive maintenance, reliability engineering
Equipment maintenance aims to repair or maintain equipment in good and acceptable working conditions [1]. There are two types of maintenance based on time, namely corrective maintenance (CM) and preventive maintenance (PM). CM is carried out when equipment is damaged and then repaired. In contrast, PM is carried out before the equipment is damaged to reduce damage and a greater risk of failure [2].
In recent decades, maintenance scheduling through reliability engineering analysis has played an important role in maintaining the system in an operating state [3]. Several recent studies have analyzed reliability, availability, and maintainability (RAM) in various types of industries and equipment, such as the ice cream industry [4], the bag industry [5], in mining with load, haul and dump machines (LHD machine) [6], in the textile process industry on steam boiler equipment [7], on conveyor system equipment [8], on deck objects on fishing vessels [9], plug-in electric vehicles [10], dragline equipment [11], truck unloading [12].
In the previous research literature, it is seen that probability distributions (PD) are included to analyze RAM, such as normal distribution, lognormal distribution, exponential distribution, and Weibull distribution. In addition, several published pieces of literature reveal that previous researchers have continued to investigate RAM-based maintenance scheduling, which is used in various industries and equipment. However, there are very few cases of its application to lifting equipment, especially mobile cranes. Therefore, it is interesting to do RAM research on lifting equipment, especially mobile cranes. The selection of mobile cranes to be studied compared to other lifting equipment is based on the consideration that mobile cranes are lifting equipment that has complex systems and components compared to other lifting equipment such as overhead cranes, gantry cranes, and pedestal cranes. The complexity of the mobile crane can be seen from the working area, which can move from one location to another, and several configurations influence its operation. The configuration effect intended for mobile cranes is divided into three parts which can also be referred to as the main system, namely the lower structure (powertrain, chassis, outrigger, etc.), electrical & safety equipment (lamp, indicators, safety equipment, etc.), and upper structure (counterweight, number of installed part lines, running gear, boom length, boom angle, working radius, lifting position start and end lifting, etc.).
It is also important to note that some previous research was limited to developing and analyzing theoretical models. However, few try to solve it in a realistic environment. Therefore, an academic, practical, and systematic approach is needed to analyze the performance of mobile cranes. In addition, the lack of attention from some previous studies to use optimization techniques.
In this study, researchers will perform availability optimization techniques for mobile cranes. The main reason behind this research is that the optimized availability parameter can be used to modify the maintenance schedule of the existing equipment. As a result of improved maintenance schedules, availability can be optimized. Based on this, through this research, efforts will be made to fill the gaps in research conducted by several previous researchers. The purpose of this study is to provide recommendations for a RAM-based mobile crane maintenance schedule that optimizes availability. As the main contribution, this study proposes a RAM analysis framework by optimizing availability parameters for mobile cranes. The mobile crane that is the object of this research is critical lifting equipment for loading and unloading activities at the Jetty, operated by an Indonesian oil and gas company. The failure of this mobile crane can result in the failure of lifting operations to supply material to cargo ships to be forwarded offshore.
2.1 Principle pareto
A Pareto principle is a useful tool for identifying problems by showing how many times they occur. The frequency with which problems occur is shown in a combination of bar graphs and line graphs. Bar graphs and line graphs are ordered from largest to smallest. Thus, it can be known which problems must be studied and then narrowed down the causes of which problems must be addressed first [13, 14].
2.2 Probability distribution function selection
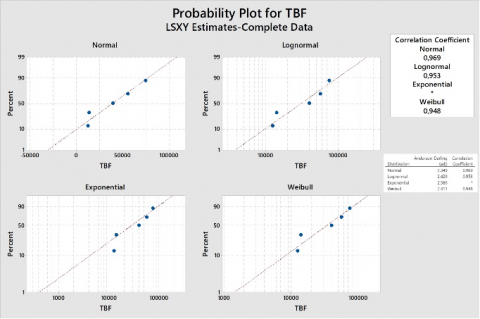
In this study, the probability distribution function (PDF) selection by looking at the probability plot is a linear relationship between the variables x and y. The linear relationship between the variables x and y was assessed by Anderson Darling (AD) and correlation coefficient (CC). The smaller the AD value and the larger the CC value, the better the linear relationship between the two random variables x and y. CC has a value between 0 and +1 which indicates the strength of the linear relationship between the variables x and y. If the CC value is close to a value of 1, it can be said that the time between failure (TBF) or time to failure (TTR) data distribution is very well distributed with this distribution. As an example of a linear relationship between TBF and PD, as shown in Figure 1, the TBF data distribution is normally distributed because it has the smallest AD value of 2.349 and the largest CC value of 0.969. The PD used in this study are the normal distribution, the lognormal distribution, the exponential distribution, and the Weibull distribution.
The normal distribution has parameters Mean (µ) and Standard Deviation (σ). The lognormal distribution has a median repair time parameter (tmed) and a scale parameter (s=α). The exponential distribution has one parameter value, namely failure rate (λ), and the Weibull distribution has shape parameters (β), scale parameter (α), and time factor (t) [15]. The distribution is used to predict equipment failure patterns, which will help determine time intervals for PM.
Figure 1. Probability plot
2.3 Mean time between failure (MTBF) and mean time to repair (MTTR)
MTBF is the average time between failures for a repairable component/system, while MTTF is the expected failure time for a non-repairable system/component. MTTR is the average time for repairing the system/component of the machine. The calculation of MTBF and MTTR for the normal distribution uses Eq. (1), and the lognormal distribution uses Eq. (2), the exponential distribution uses Eq. (3), and Weibull uses Eq. (4) [13, 16].
The Weibull distribution is a lifetime distribution widely used in reliability engineering and maintenance. The Weibull distribution helps represent many different phenomena or physical forms. It depends on the shape parameter's value; function failure rate can be decreased, constant, or increased. Therefore, the Weibull distribution can model the failure behavior of some real-life systems [15]. The Weibull distribution has scale parameters (α) and shape parameters (β) as well as a gamma function (Γ). This study used the help of Minitab 18 software to get the value of the scale parameters (α) and shape parameters (β) in the Weibull distribution. Then, the gamma function (Γ(x)) value was from the gamma function table (Γ(x)).
$M T B F / M T T R=\mu$ (1)
$M T B F / M T T R=t_{m e d} e^{\left(\frac{s^{2}}{2}\right)}$ (2)
$M T B F / M T T R=\frac{1}{\lambda}$ (3)
$M T B F / M T T R=\alpha \cdot \Gamma\left(1+\frac{1}{\beta}\right)$ (4)
2.4 Reliability, maintainability and availability
2.4.1 Reliability
Reliability is an assessment of the probability for a certain time and conditions for the equipment to perform its required function without failure [3, 17]. If the reliability of the equipment or system cannot be maintained properly, it will experience operational failure and result in considerable losses. Of course, this failure needs to be avoided, especially for critical equipment.
Each piece of equipment has reliability characteristics. These characteristics will determine the operating conditions. This study estimated the reliability characteristics using the distribution selected through the PDF test. The following distribution equations will be used in this study: the normal distribution using Eq. (5), the lognormal distribution using Eq. (6), the exponential distribution using Eq. (7), and the Weibull distribution using Eq. (8) [18, 19].
$R(t)=1-\Phi\left(\frac{t-\mu}{\sigma}\right)$ (5)
$R(t)=1-\Phi\left(\frac{1}{s} \ln \frac{t}{t_{m e d}}\right)$ (6)
$R(t)=e^{-\lambda t}$ (7)
$R(t)=e^{-\left(\frac{t}{\alpha}\right)^{\beta}}$ (8)
Reliability analysis of complex systems a logical approach in reliability analysis is to apply a systems approach with a reliability block diagram (RBD). RBD can be connected in series, parallel and combined series-parallel [16, 20]. Analysis of RBD connected in series (Rs) using Eq. (9) and connected in parallel (Rps) using Eq. (10) [21].
$R_{s}(t)=R_{1} \times R_{2} \times R_{3} \times R_{n} \leq \min \left\{R_{1}, R_{2}, R_{3}, R_{n}\right\}$ (9)
$R_{p s}(t)=1-\left(1-R_{1}\right) \times\left(1-R_{2}\right) \times\left(1-R_{3}\right) \times(1\left.-R_{n}\right) \leq \min \left\{R_{1}, R_{2}, R_{3}, R_{n}\right\}$ (10)
2.4.2 Maintainability
Maintainability is the maintenance of equipment expressed in terms of its probability of maintaining the equipment to a working condition after being repaired within a certain time interval [3, 22]. In this study, the calculation of the maintainability of the mobile crane system follows the PD. Data analysis is normally distributed using Eq. (11), lognormal distribution using Eq. (12), exponential distribution using Eq. (13), and Weibull distribution using Eq. (14).
$M(t)=\phi\left(\frac{t-\mu}{\sigma}\right)$ (11)
$M(t)=\Phi\left(\frac{1}{\alpha} \ln \frac{t}{t_{m e d}}\right)$ (12)
$M(t)=1-e^{\left(-\frac{t}{M T T R}\right)}$ (13)
$M(t)=1-e^{\left(-\frac{t}{\alpha}\right)^{\beta}}$ (14)
2.4.3 Availability
Availability is the possibility of the equipment being ready to operate when needed at a certain time by taking into account uptime and downtime. Uptime is the total time the equipment is in reliable condition. Uptime consists of operating time, standby time, and other waiting times. Uptime is closely related to the MTBF and reliability. On the other hand, downtime is the total time the equipment is in failure/unreliable condition. Downtime is related to MTTR and maintainability. To optimization equipment availability, it is necessary to consider the PD of failure and the PD of repair. It calculates the availability of the system using Eq. (15) [23].
$A=\frac{M T B F}{M T B F+M T T R}=\frac{\text { uptime }}{\text { uptime }+\text { downtime }}$ (15)
3.1 Research design and stages
The methodology section begins by collecting data on the main system configurations that affect the effectiveness of mobile crane performance. Then, perform the analysis to rank critical systems and assess the current availability performance of the mobile crane. Next, analyze the characteristics of RAM based on damage data using several PDs such as the Weibull distribution, exponential, lognormal, and normal with the help of Minitab 18 software. The selected RAM characteristics of the PD have been determined by referring to the least square method with the lowest AD value and the highest CC. Thus, RAM analysis is a helpful tool or method and helps in deciding the right maintenance strategy. The results & discussion section presents MTBF & MTTR calculations, reliability analysis, maintainability analysis, availability analysis, and performance evaluation of mobile cranes. Finally, the conclusion presents conclusions about optimizing the availability of mobile cranes using the reliability engineering method.
3.2 Data collection
General data and mobile crane technique as the object of this research is a mobile crane with the Sany brand with unit number A9. The maximum lifting capacity of the mobile crane is eighty tons operating for oil and gas companies in Indonesia. The main system configurations of mobile cranes are grouped into three, consisting of the lower structure (LS), electrical & safety equipment (ESE), and the upper structure (US). The object of research is a mobile crane, as shown in Figure 2.
Figure 2. Mobile crane
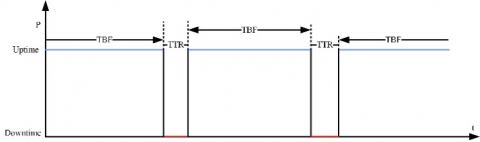
The mobile crane's main system configuration's operational performance is expressed using the TBF and TTF data. Historical TTR and TBF data were collected from January 2019 to June 2021 in minutes. TBF is the duration of the mobile crane in an uptime state before entering a failed state. In contrast, TTR is the duration of the mobile crane in a downtime state before returning to an uptime state [24, 25]. TBF and TTR data for the mobile crane system are shown in Table 1 and illustrated in Figure 3.
Figure 3. Illustration of TBF and TTR mobile crane
Table 1. Mobile crane system TBF and TTR data
|
LS |
ESE |
US |
|||
|
TBF |
TTR |
TBF |
TTR |
TBF |
TTR |
|
8250 |
53625 |
3000 |
|||
|
15750 |
375 |
2125 |
125 |
8715 |
285 |
|
11250 |
375 |
13950 |
300 |
60500 |
250 |
|
44370 |
255 |
23385 |
240 |
2340 |
285 |
|
25320 |
180 |
43305 |
195 |
26785 |
215 |
|
2685 |
315 |
45900 |
225 |
78435 |
315 |
|
26685 |
315 |
1200 |
300 |
36870 |
255 |
|
3060 |
315 |
28560 |
315 |
32700 |
300 |
|
55620 |
255 |
28620 |
255 |
37425 |
75 |
|
12375 |
375 |
3180 |
195 |
48090 |
285 |
|
74325 |
300 |
51870 |
255 |
||
|
39375 |
750 |
38625 |
375 |
||
|
13875 |
375 |
||||
Based on TBF and TTR data, an assessment of the current availability of mobile cranes is carried out using the general RAM equation, namely the exponential distribution. The results of the current availability performance assessment are as shown in Table 2. The LS availability value is 98.73%, the ESE availability value is 99.02%, the US availability value is 99.32%, and the system availability value is 99.31%.
Table 2. Performance assessment of the current availability of mobile cranes
|
System |
MTBF |
MTTR |
A |
A System |
|
LS |
27057.50 |
348.75 |
98.73% |
99.31% |
|
ESE |
25520.00 |
252.73 |
99.02% |
|
|
US |
36873.33 |
251.67 |
99.32% |
3.3 Data analysis
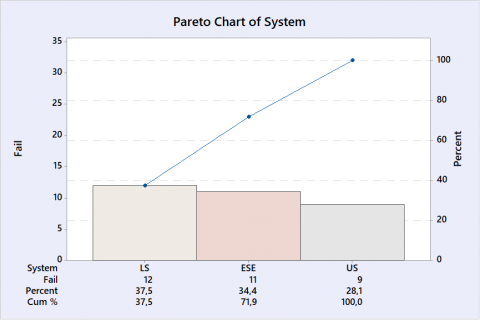
Data analysis starts from finding critical systems using Pareto principles based on failure frequency data. The high frequency of critical system failures will affect the overall performance of the equipment. In this study, a system that failed three or more times would be designated a critical system. The results of the Pareto principle analysis in Figure 4 show that the most frequent failures occurred in LS 12 times with a percentage of 37.5%, followed by ESE 11 times with a percentage of 34.4% and US 9 times with a percentage of 28.1%. Because all systems failed more than three times during the study period, it can be stated that all mobile crane systems are critical systems. Furthermore, the critical system is made RBD facilitate the analysis of RAM. The critical system RBD is shown in Figure 5.
Figure 4. Mobile crane critical system analysis
Figure 5. Mobile crane critical system RBD
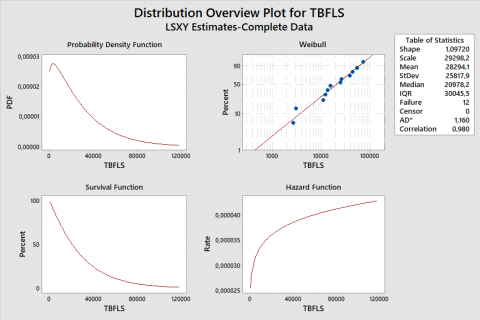
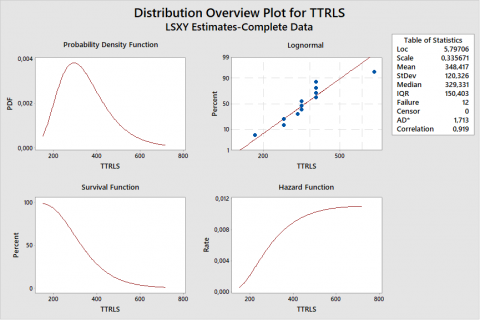
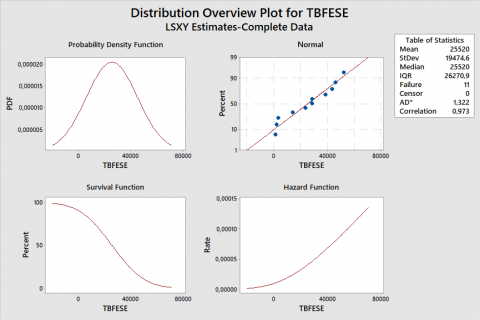
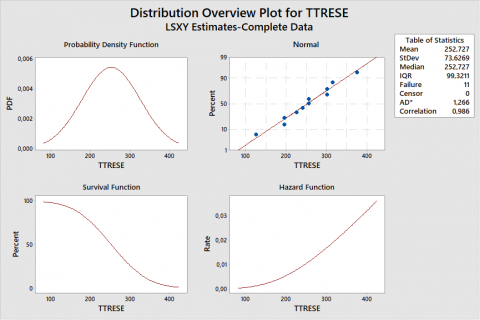
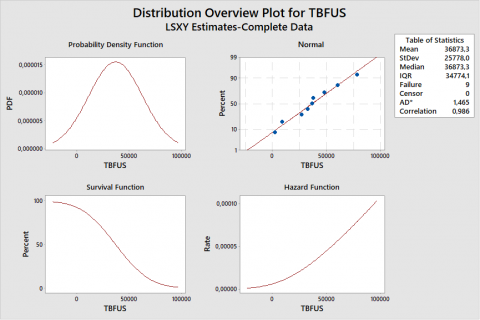
The next data analysis tests the PD and searches for its parameters using the Minitab 18 software based on the critical system TBF and TTR data. The results of the PD test analysis on TBF and TTR data are shown in Table 3, and the parameters are in Figure 6 and Table 4. The analysis results show that TBFLS is Weibull distributed, TTRLS is lognormally distributed, and TBFESE, TTRESE, TBFUS, and TTRUS are normally distributed.
Table 3. Testing the PD of TBF and TTR data
|
Data |
PD |
AD |
CC |
|
TBFLS |
Weibull |
1.160 |
0.98 |
|
TTRLS |
Lognormal |
1.713 |
0.919 |
|
TBFESE |
Normal |
1.322 |
0.973 |
|
TTRESE |
Normal |
1.266 |
0.986 |
|
TBFUS |
Normal |
1.322 |
0.973 |
|
TBFUS |
Normal |
1.266 |
0.986 |
(a) Distribution overview plot for TBFLS
(b) Distribution overview plot for TTRLS
(c) Distribution overview plot for TBFESE
(d) Distribution overview plot for TTRESE
(e) Distribution overview plot for TBFUS
(f) Distribution overview plot for TTRUS
Figure 6. The plot of PD overview and parameters for TBF and TTR mobile crane systems
Table 4. TBF and TTR parameters with selected distribution
|
TBF |
LS |
ESE |
US |
|
parameter/PD |
Weibull |
Normal |
Normal |
|
Shape (β) |
1.0972 |
||
|
Scale (α) |
29298.2 |
||
|
Mean (µ) |
25520 |
36873.3 |
|
|
StDev (σ=s) |
19474.6 |
25778 |
|
|
|
|||
|
TTR |
LS |
ESE |
US |
|
parameter/PD |
Lognormal |
Normal |
Normal |
|
Scale (α) |
0.335671 |
||
|
Mean (µ) |
252.727 |
251.667 |
|
|
StDev (σ=s) |
73.6269 |
68.3688 |
|
|
Median (tmed) |
329.331 |
||
4.1 Calculation of MTBF and MTTR
Calculation of the critical system MTBF and MTTR using each PD's equation and parameter values. The results of the MTBF and MTTR calculations are shown in Table 5. The highest MTBF value in the US system was 28294.03 minutes, followed by LS 28294.03 minutes and ESE 25520 minutes. While the highest MTTR value in the LS system was 348,417 minutes, followed by ESE at 252,727 minutes and US at 251,667 minutes.
Table 5. Recapitulation of MTBF & MTTR calculations
|
System |
MTBF |
MTTR |
|
LS |
28294.03 |
348.417 |
|
ESE |
25520 |
252.727 |
|
US |
36873.3 |
251.667 |
After getting the MTBF and MTTR values, the next step is to analyze reliability (R), availability (A), and maintainability (M) according to the selected PD.
4.2 Reliability analysis
In this study, the overall system reliability was evaluated at different reliability levels, namely 85%, 75%, 65%, 50%, at t (time) = MTBF and at t (time) = optimal downtime (OD) with the help of Microsoft Excel software. The results of the reliability analysis are listed in Table 6.
Table 6. Calculation of the reliability of the mobile crane system
|
State |
85% |
75% |
65% |
50% |
MTBF |
OD |
|
time |
3000 |
7500 |
10500 |
18000 |
28294.03 |
34500 |
|
R of LS % |
89.37 |
75.51 |
67.49 |
50.6 |
34.66 |
27.47 |
|
time |
4500 |
12000 |
18000 |
25520 |
25520 |
30000 |
|
R of ESE % |
85.98 |
75.62 |
65.03 |
50.00 |
50.00 |
40.90 |
|
time |
9000 |
18000 |
25520 |
36873 |
36873.3 |
39000 |
|
R of US % |
86.02 |
76.80 |
67.02 |
50.00 |
50.00 |
46.71 |
|
R system % |
84.74 |
72.21 |
59.40 |
37.74 |
33.66 |
26.69 |
Based on the system reliability analysis results using RBD, shown in Table 6. Mobile cranes achieve a system reliability level of 84.74%, from the LS system maintenance task (R=89.37), ESE (R=85.98%), US (R=86.02%). It must be performed at or before the operation to reach 3000 minutes, 4500 minutes, and 9000 minutes, respectively. Likewise, to achieve a system reliability level of 37.74%, maintenance tasks must be carried out on or before system operation reaches 18000 minutes for LS (R=50.6%), 25520 minutes for ESE (R=50.00%), and 36873 minutes for US (R=50.00%). Likewise, to achieve the current average level of system reliability with t=MTBF and system R of 33.66%, maintenance tasks must be carried out on or before operation reaches 28294.03 minutes for LS (R=34.66%), 25520 minutes for ESE (R=50.00%) and 36873.3 for US (R=50.00%). The results obtained from Table 6 show that the LS and ESE systems are the most critical mobile crane systems because they have a shorter uptime duration than US from the reliability analysis of 85%, 75%, 65%, 50%, t=MTBF and t=OD. As a result, companies must take significant steps to improve the reliability of LS and ESE systems, which in turn will increase system availability.
4.3 Maintainability analysis
In calculating the maintainability of a critical system, the time required to repair the system based on TTR data ranges from 60 minutes to 750 minutes. These results can be used as verification to show that each critical system has the opportunity to be repaired (maintainability) between 60 minutes to 750 minutes. In addition, the magnitude of the parameter value also affects the time that can maintain system opportunities and is faster for the maintenance process. The results of the maintainability calculation are shown in Table 7.
Based on the results of the maintainability calculation, suggestions can be given to the company to carry out preventive maintenance when the machine has a system reliability value close to 26.69%, namely when R(t) = OD of each system. The ideal time needed to carry out preventive maintenance is from 240 minutes to 540 minutes while taking into account the safety factor of the structure in carrying out maintenance. This is done to increase availability while still paying attention to maintenance activities on critical systems. Reliability calculated based on this time interval is not only for planning service/repair work but also for implementing the replacement of the components under consideration. This analysis adds value to the implications for equipment safety and operational readiness. This valid recommendation is recommended for scheduling preventive maintenance of mobile cranes.
Table 7. Calculation of critical system maintainability values
|
time |
LS |
ESE |
US |
|
60 |
0.00% |
0.44% |
0.25% |
|
120 |
0.13% |
3.57% |
2.71% |
|
180 |
3.60% |
16.16% |
14.73% |
|
240 |
17.29% |
43.14% |
43.23% |
|
300 |
39.05% |
73.96% |
76.02% |
|
360 |
60.46% |
92.74% |
94.35% |
|
420 |
76.56% |
98.85% |
99.31% |
|
480 |
86.91% |
99.90% |
99.96% |
|
540 |
92.96% |
100.00% |
100.00% |
|
348.4 |
56.66% |
90.31% |
92.15% |
|
252.7 |
21.51% |
50.00% |
50.62% |
|
251.7 |
21.15% |
49.43% |
50.00% |
4.4 Availability analysis and performance evaluation
The reliability calculation shows that the system has a relatively long preventive maintenance time because it is carried out at t=OD. Hence, the system may have a fairly large availability value. In addition to involving reliability, availability analysis which is a performance parameter, also involves calculating system maintainability. In this study, availability optimization applies maintenance when reliability reaches the OD and several maintainability scenarios. The maintainability scenario in question is when t=MTTR, t=240 minutes and t=300 minutes. The results of the calculation of system availability are as shown in Table 8.
Table 8. System availability calculation
|
System |
LS |
ESE |
US |
A System |
|
Current Availability |
98.78% |
99.02% |
99.32% |
99.31% |
|
Scenario 1 (A with M (MTTR)) |
99.00% |
99.16% |
99.36% |
99.35% |
|
Scenario 2 (A with M (240)) |
99.31% |
99.21% |
99.39% |
99.38% |
|
Scenario 3 (A with M (300)) |
99.14% |
99.01% |
99.24% |
99.23% |
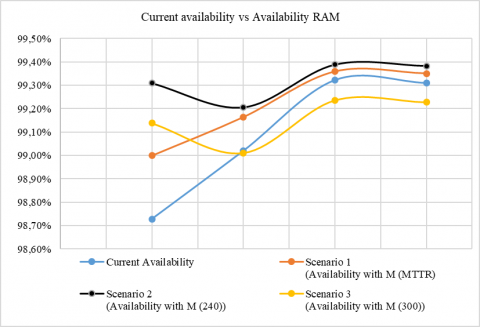
The analysis results show that the highest value of system availability is at maintainability for 240 minutes, and the lowest is at maintainability for 300 minutes. Therefore, it is suggested that the company set a system maintainability time of 240 minutes. RAM analysis shows that by applying reliability at t=OD and maintainability for 240 minutes, there is an increase in LS system availability by 0.53% (98.78% to 99.31%), ESE by 0.19% (99.02 % to 99.21%), US by 0.07% (99.32% to 99.39%), and overall system availability by 0.07% (99.31% to 99.38%). Comparison of current availability values with optimized availability by RAM analysis as shown in Figure 7.
Figure 7. Comparison of current availability with availability optimization with RAM analysis
The RAM framework proposed in this study will help decision-makers plan maintenance activities according to the criticality level of each system and allocate appropriate resources. This research can be expanded by analyzing the performance of subsystems or components of each system using the proposed RAM framework for lifting equipment or other equipment from different industries. In addition, in the study, there are several assumptions used such as the failure rate and repair of each system is constant and statistically independent, only one system fails at a time, the repaired system is as good as the new one, and the standby unit follows its last condition, namely failed state or operating state.
RAM analysis is quantitative reliability engineering required for scheduling maintenance to improve system or equipment performance. This study highlights the importance of RAM analysis for lifting equipment such as mobile cranes. Mobile cranes have three main systems, namely LS, ESE and US. Based on the Pareto principle, all three are critical systems. The results of the PD test showed that TBFLS had a Weibull distribution, TTRLS had a lognormal distribution, and TBFESE, TTRSE, TBFUS TTRUS had a normal distribution. The PD equation for each system is then used in the RAM analysis to suggest a preventive maintenance schedule. RAM analysis results show that by implementing reliability maintenance at t=OD and maintainability for 240 minutes, there is an increase in LS system availability by 0.53% (98.78% to 99.31%), ESE by 0.19% (99, 02% to 99.21%), US by 0.07% (99.32% to 99.39%), and overall system availability by 0.07% (99.31% to 99.38%). In this study, the overall equipment performance of the mobile crane was not considered, and the performance evaluation was only based on the calculation of availability and usage. Future research should include the measurement of key performance indicators (KPIs).
[1] Turan, H.H., Atmis, M., Kosanoglu, F., Elsawah, S., Ryan, M.J. (2020). A risk-averse simulation-based approach for a joint optimization of workforce capacity, spare part stocks and scheduling priorities in maintenance planning. Reliability Engineering & System Safety, 204: 107199. https://doi.org/10.1016/j.ress.2020.107199
[2] Zhang, F., Shen, J., Liao, H., Ma, Y. (2021). Optimal preventive maintenance policy for a system subject to two-phase imperfect inspections. Reliability Engineering & System Safety, 205: 107254. https://doi.org/10.1016/j.ress.2020.107254
[3] Jagtap, H.P., Bewoor, A.K., Kumar, R., Ahmadi, M.H., El Haj Assad, M., Sharifpur, M. (2020). RAM analysis and availability optimization of thermal power plant water circulation system using PSO. Energy Reports, 7: 1133-1153. https://doi.org/10.1016/j.egyr.2020.12.025
[4] Tsarouhas, P. (2020). Reliability, availability, and maintainability (RAM) study of an ice cream industry. Applied Sciences, 10(12): 1-20. https://doi.org/10.3390/app10124265
[5] Tsarouhas, P. (2020). Reliability, availability and maintainability analysis of a bag production industry based on the six sigma DMAIC approach. International Journal of Lean Six Sigma, 12(2): 237-263. https://doi.org/10.1108/IJLSS-09-2019-0101
[6] Mohammadi, M., Rai, P., Gupta, S. (2016). Improving productivity of dragline through enhancement of reliability, inherent availability and maintainability. Acta Montanistica Slovaca, 21(1): 1-8. https://doi.org/10.3390/ams21010001
[7] Patil, S.S., Bewoor, A.K., Patil, R.B. (2021). Availability analysis of a steam boiler in textile process industries using failure and repair data: A case study. ASCE-ASME Journal of Risk and Uncertainty in Engineering Systems, Part B: Mechanical Engineering, 7(2): 1-10. https://doi.org/10.1115/1.4049007
[8] Ahmadi, S., Hajihassani, M., Moosazadeh, S., Moomivand, H. (2020). An overview of the reliability analysis methods of tunneling equipment. The Open Construction and Building Technology Journal, 14(1): 218-229. https://doi.org/10.2174/1874836802014010218
[9] Kimera, D., Nangolo, F.N. (2019). Reliability maintenance aspects of deck machinery for ageing/aged fishing vessels. Journal of Marine Engineering & Technology, 21(2): 100-110. https://doi.org/10.1080/20464177.2019.1663595
[10] Talukdar, B.K., Deka, B.C. (2021). An approach to reliability, availability and maintainability analysis of a plug-in electric vehicle. World Electric Vehicle Journal, 12(1): 34. https://doi.org/10.3390/wevj12010034
[11] Kumar, D., Gupta, S., Yadav, P.K. (2020). Reliability, availability and maintainability (RAM) analysis of a dragline. Journal of Mines, Metals and Fuels, 68(2): 68-77.
[12] Mohammed, A., Ghaithan, A., Al-Saleh, M., Al-Ofi, K. (2020). Reliability-based preventive maintenance strategy of truck unloading systems. Applied Sciences, 10(19): 6857. https://doi.org/10.3390/app10196957
[13] Patil, S.S., Bewoor, A.K. (2020). Reliability analysis of a steam boiler system by expert judgment method and best-fit failure model method: A new approach. International Journal of Quality & Reliability Management, 38(1): 389-409. https://doi.org/10.1108/IJQRM-01-2020-0023
[14] Tayal, A., Kalsi, N.S., Gupta, M.K., Pimenov, D.Y., Sarikaya, M., Pruncu, C.I. (2021). Effectiveness improvement in manufacturing industry; trilogy study and open innovation dynamics. Journal of Open Innovation: Technology, Market, and Complexity, 7(1): 7. https://doi.org/10.3390/joitmc7010007
[15] Ben-Daya, M., Duffuaa, S.O., Raouf, A., Knezevic, J., Ait-Kadi, D. (2009). Handbook of Maintenance Management and Engineering. Springer-Verlag London Limited.
[16] Ebeling, C.E. (1997). An Introduction to Reliability and Maintainability Engineering. McGraw-Hill Science.
[17] Jia, L., Ren, Y., Yang, D., Feng, Q., Sun, B., Qian, C. (2019). Reliability analysis of dynamic reliability block diagram based on dynamic uncertain causality graph. Journal of Loss Prevention in the Process Industries, 62: 103947. https://doi.org/10.1016/j.jlp.2019.103947
[18] Bala, R.J., Govinda, R.M., Murthy, C.S.N. (2018). Reliability analysis and failure rate evaluation of load haul dump machines using Weibull distribution analysis. Mathematical Modelling of Engineering Problems, 5(2): 116-122. https://doi.org/10.18280/mmep.050209
[19] Udoh, N.S. (2018). A reliability analysis of 8hp-pml gold engine coupled locally fabricated cassava grinding machine. International Journal of Statistics and Applied Mathematics, 3(6): 28-35.
[20] Stapelberg, R.F. (2009). Handbook of Reliability, Availability, Maintainability and Safety in Engineering Design. Verlag London: Springer.
[21] Dhillon B.S. (2002). Engineering Maintenance: A Modern Approach. CRC Press LLC.
[22] Tsarouhas, P. (2018). Reliability, availability and maintainability (RAM) analysis for wine packaging production line. International Journal of Quality & Reliability Management, 35(3): 821-842. https://doi.org/10.1108/IJQRM-02-2017-0026
[23] Chaowasakoo, P., Seppälä, H., Koivo, H. (2018). Age-based maintenance for a fleet of haul trucks. Journal of Quality in Maintenance Engineering, 24(4): 511-528. https://doi.org/10.1108/JQME-03-2017-0016
[24] Choudhary, D., Tripathi, M., Shankar, R. (2019). Reliability, availability and maintainability analysis of a cement plant: A case study. International Journal of Quality & Reliability Management, 36(3): 298-313. https://doi.org/10.1108/IJQRM-10-2017-0215
[25] Okoye, M.O., Yang, J., Lei, Z., Yuan, J., Ji, H., Wang, H., Feng, J., Otitoju, T.A., Li, W. (2020). Predictive reliability assessment of generation system. Energies, 13(17): 4350. https://doi.org/10.3390/en13174350