Naresh Kumar Golla* | Suresh Kumar Sudabattula | Velamuri Suresh
© 2022 IIETA. This article is published by IIETA and is licensed under the CC BY 4.0 license (http://creativecommons.org/licenses/by/4.0/).
OPEN ACCESS
Technological findings recommend that Electric Vehicles (EVs) play a vital role in the road transportation system. EV's are becoming more prominent as formal vehicles have a substantial effect on the atmosphere. The rising adoption of EVs will lead to an increase in the number of charging stations that would profoundly impact the power grid. The inappropriate forecasting of EV Charging Stations (EVCSs) has a detrimental effect on the distribution system. Therefore, the selection of the optimum placement of EVCS in the power grid is a significant problem. In the proposed approach, an IEEE 33 Bus system is considered for optimal placement of EV charging station, with the account of optimal loads of the buses. The analysis was carried for an IEEE 33 BUS system using the Loss Sensitivity Factor (LSF) and power flow by Newton Raphson method. LSF was determined for various buses considering the system voltage, load (real and reactive power), and losses in the system. Also, the results are compared with the conventional method, Particle Swarm Optimization (PSO) and Harris Hawks Optimization (HHO) algorithms. Finally, the reliability test was carried out for optimal placement of EVCS in an IEEE 33 BUS system.
transportation system, electric vehicle charging station, optimal placement, loss sensitivity factor
In recent years, the consistent advancement of transport has strengthened, which accelerates the growth in the automotive sector. Various considerations, such as the potential to reduce CO2 emissions arising from gasoline combustion in fuel-powered cars, economic viability, environmental issues, renewable properties, and rising oil prices, have made EVs an exciting alternative for new urban transport systems. The rapid growth of EVs raises additional challenges for the operator of the power delivery system to encourage sustainable charging facilities for EV consumers in the distribution system. In urban areas, high EV penetration needs a broad number of charging stations to recharge batteries for EV's. The EVCS is the basis of the growth of the electric vehicle industry as the energy supplier of electric vehicles. As the pioneering works of EVCS development, the selection of the EVCS site is very significant in the overall life cycle, which directly affects the quality of the service and EVCS operating performance. A major factor impact is not just the implementation of EVs but also the viability of transportation accessibility and optimum position of Charging Stations in the metropolitan environment.
Furthermore, locating the optimum positions of Charging Stations impacts making use of efficient ways and allows EV's to charge their batteries during their rides. The location and potential of the charging station directly influence the operation of the electric grid. Specifically, the bus voltage, device load, and power loss will consider the EVs that charge their batteries using a charging station.
Dong et al. [1] proposed a genetic algorithm-based approach to develop the charging infrastructure to optimize the position and simulate the actions of the car owner and explore the aspects that affect the refueling. Mohseni et al. [2] introduce a new simulation technique for optimized part of dimensioning in an island micro-grid, and per the fulfillment of a reliability index for load fulfillment. A mechanism for demand-side control focused on the model reduction strategy is often used to mitigate the computational expense, and a deferrable load program is introduced. Boonraksa et al. [3] presented a case study to analyze the impact of an EV charging station on the IEEE 33 bus test system. The author has proposed E-bus charging with the distributed generation (DG) system to maintain the constant voltage. Xiong et al. [4] have proposed the game theoretical framework topology for the optimal allocation of the fast EV charging station. The author has validated the proposed topology by comparing it with conventional optimal algorithms. The evaluation of parameters suggests optimizing an eleCtric vEhicle chArging statioN (OCEAN) to determine the optimum charging station distribution. Zeb et al. [5] proposed a novel technique for optimum sizing in the active power grid of industrial and residential entities and offices and homes and positioning various types of EV charging stations. In addition, using probabilistic distributions placed with actual data, the unpredictable car owner's action was modeled, and parking space restrictions were considered into account. Hongcai Zhang et al. [6] examined the optimum scheduling of fast-charging PEV stations, taking into account the interconnections between electricity and transit networks. For PEV fast-charging station scheduling, the model is formulated as a mixed-integer linear programming model. They incorporate both transport and electrical constraints based on (Capacitated-flow Refueling Location Model) CFRLM that can be overcome by deterministic station planning. Hashemian et al. [7] (MILP) model is proposed to assess the optimal placement and capability of Plug-in Electric Vehicle Fast-Charging Stations (PEVFCSs), taking into account the transit systems and conventional system. The suggested technique determines the optimum position and capability of the PEVFCSs in such a manner that, to minimize the distance-time of the PEVs to access the PEVFCS, the waiting time for the transport network charging facility is reduced. Wang et al. [8] identify the EV charging stations with coordinated planning strategy in a coupled electrical traffic network. The Unconstrained traffic assignment model (UTAM) is applied in the transportation network to directly identify the distribution of traffic flows in a steady state. An analogous mixed-integer linear programming model with UTAM constraints is implemented to achieve a globally optimal solution for structured scheduling. Dogan [9] proposed a hybrid algorithm to find the Optimum PV positions and capacities, the essence of time dependence for DGs, EVCSs, and machine load ESSs. To mitigate overall loss, a weighted sum multi-objective function is created based on the voltage level and total installation capability of PVs, WTs, EVCSs, and ESSs in the delivery system. Xie et al. [10] proposed a two-stage approach, of developing a standalone charging station that runs on green energy. The structure for the means of transport is computed and the proposed DRO model takes into account inaccuracies in the probabilities of road traffic and distributed generation. MILP and LP of the risk hypothesis are linked to reformulations, which emphasize model precision and numerical tractability in various ways.
From the recent studies, it is identified that Optimal Topologies are needed for the optimal allocation of EV charging stations in the Distribution system. This paper proposes a new approach for the optimum placement of charging stations for EVs. In the proposed approach, an IEEE 33 BUS system was considered for optimal placement of EV charging station, with the account of system voltage, load (real and reactive power) and losses for various buses are considered. The analysis is carried out using LSF with hybrid PSO, and HHO algorithms for identifying the optimal placement of EVCS with various constraints on the buses are taken into consideration.
The remaining portion of the paper is formulated as follows. The methodology of the proposed approach is in Section 2, followed by the Meta-heuristic algorithms approach for optimal placement of EVCS in Section 3. The result with discussion is carried in Section 4 and finally ends with the conclusion and future scope in the last section 5.
The escalating concern about the depletion of fossil fuels and environmental degradation, the electrification of the transport industry, has caused increasing anxiety around the world. Electrification of the transport industry is potentially the most promising solution to reduce transport pollution, so the rise of plug-in electric vehicles (PEV) is projected to accelerate significantly over the coming generations. The rising prevalence of electric vehicles leads to a growth in the number of charging stations, which have a huge influence on the power grid. The positioning of the EVCS specifically influences the operation of the electric grid, so there is an important concern with the optimum position of the EVCS in the power grid. In the proposed approach, an IEEE 33 BUS system was considered for optimal placement of EVCS, with the account of optimal loads of the buses being considered.
2.1 Newton Raphson method for power flow calculation
A Power flow study aims to determine the voltages for a particular load, generator, and network state. (Magnitude and angle). Once all bus voltages are defined, it is easy to measure line flows and losses. It has quadratic properties of convergence. The conventional works were carried out for IEEE 33 BUS system data and power flow run by Newton Raphson method. The convergence is very quick, and the number of iterations will be unaffected by the device's length. High-precision methods will almost often be used in two to three iterations for both small and large implementations. The power flow equation that was used in the process of resolving a network issue uses Voltage and Power equations.
In any power system, the power equations in bus k apply to the voltage and current.
Si=ViIi (1)
where, Vi is the voltage at bus i; Ii is the current at bus i.
The input current can be obtained from:
$\mathrm{I}_{\mathrm{i}}=\frac{P i+j Q i}{\mathrm{Vi}}$ (2)
The Newton-Raphson approach is used to solve the power flow equation, will be shown in the following equations.
$P_{G i}-P_{D i}=v_{i} \sum_{i=1}^{N_{B-1}} v_{j}\left(G_{i j} \cos \delta_{i j}+B_{i j} \cos \delta_{i j}\right)$ (3)
$\mathrm{Q}_{\mathrm{Gi}}-\mathrm{Q}_{\mathrm{Di}}=\mathrm{v}_{\mathrm{i}} \sum_{\mathrm{i}=1}^{\mathrm{N}_{\mathrm{PQ}}} \mathrm{v}_{\mathrm{j}}\left(\mathrm{G}_{\mathrm{ii}} \sin \delta_{\mathrm{ij}}+\mathrm{B}_{\mathrm{ij}} \sin \delta_{\mathrm{ij}}\right)$ (4)
At the bus, real and reactive power is fed into the system i as PGi and QGi, The Demand of active power and reactive power are given by PDi and QDi respectively. The angle for the i and j bus Voltage is given by δij. The number of buses and loads are given by NB and NPQ. The conductance and susceptance at the feeder ij are given by Gij and Bij.
Active Power loss in kth line is given by [Ik2]*Rk:
$P_{\text {lineloss }}[j]=\frac{\left(P^{2}[j]+Q^{2}[j]\right) R[k]}{(V[j])^{2}}$ (5)
Similarly, the Reactive Power loss is given by:
$Q_{\text {lineloss }}[j]=\frac{\left(P^{2}[j]+Q^{2}[j]\right) X[k]}{(V[j])^{2}}$ (6)
where, P and Q are the Effective active and reactive power at bus j.
Loss sensitivity factor is given by:
$\frac{\partial P_{\text {lineloss }}}{\partial Q}=\frac{(2 * Q[j] * R[k])}{(V[j])^{2}}$ (7)
The order in which buses are considered for compensation placement is determined by the Loss Sensitivity factor, and the normalized values of voltages determine whether a specific bus requires compensation or not. In this paper, the proposed algorithm chooses the optimal location of EVCS based on the Loss sensitivity factor approach.
Metaheuristic optimization is concerned with the use of metaheuristic algorithms to solve optimization problems. Effective search or optimization algorithms are necessary to obtain the optimal solution. Numerous optimization algorithms can be categorized in several ways based on their intent and requirements. Particle Swarm Optimization and Harris Hawks Optimization are some of the available search algorithms used for the optimal placement of EVCS.
Particle Swarm Optimization (PSO) is a method of evolutionary computation that relies on the swarm's intelligence. The PSO process begins by arbitrarily initializing a series of possible solutions, after which it repeats the quest for the best solution. The best particles are followed in the PSO algorithm to find the optimum location represented by the PSO flowchart as shown in Figure 1. Here, the particle's velocity is operated by the Loss Sensitivity factor (LSF). Compared to Evolutionary Algorithms (EAs), PSO has a broad intellectual context and is easier to implement.
Figure 1. PSO algorithm flowchart
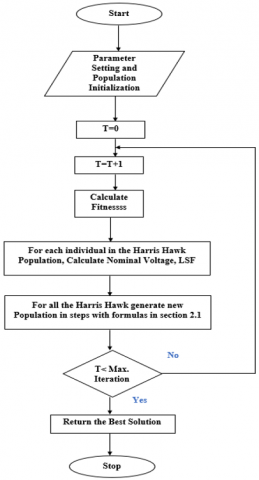
Harris' hawks in nature use a cooperative movement and chase style of ambush pounce, which is the primary source of inspiration for Harris Hawks Optimization (HHO). Several hawks work together to ambush prey by pouncing it from distinct viewpoints due to the complex nature of situations and the prey's fleeing habits. The Harris hawk is one of nature's most sophisticated and esteemed threat birds, with unique mutual chasing skills trying to trace, surround rinsing and catch the potential food animal (rabbit) in a mob. The initial population is thought to be a group of hawks that use a random pounce to chase the desired rabbit (optimization problem solution) from various directions. The leader hawk attempts to catch the prey at first; if it fails due to its dynamic disposition and fleeing behavior, the swapping strategies are used. The other party members (hawks in the group) strike the escaping prey before it is caught. The primary aspect of this cooperative strategy is that the birds track down the pointed rabbit by puzzling and exhausting the fleeing prey. Here the birds select to catch the nearest rabbit based on LSF represented by the HHO flowchart as shown in Figure 2. The Harris Hawks are the applicant solutions in HHO, while the expected prey is the best/global solution.
Figure 2. HHO algorithm flowchart
In the proposed approach, an IEEE 33 BUS system was considered for optimal placement of EVCS, the variations in the Loss Sensitivity factor concerning buses, System, and Nominal Voltage for various loads were obtained.
4.1 IEEE 33 bus system
An IEEE 33 bus system was considered for optimal placement of EVCS, the bus system's configuration in all 33 radials is given by Number of lines: 32, Slack bus number: 1, Base Voltage: 12.66 kV, MVA: 100 MVA. The Active and Reactive Power ratings of the Loads are given in the following Table 1.
Table 1. Active and Reactive Power rating of the Loads.
|
Nature of Load |
Active Power |
Reactive Power |
|
Base Load |
201.58 kW |
134.45 kVAR |
|
Load a |
223.34 kW |
149.06 kVAR |
|
Load b |
258.10 kW |
172.33 kVAR |
|
Load c |
275.97 kW |
184.64 kVAR |
The following Figure 3 shows an IEEE 33 bus system in a single line diagram.
Figure 3. Conventional IEEE 33 bus system
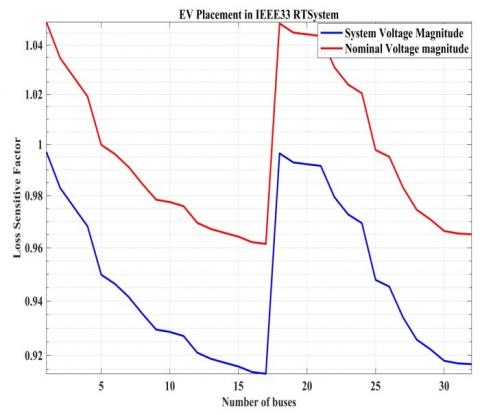
Figure 4. Loss sensitivity factor variation for various loads in conventional IEEE 33 bus system
Figure 5. System voltage variation for conventional and using HHO
Figure 6. Nominal voltage variation for conventional and using HHO
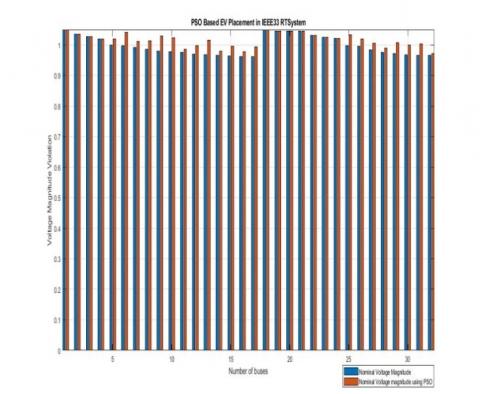
Figure 7. System voltage variation for conventional and using PSO
Figure 8. Nominal voltage variation for conventional and using PSO
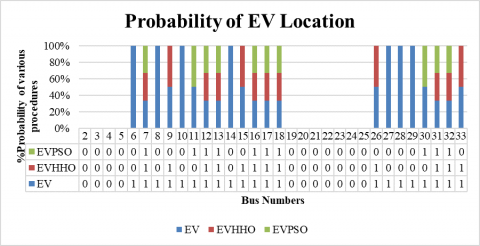
Figure 9. Probability of EV location placement
The above Figure 4 shows the Base Load and corresponding increase in the Loads a, b and c with the variation in the System and Nominal voltages for IEEE 33 bus system. Figures 5, 6 gives the interpretation of System voltage and Nominal voltage for conventional and HHO to Loss Sensitivity factor, showing the increase in the Voltage profile using HHO. Whereas Figures 7, 8 gives the variation of System voltage and Nominal voltage for conventional and PSO to Loss Sensitivity factor, showing the increase in the Voltage profile for IEEE 33 bus system.
The EVCS location for the strong buses is identified in the IEEE 33 bus system based on the LSF component. In Figure 9, where 1 represents a need for the placement of EV and 0 indicates no need for EV placement. From the conventional system, 21 buses are obtained for optimal placement of EVCS in the IEEE 33 bus system. The HHO algorithm reduces the siting location for the placement of EVCS, identified 12 strong buses, and further PSO algorithm also uses IEEE 33 bus system to implement it, reduced to 10 buses for optimal location compared with the conventional system. Finally, a reliability test has been done and compared with the conventional, HHO and PSO for optimal placement of EVCS in an IEEE 33 bus system.
Finally, from the Probability of EV location, it is clear that buses 7,12,17, and 31 are identified as the strong buses for the optimal placement of EV in the IEEE 33 bus system shown in Figure 10.
Figure 10. Optimal location of IEEE 33 bus system
A novel technique has been used in this article for examining the best location of EVCS on the IEEE 33 bus system, also analyzed the impact of the system's voltage stability, reliability, and power losses for optimal placement of EVCS. The Newton-Raphson method was used to quantify the power flow. PSO and HHO algorithms are chosen for the optimal siting of EVCS, the simulation results were compared with the conventional system, showing the variation of LSF for various buses concerning Nominal and System Voltages. The bus location sequence will be determined by the descending order of the values for the LSF component to locate the best position vector. Finally, a reliability test comparison was made for conventional, PSO and HHO for IEEE 33 bus system and concluded that the buses 7, 12, 17 and 31 total of four buses were identified as the strong buses for the optimal placement of EVCS, which can balance the corresponding buses based on their load demand (during off and peak loads). The research work can be carried out further by the Integration of Distributed Generations (DG) in the IEEE 33 bus system and due to the intermittent nature of DG like solar, wind etc. will be better to analyze the optimal allocation of Energy management strategy in the system for the reliable operation of the grid during the peak demands.
[1] Dong, J., Liu, C., Lin, Z. (2014). Charging infrastructure planning for promoting battery electric vehicles: An activity-based approach using multiday travel data. Transportation Research Part C: Emerging Technologies, 38: 44-55. https://doi.org/10.1016/j.trc.2013.11.001
[2] Mohseni, S., Brent, A., Burmester, D., Chatterjee, A. (2018). Optimal sizing of an islanded micro-grid using meta-heuristic optimization algorithms considering demand-side management. In 2018 Australasian Universities Power Engineering Conference (AUPEC), pp. 1-6. https://doi.org/10.1109/AUPEC.2018.8757882
[3] Boonraksa, T., Paudel, A., Dawan, P., Marungsri, B. (2019). Impact of electric bus charging on the power distribution system a case study IEEE 33 bus test system. In 2019 IEEE PES GTD Grand International Conference and Exposition Asia (GTD Asia), pp. 819-823. https://doi.org/10.1109/GTDAsia.2019.8716023
[4] Xiong, Y., Gan, J., An, B., Miao, C., Bazzan, A.L. (2017). Optimal electric vehicle fast charging station placement based on game theoretical framework. IEEE Transactions on Intelligent Transportation Systems, 19(8): 2493-2504. https://doi.org/10.1109/TITS.2017.2754382
[5] Zeb, M.Z., Imran, K., Khattak, A., Janjua, A.K., Pal, A., Nadeem, M., Khan, S. (2020). Optimal placement of electric vehicle charging stations in the active distribution network. IEEE Access, 8: 68124-68134. https://doi.org/10.1109/ACCESS.2020.2984127
[6] Zhang, H., Moura, S.J., Hu, Z., Song, Y. (2016). PEV fast-charging station siting and sizing on coupled transportation and power networks. IEEE Transactions on Smart Grid, 9(4): 2595-2605. https://doi.org/10.1109/TSG.2016.2614939
[7] Hashemian, S.N., Latify, M.A., Yousefi, G.R. (2020). PEV fast-charging station sizing and placement in coupled transportation-distribution networks considering power line conditioning capability. IEEE Transactions on Smart Grid, 11(6): 4773-4783. https://doi.org/10.1109/TSG.2020.3000113
[8] Wang, X., Shahidehpour, M., Jiang, C., Li, Z. (2018). Coordinated planning strategy for electric vehicle charging stations and coupled traffic-electric networks. IEEE Transactions on Power Systems, 34(1): 268-279. https://doi.org/10.1109/TPWRS.2018.2867176
[9] Dogan, A. (2021). Optimum sitting and sizing of WTs, PVs, ESSs and EVCSs using hybrid soccer league competition-pattern search algorithm. Engineering Science and Technology, an International Journal, 24(3): 795-805. https://doi.org/10.1016/j.jestch.2020.12.007
[10] Xie, R., Wei, W., Khodayar, M.E., Wang, J., Mei, S. (2018). Planning fully renewable powered charging stations on highways: A data-driven robust optimization approach. IEEE Transactions on Transportation Electrification, 4(3): 817-830. https://doi.org/10.1109/TTE.2018.2849222