Hichem Kahia* | Aicha Saadi | Abderrahmane Herbadji | Djamel Herbadji | Haitham Mohamed Ramadhan
© 2023 IIETA. This article is published by IIETA and is licensed under the CC BY 4.0 license (http://creativecommons.org/licenses/by/4.0/).
OPEN ACCESS
In favor low emissions and high efficiency of fuel cell, Fuel cell is regarded as next generation power devices in smart cities and sustainable mobility. Fuel cells convert the chemical energy stored in fuels to electricity in an electrochemically way. A suitable diagnostic is required to identify the different faults that may occur in fuel cell systems. This paper aims at illustrating a novel technique to increase the service life and understand the aging mechanisms in fuel cell systems by modifying air flow rate (qwin) and humidifying gases to guarantee the proper operation of the PEMFC. In this paper, the artificial intelligence technology (i.e. neural network ANN) is used for determining the overall performance and resistance losses of PEMFC at numerous operating conditions. The proposed model in this study deals with the parameters of the electrochemical impedance spectroscopy and polarization curves, to estimate and diagnose the state of health of the fuel cell in both case flooding and drying out of the FC. This model identifies a set of three parameters of Randles model in different state of humidification, at either low or high relative humidity RH conditions. Simulation experiments show that the proposed technique enables to monitoring the water management in a simple way that helps to define the state of health (SOH) of the PEMFC.
PEM fuel cells, (SOH), AI technology, neural network model, (EIS)
The integration of renewable energy including hydrogen energy become economically and environmentally become necessary worldwide. The fuel cell technology is widely utilized in many applications, for instance,in the last years, there were about 8,000 fuel cell electric vehicles (FCEV) in the U.S, 3,600 in Japan, 5,000 in South Korea, 2,500 in Europe, and 110 in China, and there have been 44 hydrogen refueling stations in the U.S, 112 in Japan, 34 in South Korea, 140 in Europe and 12 stations in China. [1]. On the other hand, the specialized market of hydrogen technologies claims that over 56 thousand hydrogen fuel cell cars were sold at the end of 2022 worldwide and the number of hydrogen refueling station is more than 800 in 2022: (European Hydrogen Refuelling Stations in 2022 - Tuv Sud– Hydrogen Central (hydrogencentral.com)).
There are various applications areas for fuel cells: Banks, infrastructure in cities, Hospitals, Telecommunication companies, Laptops, Chargers systems and radio/communication devices, etc. Generally, the applications of fuel cells can be categorized into three main areas: Stationary power generation, Portable and Transportation). The mean features are classified in Table 1[1].
Table 1. PEM fuel cell features [1]
| PEMFCs | features |
| Electrolyte | Polymeric membrane |
| Charge carrier | H+ |
| Operating temperature | –40–120ºC (150–180ºC in high temp PEMFCs) |
| Primary fuel | H2, reformed H2, methanol in direct methanol fuel cells |
| Electrical efficiency | Up to 65–72% |
| Primary applications | Portable, transportation, and small-scale stationary |
| Shipments in 2019 | 934.2 MW |
The research and development in the polymer electrolyte membrane fuel cell describes the importance of this technology. The fuel cell converts the electrical energy from hydrogen chemical energy according to the Equation 1:
O2 + 2H2 → 2H2O + energy + Heat (1)
The electrochemical reaction is decomposed by the oxidation of hydrogen and the reduce of oxygen as expressed in the half reduction of Equation 2, 3:
$\mathrm{H}_2 \rightarrow 2 \mathrm{H}^{+}+2 e^{-}$Anode (2)
$\mathrm{O}_2+4 \mathrm{H}^{+}+4 e^{-} \rightarrow \mathrm{H}_2 \mathrm{O}$ Cathode (3)
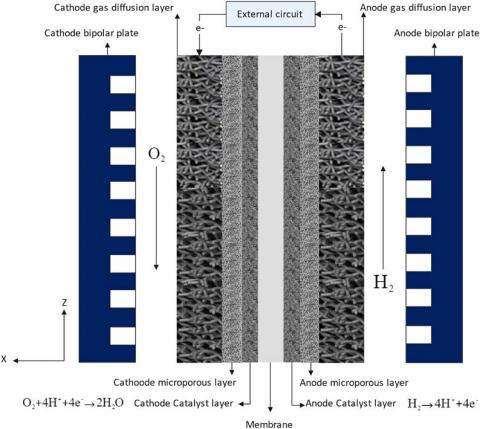
The protons in the membrane passes to the cathode; whilst, the electrons conducts inside external charge to the cathode side, this process is displayed in Figure 1.
Figure 1. Basic PEM Fuel Cell process
The (SOH) and the service life of fuel cell are related to the fault diagnosis strategy of the PEMFC system. In addition, The most popular challenging in the fuel cell are focused around the water management, the produced water inside the fuel cell should be more than the water of evacuation and evaporation to confirm the membrane hydrated under each operating conditions of fuel cell. Moreover, the ratio of pressure drop to flow rate and the flooding degree has been used as an indicator to diagnose the state of health of the fuel cell. Therefore, it’s logically to diagnose the failure modes and control the state of health of the fuel cell during different operating conditions, the fault diagnosis can be isolate and correct in time. The optimal water man- agement ensures the best functioning as well as increasing the service life of the fuel cell.
Numerous methods have been proposed to identify and diagnose the state of fuel cell’s health, i.e. semi-empirical, empirical, physical, analytical and the black-box models [2]. In the literature, most common technique to di agnose the fuel cell is the electrochemical impedance spectroscopy (EIS) in order to make the hydration monitoring [3], which characterizes the values of the impedance parameters based on the Randles model of constant phase elements (CPE) through estimating the flooding and drying state in the fuel cell system. In general, the randles model is used to extract the parame- ter feature from the EIS, and this model consists of three elements, namely Rm, Rp and Zw. The fuel cell’s internal resistance is represented by Rm. The polarization resistance Rp characterizes the oxygen reduction reaction. The limitation of mass transfer represented by Zw. Moreover, the parame- ters shown in [4] are directly affected by charge transfer, mass transfer and membrane resistance, which are used as characteristics to select the defect in different FC health states.
One of the promising method based PEMFC diagnostics, becoming im- portant for researchers, is the artificial neural networks (ANNs), it provides many advantages compared to other traditional techniques that require a large number of instruments. Where, several works have empirically demonstrated the effectiveness of the ANNs method to diagnose and analyze the state of health of the fuel cells. It should be noted that ANNs were used in a large scale real-world applications in various domains, such as fingerprint and speaker identification, image analysis, spectroscopy, etc. The presented ANN model by this author used a combined strategies based on Electrochem- ical Impedance Spectroscopy measurement and the stack voltage singularity measurement and classification, which facilitates and optimize the perfor- mance of the water management [4].The main idea behind using ANNs for PEMFC diagnostic is that neural network approach presents a high sensitiv- ity to identify the parameters of the Randles model and capable to predict response of voltage under a sudden change in relative humidity [5].
To this end, in this paper, we suggest to employ the ANNs so we can summary the contribution of our work as follows:
- A fast prognostic tool to predict the output voltage loss in the PEMFC.
-The neural network method proposed could be effective to predict the degradation caused by poor water management of the fuel cell (i.e. Flooding, Drying).
The rest of this paper is organized as follows. Section 2 related work, Section 3 EIS model, Section 4 ANN model (test and simulation), Section 5 results and discussion.
Recently, artificial neural networks (ANNs) based diagnosing method is widely employed. For instance. Jiaping xie et al. [2] proposed a method using multi-stage fault diagnosis based on support vector machine. The fault features are selected and determined by an equivalent circuit model using the hybrid genetic particle swarm optimization algorithm to realize the fault classification online. Jin youngpark et al. [6] suggested a fuel cell fault diagnostic method by employing artificial intelligence. The proposed model detects faults on fuel cell components level. The multiple single output neural networks in this model are combined with the aim to increasing the performance of the fuel cell diagnostics. A developed numerical simulation of PEMFC by using sensitive model and neural network approach was de- signed by Ali.Mohammadi [7] to diagnose each fault in the fuel cell stack and DC/DC converter. While, authors in [8] have defined humidity sensor based on NNT model to predict the flowed rate water in each operation condition. The proposed model can estimate the internal resistance for both cases of flooding and drying of the fuel cell. R.E. Silva [9] has designed the adaptive Neuro-Fuzzy inference system (ANFIS) model to obtain the variations of the output voltage caused by degradation during operation, this technique is well adjusted to predict the state of health of fuel cell systems, whereas, Khaled Mammar [10] applied ANFIS utilizing the spectroscopy (EIS) as an estimator to predict humidification inside PEM fuel cell.Authors in [11] have presented a novel grey neural network model (GNNM) method and the mov- ing window method to predict the degradation of PEMFC .The suggested considers the influence of different factors e.g. (load current, inlet temperature, inlet hydrogen pressure, and inlet relative humidity).The developed model was validated the prediction performances under different conditions by using three PEMFC aging experiments. Table 2 presented the comparative between this study and those in the literature review. For other works utilizing electrochemical impedance spectroscopy in the PEMFC diagnosis, the reader is encouraged to refer to [12;13;14;15;16;17]. The use of the artificial neural networks and the improved sensor make the implementation of the proposed method simple and fast. This model is able to easily offer high sensitivity for Randalls model parameterization and is able to predict the voltage response under sudden change in relative humidity. Overall, it is means that this model can be used in the monitoring system and water management to ameliorate the air supply humidity. However, the good humid molar air flow monitoring of the PEMFC has not been highlighted in the literature. Accordingly, further research into a specific control algorithm for this model is advised to implement an intelligent water management controller.
Table 2. Previous works on PEMFC diagnosis
| Authors | Non-model based method | Input variable | Output variable | Fault type | On/off line |
| Jiaping Xie [2] | Support Vector Machine | Current density, inlet pressure, cell temperature, gas stoichiometry, Inlet humidity | Rm, Rct, Rw, Tw, Pw, Tdl, Pdl | flooding, membrane drying and air starvation | online fault diagnosis |
| Ali.Mohammadi [7] | Failure modes classification both for DCDDC converter and PEMFC based on ANN | Temperatur,pressure,humidity | FC stack voltage | flooding, drying. | online |
| Fatima Zohra Arama [8] | Neural networks technique | Relative humidity, operating time, frequency range | R(int) at high frequency, biasing resistance at low frequency | flooding or drying | Off line |
| Khaled Mammar [10] | Application of Adaptive Neuro-Fuzzy system (ANFIS) | impedance resistance HF and LF humidity | Relative humidity | flooding, drying | Off line |
| Kui Chen [11] | grey neural network model | load current, temperature hydrogen pressure inlet of RH | voltage of PEMMFC | Degradation prediction (drying or flooding) | online |
| This study | neural networks technique | operating time,q(win) | Rm, Rp, Rd, FCOV | Floodin,normal operation, drying | Off line |
Among the most common methods used to characterize and analyze electrochemical devices is the electrochemical impedance spectroscopy method. Many researchers have used the (EIS) to illustrate the impedance response features by injecting disturbed alternative current into PEMFC, which allows to extract the parameters of Randles model from the obtained signal, (e.g., double layer capacity, charge transfer resistance, membrane resistance, and the constant phase elements (CPE), etc.). The most applications of (EIS) for diagnosing and monitoring the lifetime of fuel cell are based on a Ran- dles circuit measurement. Figure2 displays an equivalent circuit of PEMFC model.
Figure 2. Equivalent circuit of PEMFC model [18]
The equivalent impedance of Randles circuit is calculated as: [10;18;19].
$Z_{c e l l}(j w)=R_m+\frac{1}{Z_{C P E} \quad+\left(1 /\left(R_P+Z_W\right)\right)}$ (4)
The Warburg impedance is represented as follows:
$Z_W(j w)=R_d \frac{\tanh \sqrt{\left(j w\left(\tau_d\right)\right)}}{C \sqrt{\tau_d}}$ (5)
The constant (τd), (Rd) and impedance of constant phase element (ZCPE) are expressed as follows, respectively:
$\left\{\begin{array}{c}\tau_d=\frac{\delta^2}{D} \\ R_d=\frac{R T \delta}{n^2 F^2 S C D} \\ Z_{C P E}(j w)=\frac{1}{Q(j w)^\alpha}\end{array}\right.$ (6)
Accordingly, the PEM fuel cell impedance is given by the following equation [18] :
$Z_T(j w)=R_m+\frac{1}{Q(j w)^\alpha+\left(1 /\left(R_P+Z_W\right)\right)}$ (7)
where $\alpha=0.5$ when the CPE is the Warburg impedance, and $\alpha=1$ for ideal capacitance [20;21].
In order to study the EIS resistances, we focus on the analysis of the Nyquist plot. The equivalent circuit of Randles-type is used to analyze the impedance response at low and high-frequency in semicircle of the Nyquist plot.
More details about these parameters are given in Table 3.
Table 3. Physical parameters of fuel cell in different state [24]
|
Test |
Time[s] |
$\operatorname{Rm}[\Omega]$ |
$\operatorname{Rp}[\Omega]$ |
$\operatorname{Rd}[\Omega]$ |
Mean cell voltage [V] |
|
1 (Normal state) |
500 |
0.00398 |
0.0080 |
0.0034 |
0.6989 |
|
2 |
1000 |
0.00406 |
0.00123 |
0.0094 |
0.6238 |
|
3 |
1600 |
0.00400 |
0.0147 |
0.0172 |
0.5850 |
|
4 |
3800 |
0.00416 |
0.0163 |
0.0312 |
0.53 |
|
5 |
3980 |
0.00512 |
0.0099 |
0.0051 |
0.526 |
|
6 |
5400 |
0.00685 |
0.0108 |
0.0056 |
0.591 |
|
7 |
6700 |
0.00880 |
0.0130 |
0.0101 |
0.56 |
4.1 The ANN model
The systematic diagnostic approaches supported by artificial intelligence are of great importance in the field of fuel cell development. Among these methods, we have the ANN, which is inspired by learning how the human brain works. In the fuel cell system, we have several of inputs and outputs. Through the received inputs/outputs relationships the ANN model helps to diagnose the fuel cell status in a fast way based on three steps: learning, classification and testing. Typically, this process can be trained the data for any system to learn the ANN model without any physical equations.
To ensure the connection between the first and third layer the neurons of the hidden layer are related by the weights using a well-defined transfer function. In this work, the transfer function of hidden layer is determined by the following equation:
$f(u)=\frac{1}{1+e^{-(d . u)}}$ (8)
where the slope of the curve is represented by d and u presents the equation of hidden layer’s input [22;23] as defined by the following relation:
$u=\sum_{j=1}^n\left(W_{i j} X_i+b_i\right)$ (9)
The equation of output layer is represented as follow [23]:
$y_K u=\sum_{j=1}^N\left(w_{i j}^0 u_i+b_i\right)=\sum_{j=1}^N w_{i j}^0 f\left(\sum_{j=1}^N\left(w_{i j} x_i+b_i\right)\right)$ (10)
where W indicates the weights of output layer.
4.2 ANN architecture
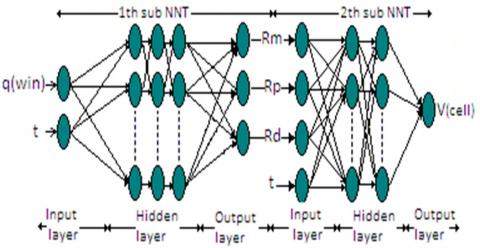
The ANN model is a hybrid model that integrates two trategies based on Randles’ physical model with CPE and the fuel cell output voltage (FCOV) patterns. Therefore, this model is able to identify the hydration state (flooding and drying) and diagnose PEMFC failure modes across statistical analysis of Rm, Rp, Rd and FCOV losses. The combination of two sub-NNT models provides the reliability and capability of the neuron network system. The proposed method can give free rein to different models get the best performance to be practical in the industrial applications.
Figure 3. Schematic diagram of ANN model.
Figure 3 shows the architecture of the neuron network used in this study. The first sub-NNT model is trained by the experimental data of Fouquet [24]. The outputs of this sub-NNT are combined to produce the output of the second sub-NNT. The input of the first NNT model is bound to the molar flow air in the inlet of the fuel cell (qwin) and the operation time. The hidden layer contains three under-layers (10, 5, 5) neuron for each hidden layer, respectively. In addition, three neurons in the outputs layer indicate the Rm, Rp and Rdvalues. The activation functions of each hidden layer are tansig, purelin and purelin, respectively. The neurons of output layer for the first NNT model are bound to the input layer of the second NNT model and the fourth input represents the operation time. The hidden layer contains two under-layers (5, 4) neuron for each hidden layers, respectively. The output layer represents the V(CELL) to describe the (SOH) of the fuel cell. The logsig and tansig functions are used to estimate the parameters of each layer, respectively. The ANN model parameters are tabulated in Table 3. Thus, in this paper, the ANN is trained by the experimental samples to obtain the failure diagnosis sensor. The test samples are then used to confirm the accuracy of the fault diagnosis model. Through this method, the accuracy of the state of health is can be extremely increased.
We have proceeded to illustrate the values of experimental model from [19;24] as shown in the Table 4.
Table 4. ANN Parameters and training
|
Parameters |
ANN 1 |
ANN 2 |
|
|
Imput |
2 |
4 |
|
|
Output |
3 |
1 |
|
|
Nbr of neuron |
HL 1 |
10 |
5 |
|
HL 2 |
5 |
4 |
|
|
HL 3 |
5 |
/ |
|
|
Activation fonctions |
HL 1 |
tansig |
logsig |
|
HL 2 |
purelin |
Logsig |
|
|
HL 3 |
purelin |
/ |
|
|
Output layer |
tansig |
tansig |
|
|
Epouch |
1000 |
664 |
|
|
Performance |
3.73*10-08 |
9.99*10-7 |
|
|
Gradiant |
1.31*10-06 |
2.79*10-6 |
|
|
Mu |
1.00*10-09 |
1.00*10-8 |
|
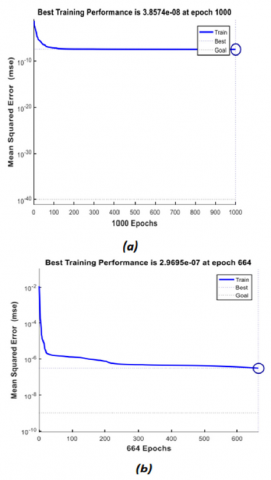
Figure 4. a) The performance of the first sub NNT training. b) The performance of the second sub NNT training
Figure 5. a) Linear regression by first sub ANN model. b) Linear regression by second sub ANN model
Figure 6. a) The output errors of the first sub NNT. b) The output errors of the second sub NNT
Figure 4 shows the performance of the ANN training and the number of epochs for each ANN model, while Figure 5 presents the relationship between the experimental results and that obtained by the NNT model Figure 6 shows the output errors of each ANN model, where the output errors is about 10−7, this proves the ANN model learning reliability.
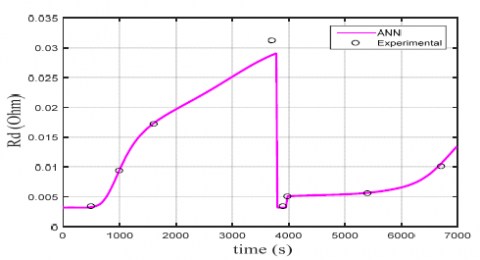
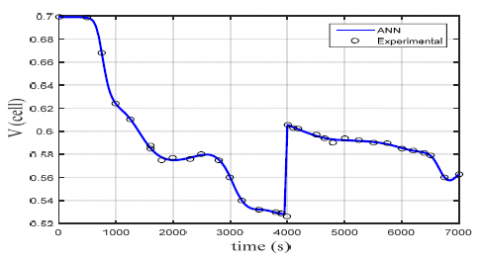
Through the proposed method, we give (qwin) variation during deferent time’s period under Matlab for each simulation, from 0 to 500 s at normal operating conditions, from 500 s to 3800 s at flooding conditions and from 4000 s to 8000 s at drying conditions, where we can observe the effects of this variation in the parameters of Randles model obtained by the first sub-NNT. Figure 7 a to d displays and compares the results attained using the first sub-ANN as following:
Between the two intervals [0 - 500 s] and [3800 - 4000 s], the parameters of Randles model are constant which means the system is operating under nor- mal operating conditions while the qwin remains constant at (2 ∗ 10−5)mol/s.
During the flooding state the value of qwin is 5mol/s inside the PEM fuel cell. We notice that the values of Rp and Rd increase within 500 to 3800 s.
An increase gradually of the (Rm, Rp and Rd) could be seen after 4000 s, during this phase qwin is decreased to 0.2 mol/s in order to illustrate the effect of membrane dryness.
Figure 7e illustrates the fuel cell voltage during each time period. The fuel cell voltage’s response is given by secondsub-ANN to display the vari- ations effect of the parameters of Randles model for the state of health of the fuel cell. In the period of 0 s to 500 s (i.e., normal conditions), we can observe that the fuel cell’s voltage remains constant, besides, the Resistances of Randles model conserve its values, this means the effectiveness of the fuel cell.
(a)
(b)
(c)
(d)
(e)
Figure 7. a-d) parameters of Randles model during different state. e) fuel cell voltage during different state
In addition, we find a drop in the fuel cell voltage during the second test (flooding case). The drop voltage refers the increase of membrane ionic conductivity as shown in Figure 7 e. Moreover, within 4000 s the progressive voltage drop is clearly visible, which correlates with a gradual increase in (Rm, Rp and Rd).
Depending on these results, the reduction of the voltage is directly related to water content accumulate inside the channels of the Fuel Cell owing to the affection of water content on the membrane conductivity. When the RH increases, the conductivity of membrane also increases, consequently the slow decrease in the FC voltage is influenced by the flood phase.
To sum up, the proposed method could estimate the state of hydration based on the relative humidity variation into PEMFC and the change of the randles model parameters. Therefore, the used artificial neural network in this study helps to know how humidity affects fuel cell voltage.
A summary of the most relevant criteria of different studies for PEMFC diagnostic compared to the suggested method is given in Table 5, The sug- gested model in this study provides many advantages compared to other techniques that require a large number of database and instruments, and this justified by the comparative analysis in term of fast accurate prognostic, quick to implement and low cost.
Table 5. Comparison of related and recent study on PEMFC diagnosis
|
Approaches |
Idea |
Hard/ software |
Advantages |
Drawbacks |
Ref |
|
Neural networks technique. |
✓ NNT model has been proposed to estimate (RNNT int, RNNT pol) in both drying and flooding conditions. |
✓ NNT learning phase ✓ Data-based collection performed by a backpropagation algorithm |
✓ Its prediction is accurate. |
✓ It requires a large number of data. |
(8) |
|
Invasive diagnostic technique, using a new measurement technique of the local magnetic field. |
✓ The internal magnetic field sensors are inserted into the end plates of the stack. ✓ From the measurements of the fields, the current density is calculated directly. ✓ Magnetic field provides an image of the MEA current distribution. |
✓ Film-formed gas temperature sensor ✓ S++ Simulation Services |
✓ The measurement is carried out as close as possible to the fault. ✓ The exploitation is generally direct |
✓ Inserting the sensors into the PEMFC stack changes its intrinsic behaviour |
(25) |
|
The in-situ diagnostic applications, by measuring the magnetic field and variations in the voltage. |
✓ This technique has been validated on a 300 watt stack. ✓ 15 tri-axis sensors were inserted every 4 cells. ✓ The current density was calculated from the measurement of the magnetic field by the PEMFC included probes |
✓ Magnetic field sensors inserted into the cooling channels of the PEMFC stack |
✓ Non-destructive and enabling non-contact measurements. |
✓ The difficult to distinguish between the effect of the fault and the effect of the presence of the sensor |
(26) |
|
Total Harmonic Distortion Analysis (AVL THDA). |
✓ The technology of (AVL Total Harmonic Distortion) monitors changes in the voltage of a single cell without the need for V (cell) measurements. |
✓ Databases of up to several hundred voltage channels. |
✓ Significantly reduces wiring ✓ contacting and hardware required |
✓ There are no conceptual changes are necessary for already expended stack designs to perform this system. |
(27) |
|
Implementation of electrochemical impedance spectroscopy (EIS) function in power transformer management |
✓ The proposed EIS is incorporated into this technology for improved diagnosis and control. ✓ Real time EIS was used. |
✓ The EIS is achieved by the power converter. |
✓ Monitor variations using EIS results for onboard diagnostics or control improvement. |
✓ Computationally expensive. ✓ Requires additional equipment for EIS measurements. |
(28) |
|
The acoustic emission AE technique. |
✓ EIS and AE measurements were performed while drying of the Nafion samples. ✓ The obtained electrochemical parameters measurements produce monotonic exponential responses after water loss. |
✓ Piezoelectric transducer. ✓ Specific measuring instruments. |
✓ Non-destructive promising method for fuel cell component analysis |
✓ Requires large database resulting from experimental EIS use of PEMFC |
(29) |
|
AC impedance technique in the diagnosis of PEMFC |
✓ Both in situ and ex situ impedance measurements are discussed, examined and presented in typical EIS in various common scenarios. |
✓ Potentiostatic. ✓ measurements at different modes of gas-feeding. ✓ galvanostatic measurements. |
✓ A fast AC impedance technique is briefly examined. |
✓ The impedance of a single electrode cannot be obtained directly, this disadvantage has little effect in most cases. |
(30) |
|
The EIS and polarization curves method using a Neural networks technique. |
✓ The ANN model in this study used a combined strategy based on EIS measurement and the stack voltage singularity measurement and classification. ✓ Estimating and diagnosing the health status of a fuel cell in both case flooding and drying out uses artificial intelligence technology. |
✓ NNT learning phase and data- based collection were performed by backpropagation algorithm. |
✓ Fast prognostic tool to predict the output voltage loss in the fuel cell. ✓ The neural network model proposed could be useful to predict the degradation caused by poor water management of the fuel cell (i.e. Flooding, Drying). ✓ Easy, quick to implement ✓ low cost. |
✓ It is recommended that further studies develop a more specific control algorithm for this model to implement an intelligent water management controller with potential targets for reconfiguration control and/or preventive maintenance to be adapted into the technical challenges. |
Propo sed metho d |
Accurate the state of health is critical in practical applications which is important to avoid the frequent mistakes that occur owing to poor water management inside the fuel cell membrane. Therefore, in this paper, we have developed a new sensor model using AI technology to determine the overall performance and resistance to PEMFC losses during different oper- ating conditions. Based on the experimental data extracted from [24], the first sub-ANN model is trained to obtain the parameters of the Randles model, and based on the achieved outputs; the second neuralnetwork model is trained to obtain the fuel cell voltage output. Moreover, we can use the combination between the analysis of the parameters of Randles model and the drop output voltage pattern of the fuel cell to improve SOH diagnosis in both cases: flooding and drying. Overall, our model can contribute to get good diagnosis without the requirement for costly tools. Moreover, the pro- posed method will be considered for predicting the degradation of PEMFCs in future research works. Further studies needs tobe addressed to develop a more specific control algorithm for this model to implement an intelligent water management controller based on another method of estimating overall performance and resistance to PEMFC losses during different operating con- ditions, with potential targets for reconfiguration control and/or preventive maintenance.
|
ANN |
Artificial neuron network |
|
bi |
bias vector of neural network |
|
CPE |
identifier Constant Phase Elements |
|
D |
diffusion coefficient |
|
F |
Faraday constant (A s mol-(1)) |
|
FCOV |
fuel cell output voltage |
|
N |
number of electrons |
|
Q |
parameter of the CPE |
|
qwin |
molar flow air in the inlet (mol/s) |
|
R |
perfect gas constant (J mol-(1) K-(1)) |
|
Rd |
electrical resistance [Ohm] |
|
RH |
relative humidity |
|
Rm |
membrane resistance [Ohm] |
|
Rp |
polarisation resistance [Ohm] |
|
S |
active area (m2) |
|
T |
Temperature (K) |
|
tm |
membrane thickness (m) |
|
u |
equation of hidden layer’s input |
|
V cel |
cell voltage (V) |
|
W |
weights of ANN output layer |
|
Z |
fuel cell impedance [Ohm] |
|
ZCPE |
CPE impedance |
|
Zw |
Warburg impedance [Ohm] |
|
GREEK LETTERS |
|
|
α |
power of the CPE |
|
δ |
diffusion layer width (m) |
|
τ |
the time constant of diffusion |
|
d |
(s) |
|
w |
pulsation (rad s-(1)) |
[1] Y. Wang, B. Seo, B. Wang, N. Zamel, K. Jiao, X. C. Adroher, Funda- mentals, materials, and machine learning of polymer electrolyte mem- brane fuel cell technology, Energy and AI 1 (2020) 100014. URL https://doi.org/10.1016/j.egyai.2020.100014
[2] J. Xie, C. Wang, W. Zhu, H. Yuan, A multi-stage fault diagnosis method for proton exchange membrane fuel cell based on support vector machine with binary tree, Energies 14 (20) (2021) 6526. URL https://doi.org/10.3390/en14206526
[3] A. Saadi, M. Becherif, D. Hissel, H. S. Ramadan, Dynamic modeling and experimental analysis of pemfcs: A comparative study, International Journal of Hydrogen Energy 42 (2) (2017) 1544–1557. URL https://doi.org/10.1016/j.ijhydene.2016.07.180
[4] H. Pourrahmani, et al., Water management of the proton exchange mem- brane fuel cells: Optimizing the effect of microstructural properties on the gas diffusion layer liquid removal, Energy 256 (2022) 124712. URL https://doi.org/10.1016/j.energy.2022.124712
[5] A. Abbou, A. El Hassnaoui, A novel approach for predicting pemfc in varying ambient conditions by using a transient search optimization algorithm based on a semi-empirical model, AIMS Energy 10 (2) (2022) 254–272. URL https://doi.org/10.3934/energy.2022014
[6] J. Y. Park, I. S. Lim, E. J. Choi, M. S. Kim, Fault diagnosis of thermal management system in a polymer electrolyte membrane fuel cell, Energy 214 (2021) 119062. URL https://doi.org/10.1016/j.energy.2020.119062
[7] A. Mohammadi, D. Guilbert, A. Gaillard, D. Bouquain, D. Khaburi, A. Djerdir, Faults diagnosis between pem fuel cell and dc/dc converter using neural networks for automotive applications, in: IECON 2013-39th Annual Conference of the IEEE Industrial Electronics Society, IEEE, 2013, pp. 8186–8191. URL https://doi.org/10.1109/IECON.2013.6700503
[8] F. Z. Arama, K. Mammar, S. Laribi, A. Necaibia, T. Ghaitaoui, Im- plementation of sensor based on neural networks technique to predict the pem fuel cell hydration state, Journal of Energy Storage 27 (2020) 101051. URL https://doi.org/10.1016/j.est.2019.101051
[9] R. Silva, R. Gouriveau, S. Jemei, D. Hissel, L. Boulon, K. Agbossou, N. Y. Steiner, Proton exchange membrane fuel cell degradation pre- diction based on adaptive neuro-fuzzy inference systems, International Journal of Hydrogen Energy 39 (21) (2014) 11128–11144. URL https://doi.org/10.1016/j.ijhydene.2014.05.005
[10] K. Mammar, S. Laribi, Application of adaptive neurofuzzy inference system techniques to predict water activity in proton exchange mem- brane fuel cell, Journal of Electrochemical Energy Conversion and Stor- age 15 (4) (2018). URL https://doi.org/10.1115/1.4040058
[11] K. Chen, S. Laghrouche, A. Djerdir, Degradation prediction of proton exchange membrane fuel cell based on grey neural network model and particle swarm optimization, Energy Conversion and Management 195 (2019) 810–818. URL https://doi.org/10.1016/j.enconman.2019.05.045
[12] Z. Tang, Q.-A. Huang, Y.-J. Wang, F. Zhang, W. Li, A. Li, L. Zhang, J. Zhang, Recent progress in the use of electrochemical impedance spec- troscopy for the measurement, monitoring, diagnosis and optimization of proton exchange membrane fuel cell performance, Journal of Power Sources 468 (2020) 228361. URL https://doi.org/10.1016/j.jpowsour.2020.228361
[13] I. J. Halvorsen, I. Pivac, D. Bezmalinovi´c, F. Barbir, F. Zenith, Elec- trochemical low-frequency impedance spectroscopy algorithm for diag- nostics of pem fuel cell degradation, International Journal of Hydrogen Energy 45 (2) (2020) 1325–1334. URL https://doi.org/10.1016/j.ijhydene.2019.04.004
[14] X. Zhang, T. Zhang, H. Chen, Y. Cao, A review of online electrochemical diagnostic methods of on-board proton exchange membrane fuel cells, Applied Energy 286 (2021) 116481. URL https://doi.org/10.1016/j.apenergy.2021.116481
[15] R.-H. Lin, X.-N. Xi, P.-N. Wang, B.-D. Wu, S.-M. Tian, Review on hydrogen fuel cell condition monitoring and prediction methods, Inter- national Journal of Hydrogen Energy 44 (11) (2019) 5488–5498. URL https://doi.org/10.1016/j.ijhydene.2018.09.085
[16] A. Sorrentino, K. Sundmacher, T. Vidakovic-Koch, Polymer electrolyte fuel cell degradation mechanisms and their diagnosis by frequency re- sponse analysis methods: a review, Energies 13 (21) (2020) 5825. URL https://doi.org/10.3390/en13215825
[17] B. Najafi, P. Bonomi, A. Casalegno, F. Rinaldi, A. Baricci, Rapid fault diagnosis of pem fuel cells through optimal electrochemical impedance spectroscopy tests, Energies 13 (14) (2020) 3643. URL https://doi.org/10.3390/en13143643
[18] C. Restrepo, T. Konjedic, J. Calvente, R. Giral, A review of the main power electronics’ advances in order to ensure efficient operation and durability of pemfcs, Automatika: ˇcasopis za automatiku, mjerenje, elektroniku, raˇcunarstvo i komunikacije 53(2) (2012) 184–198. URL https://doi.org/10.7305/automatika.53-2.192
[19] N. Fouquet, Real time model-based monitoring of a pem fuel cell flooding and drying out, in: 2010 IEEE Vehicle Power and Propulsion Confer- ence, IEEE, 2010, pp. 1–8. URL https://doi.org/10.1109/VPPC.2010.5729160
[20] H. Kahia, S. Aicha, D. Herbadji, A. Herbadji, S. Bedda, Neural network based diagnostic of pem fuel cell, Journal of New Materials for Electro- chemical Systems 23 (4) (2020) 225–234. URL https://doi.org/10.14447/jnmes.v23i4.a0
[21] K. Mammar, B. Ould-Bouamama, Analysis of impedance for water man- agement in proton exchange membrane fuel cells using factorial design of experiment (doe) methodology, in: ASME International Mechanical Engineering Congress and Exposition, Vol. 56291, American Society of Mechanical Engineers, 2013, p. V06BT07A018. URL https://doi.org/10.1115/IMECE2013-63475
[22] M. Shao, X.-J. Zhu, H.-F. Cao, H.-F. Shen, An artificial neural network ensemble method for fault diagnosis of proton exchange membrane fuel cell system, Energy 67 (2014) 268–275. URL https://doi.org/10.1016/j.energy.2014.01.079
[23] S. Laribi, K. Mammar, M. Hamouda, Y. Sahli, Impedance model for diagnosis of water management in fuel cells using artificial neural net- works methodology, International Journal of Hydrogen Energy 41 (38) (2016) 17093–17101. URL https://doi.org/10.1016/j.ijhydene.2016.07.099
[24] N. Fouquet, C. Doulet, C. Nouillant, G. Dauphin-Tanguy, B. Ould- Bouamama, Model based pem fuel cell state-of-health monitoring via ac impedance measurements, Journal of Power Sources 159 (2) (2006) 905–913. URL https://doi.org/10.1016/j.jpowsour.2005.11.035
[25] D. Candusso, J. Poirot-Crouvezier, B. Bador, E. Rulli`ere, R. Soulier, J. Voyant, Determination of current density distribution in proton ex- change membrane fuel cells, The European Physical Journal-Applied Physics 25 (1) (2004) 67–74. URL https://doi.org/10.1051/epjap:2003079
[26] Y. Akimoto, K. Okajima, et al., Experimental study of non-destructive approach on pemfc stack using tri-axis magnetic sensor probe, Journal of Power and Energy Engineering 3 (03) (2015) 1. URL https://doi.org/10.4236/jpee.2015.33001
[27] E. Ramschak, V. Peinecke, P. Prenninger, T. Schaffer, W. Baumgartner, V. Hacker, Online stack monitoring tool for dynamically and stationary operated fuel cell systems, Fuel Cells Bulletin 2006 (10) (2006) 12–15. URL https://doi.org/10.1016/S1464-2859(06)71207-X
[28] D. Depernet, A. Narjiss, F. Gustin, D. Hissel, M.-C. P´era, Integration of electrochemical impedance spectroscopy functionality in proton ex- change membrane fuel cell power converter, International Journal of Hydrogen Energy 41 (11) (2016) 5378–5388. URL https://doi.org/10.1016/j.ijhydene.2016.02.010
[29] B. Legros, P.-X. Thivel, Y. Bultel, M. Boinet, R. Nogueira, Electro- chemical impedance and acoustic emission survey of water desorption in nafion membranes, Electrochemical and Solid-State Letters 12 (7) (2009) B116. URL https://doi.org/10.1149/1.3131728
[30] X. Yuan, H. Wang, J. C. Sun, J. Zhang, Ac impedance technique in pem fuel cell diagnosis—a review, International Journal of Hydrogen Energy 32 (17) (2007) 4365–4380. URL https://doi.org/10.1016/j.ijhydene.2007.05.036