
Ibrahim S. El-Hallag* | Mohamed A. Ghanem | El-Sayed H. El-Mossalamy | Ahmed R. Tartour**
© 2022 IIETA. This article is published by IIETA and is licensed under the CC BY 4.0 license (http://creativecommons.org/licenses/by/4.0/).
OPEN ACCESS
The electrochemical quantification of catechol (CC) was performed via cyclic voltammetry (CV), convolution-deconvolution voltammetry, and differential pulse voltammetry (DPV) at nanostructured mesoporous platinum film electrochemically deposited from a hexagonal liquid crystalline template of C16EO8 surfactant in 1.0 M HClO4.The cyclic voltammograms of catechol produced one oxidative peak in the forward sweep of potential coupled with a reductive peak on the reverse sweep potential. The effect of catechol concentration was examined using the various electrochemical methods mentioned before. The modified platinum electrode exhibits good sensitivity for the determination of catechol compound in 1.0 M HClO4. The best performance was found for i-t curve method developed from cyclic voltammetry of CC. It manifests a linear peak current response over the concentration range of 3 to 50 μM, with a detection limit of 2.11 μM and a quantification limit of 7.04 μM confirming the accuracy and sensitivity of this fast and simple method.
Catechol, Mesoporous platinum electrode, Quantification, Cyclic voltammetry, Convolution-deconvolution voltammetry
As one of the fast, economical and simple electrochemical techniques, voltammetry represents vital tool of quantitative and qualitative analysis. Recently, the design and construction of electrochemical sensors attract more interests in the field of analytical and bioanalytical electrochemistry. The developed sensors are normally based on the structure of a working electrode [1,2]. Catechol (CC) represents a starting precursor in the synthesis of organic compounds [3]. It has been broadly used in many applications involving production of pesticides, perfumes and pharmaceuticals [4]. In spite of its importance, CC has been demonstrated as toxic and carcinogenic material. Also, due to low degradability it has bad impacts in the ecological environment [5]. Exposure to CC for long times can cause a rise of blood pressure and depression of central nervous system in animals [6]. So, there is a great necessity to develop sensitive devices for efficient detection of low level concentrations of CC in environmental samples. Numerous analytical methods have been used for the sensitive detection of CC such as high-performance liquid chromatography, gas chromatography, mass spectrometry, flow injection analysis and electroanalytical methods [7-9] Simplicity, and low cost represent the points of strength of the electrochemical methods over the aforementioned analytical methods [10]. It is well known that conventional plain electrodes display a poor selectivity and sensitivity along with fouling of signals towards detection of CC [10,12]. Modification of the conventional working electrodes is a smart method to construct CC sensors having high selectivity, low oxidation potential and high sensitivity. One of promising methods to modify the electrode is the electrochemical deposition of nanostructured mesoporous metal films. These mesoporous metal films can be obtained with the aid of a template formed by hexagonal lyotropic liquid crystalline substances [12-18]. The mesoporous metal layers are of a very high surface area (roughness) due to presence of a highly arranged hexagonal array of cylindrical nanopores. Electrodeposition conditions and template mixtures represent the key parameters for determining pore radius and separation distance which are usually in the range of 1–10 nm. Nanoarchitectured mesoporous Pt layer has brought much attention because of its uses in electrocatalysis [19-22].
So, the main aim of this study was to design a sensitive sensor for the detection, quantification and investigation of CC at a modified mesoporous platinum electrode in 1M HClO4 using cyclic voltammetry-based i-t, convolution- deconvolution techniques. Accordingly, we present for the first time the quantitative determination of CC using CV-based i-t curves and convolution-deconvolution voltammetry methods. The modified platinum electrode shows voltammetric sensing action with a good performance in the determining the CC. The availability of the sensing action was calculated, such as a linear range, limit of detection (LOD), and limit of quantification (LOQ) by various voltammetric techniques. Also, in this article we report the electrochemical oxidation behavior of CC at the nanostructured mesoporous platinum electrode in acid solution.
2.1 Reagents
Chemicals were obtained in analytical grade and used without further purification. HClO4 and catechol (CC) were purchased from Aldrich. De-ionized and filtered water was taken from an Elga water purification system.
2.2 Instrumentation
Electrochemical experiments were carried out in a conventional three-electrode cell using a micro-Autolab type III system (Eco Chemie, NL). A saturated calomel electrode (SCE) was used as the reference electrode and about 1 cm2 platinum gauze as the counter electrode. The working electrode was a 1 mm diameter Pt disc with surface area of 7.85 × 10⁻³ cm2. All the electrochemical experiments were performed at room temperature (23 ± 2 ℃).
2.3 Preparation of the mesoporous platinum film
According to the method established in literature [14], a hexagonal liquid crystalline plating template mixture was prepared by dissolving hexachloroplatinic acid HCPA (20 wt%) in distilled water (40 wt%). The resulting solution was mixed with melted C16EO8 surfactant (40 wt%) at 45℃. Prior to the electrodeposition of the mesoporous Pt film, the working polycrystalline Pt disc electrode with a 1 mm diameter was polished using 1µm alumina and washed with water followed by electrochemical cleaning by sweeping in 2 M H2SO4 in a potential range from + 0.25 to +1.4 V vs. SCE for 20 cycles at a scan rate of 100 mV s-1. The mesoporous nanostructured platinum films were electrochemically deposited from the template mixture at a constant potential of 100 mV vs. SCE. After electrodeposition, the template mixture was removed from the mesoporous Pt films by soaking overnight in agitated water at 40℃. This cleaning process was also performed before each experiment afterward.
3.1 Cyclic voltammetry behavior of catechol at mesoporous Pt electrode
In order to study the electrochemical behavior of the catechol in acidic media, cyclic voltammograms have been recorded at mesoporous Pt electrode for 3 µM catechol in 1.0 M HClO4 solution at scan speed of 50 mV s-1.As shown in Fig. 1,the anodic and cathodic peak potentials located at 570 and 497 mV vs. SCE, respectively. The ΔEp of catechol was found to be 73 mV, which clearly indicates that catechol oxidation is moderate fast charge transfer kinetics at the mesoporous electrode.
Figure 2 shows a set of representative cyclic voltammograms for CC at the mesoporous platinum electrode in a 1.0 M HClO4 containing different concentrations of catechol (3-50 µM). The ratio of the cathodic peak current to the anodic peak current, ipc/ipa is about 0.95 which is very close to unity indicating the stability of the 1,2 benzoquinone oxidation product in the solution.
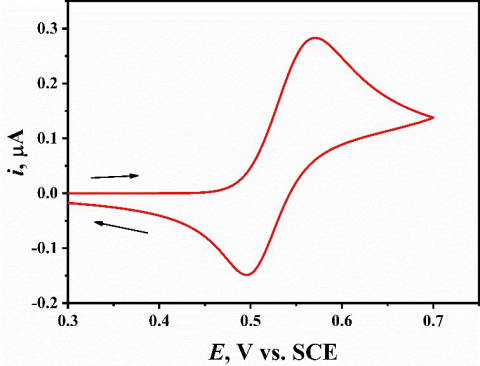
Figure 1. Cyclic voltammetry at a scan speed of 50 mV s-1 for 3µM catechol in 1.0 M HClO4 at the nanostructured mesoporous Pt electrode
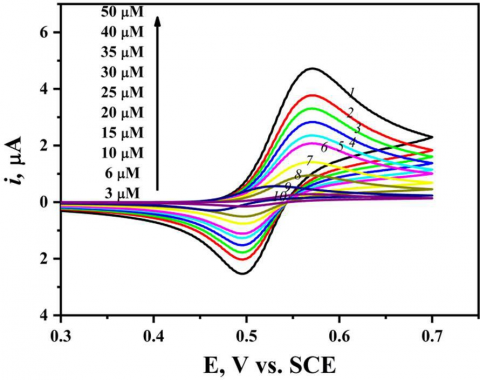
Figure 2. Cyclic voltammetry of catechol at different concentrations, scan speed 50 mVs-1 in 1.0 M HClO4 at nanostructured mesoporous Pt electrode
Figure 2 displays the effect of increasing of CC concentration from 3 µM to 50 µM on the corresponding CV recorded at mesoporous Pt electrode in 0.1M HClO4with sweep rate of 50 mV s-1. It was observed that the anodic and cathodic peak currents go up with the increase in CC concentration and the peak separation ΔEp increases slightly. For the electrochemical method characterization, the limit of detection (LOD), determination coefficient (R2), and limit of quantification (LOQ) were calculated using ten data points according to Miller and Miller method [23]. The calibration curve of catechol at different concentrations is represented in Fig. 3. As indicated by Fig. 3, the anodic peak currents response ipa(peak height) and the analyte (catechol) concentrations are linearly dependent within the 3-50 µM concentration, following the linear regression Eqs. 1 and 2 [24]:
y = m x + z (1)
where, m is the slope of the regression line and z is the point at which the line crosses the y-axis (y intercept). In our case, y-axis represents the anodic peak current (ipa, μA) and x-axis is the analyte concentrations (C, μM), then from Fig. 3 we got:
iPa (μA)= 0.09224 C (µM) + 0.029 (2)
Herein, the standard deviation (SD) of the linear regression for the anodic peak current vs. analyte concentrations stated on Fig. 3 equals 8.08×10⁻². Consequently, the calculated SD value was then used to determine the limits of detection (LOD) and quantification (LOQ) values as the following Eq.3 [25].
LOD or LOQ = F x SD/m (3)
where, m is the slope, SD is the standard deviation, and F is a factor of 3 and 10 for LOD and LOQ, respectively. To conclude, according to Eq. 2 and Fig. 3 the value of R2 is 0.99857 which shows the excellent linear fitting within the studied concentration range. Moreover, the mesoporous Pt electrode exhibits good LOD and LOQ for CC having the values 2.6 and 8.7 µM, respectively.
A comparison of the mesoporous Pt electrode with other modified working electrodes for the magnitude of the LOD (µM) established in literature was summarized in Table 1 [25- 30].
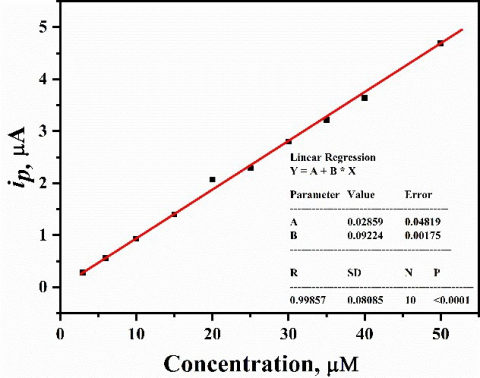
Figure 3. Graph of Ipa (@ 0.57 V) versus catechol concentration built from Fig. 2
3.2 Convolution voltammetric analysis of CC at mesoporous Pt electrode
Convolution voltammetry mainly depends on a mathematical transformation (convolution) of a voltammetric experiment. The technique deals with quantities directly related to the concentration of electroactive species at the electrode surface. The convolution voltammetric method is based on the convolution principle to convert cyclic voltammogram into forms analogous to the steady-state curves [31,32]. In cases diffusion-controlled mass transfer of active species, the current reaches its limiting value, which is independent of the excitation signal. Theoretically, the convoluted current Il(t) should reach a limiting value Ilim, indicated in the data by the presence of a flat plateau, as described by Eq. 4.
Ilim = nFACD1/2 (4)
where, n is number of transferred electrons, F is the Faraday’s constant (96485 C mol-1), A is surface area of electrode, D is diffusion coefficient of the electroactive species, C is the bulk concentration of the electroactive species. As shown from Eq. 4 and Fig. 4, the resulting plateau (Ilim) is flat and independent of the scan rate used. So that, the observed transformation of the current remains constant leading to the accuracy of Ilim determination.

Figure 4. Convolution voltammetry of catechol at different concentrations, scan speed 50 mVs-1 in 1.0 M HClO4 at nanostructured mesoporous Pt electrode
The scale on the Y axis represents $C^s(t) n F A D^{1 / 2}$, where $C^S(t)$ is the concentration of the product of the electron transfer step on the surface of the electrode. Fig. 4 shows the effect of increasing of the concentration of CC in the range 3-50 µM on the corresponding convolution voltammetry recorded at mesoporous Pt electrode in 0.1 M HClO4 with sweep rate of 50 mV s-1. It is noted that the anodic limiting current (Ilim) increases with increasing the concentration of CC. Here, the limit of detection (LOD), determination coefficient (R2), and limit of quantification (LOQ) of CC were calculated via convolution voltammetry [23]. The calibration curve of catechol at various concentrations is represented in Fig. 5. As indicated from Fig. 5, the anodic limiting currents response (Ilim height) and the analyte (catechol) concentrations are linearly dependent within the 3-50 µM concentration, following the linear regression Eq.1 and 4 [24]. In this case, y- axis represents the anodic limiting current (Ilim, μA s-1/2) and x-axis is the analyte concentrations (C, μM), then from Fig. 5 we got:
Ilim (μA s-1/2) = 0.13414 C (µM) + 0.05544 (5)
Herein, SD of the linear regression for the anodic limiting current vs. analyte concentrations stated on Fig. 5 equals 1.007x10⁻¹. Consequently, the calculated SD value was then used to determine the limits of detection (LOD) and quantification (LOQ) values according to Eq. 3 [25]. Based on Eq. 5 and Figure 5 the value of R2 is 0.99895 which shows the excellent linear fitting within the studied concentration range. Moreover, the mesoporous Pt electrode exhibits good LOD and LOQ for CC having the values 2.25 and 7.99 µM, respectively.

Figure 5. Graph of ilim (@ 0.68 V) versus catechol concentration built from Fig. 4
3.3 Deconvolution voltammetric analysis of CC at mesoporous Pt electrode
Deconvolution voltammetry actually suggest a range of tricks which may improve voltammetric measurements. It has the advantages of high sensitivity and high accuracy for the determination of species and provides a better baseline for the CC analysis. The deconvolution of the current (dI1/dt) as a function of potential of reversible process is defined as [33]:
ep= (dI1/dt) = nFAC√D aζ / (1+ζ)2 (6)
where, a = nνF/RT and ζ = exp [nF/RT(E – E0)] n is number of transferred electrons, F is the Faraday’s constant (96485 C mol-1), ν is the scan speed in mv s-1 A is surface area of electrode, D is diffusion coefficient of the electroactive species, C is the bulk concentration of the electroactive species, R is the universal gas constant, T is the absolute temperature, E is the electrode potential , and E0 is the standard electrode potential.
Goto and others [31-33] have derived an equation of a deconvolution peak current ep (dI1/dt) corresponding to a reversible reaction involving the soluble-soluble reaction (Eq. 7).
ep = (dI1/dt) = 0.297Aνn2F2 C√D/RT (7)
As indicated from Eqs. 6, 7 and Fig. 6 the resulting deconvolution voltammogram is peak like (ep) and is dependent on the concentration of the electroactive substance and sweep rate, which indicates that the current of deconvolution voltammetry increases with increasing the concentration of CC and the sweep rate which reflect the accuracy in the determination of the deconvolution peak height (ep). The presentation of (dI1/dt) vs. potential of CC is indicated in Fig. 6 and the peak height of deconvolution (ep) is described on the Y axis and the potential is described on X axis. Figure 7 shows the increasing of the concentration of CC in the range 3-50 µM at mesoporous Pt electrode in 0.1 M HClO4 at sweep rate of 50 mV s-1. It was noted that the deconvolution peak height current (ep) increases with increasing the concentration of CC. Here, the limit of detection (LOD), determination coefficient (R2), and limit of quantification (LOQ) of CC were calculated via deconvolution voltammetry [23]. The calibration curve of catechol at various concentrations is represented in Fig. 7. As indicated in Fig.7, the height of the deconvolution peak (ep) and the analyte (catechol) concentrations are linearly dependent within the 3-50 μM concentration, following the linear regression Eqs. 1 and 4 [24]. In this case, y-axis represents the peak height of deconvolution current (ep) and x-axis represents the analyte concentrations (C, μM), then from Fig. 7 we obtained:
ep = 0.08134 C (μM) + 0.02848 (8)
Herein, SD of the linear regression) for the anodic deconvolution peak height vs. analyte concentrations stated on Fig. 7 equals 5.967×10⁻². Consequently, the calculated SD value was then used to determine the limits of detection (LOD) and quantification (LOQ) value according to Eq. 3 [25]. Based on Eq.8 and Fig. 7 the value of R2 is 0.999 which shows the existence of positive correlation within the studied concentration range. Moreover, the mesoporous Pt electrode exhibited good LOD and LOQ for CC having the values 2.2 and 7.33 µM, respectively.
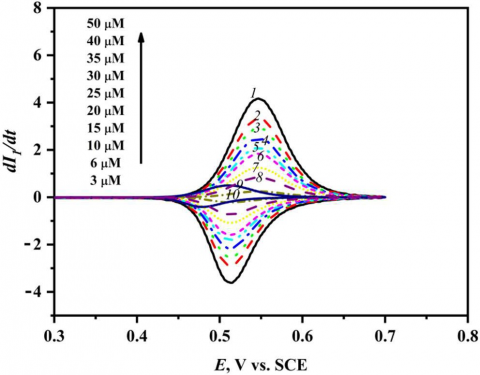
Figure 6. Deconvolution voltammetry of catechol at different concentrations, scan speed 50 mV s-1 in 1.0 M HClO4 at nanostructured mesoporous Pt electrode
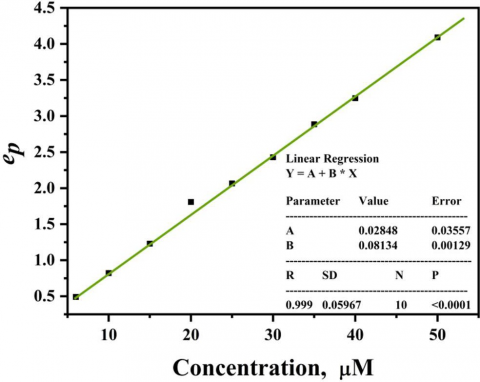
Figure 7. Graph of ep (@ positive maxima) versus catechol concentration built from Figure 6
3.4 Current-time curves built from CV for analysis of CC at mesoporous Pt electrode
Current-time curve arising from converting the cyclic voltammogram (i-E curve) into current-time curve and this conversion allows measuring the height of peak current in a simple and more accurate manner. Figure 8 displays i-t plot of CC in the range of 3-50 µM at mesoporous Pt electrode in 0.1 M HClO4 with sweep rate of 50 mV s-1. It was noted that the anodic and cathodic peak current of i-t curve increases with increasing in the concentration of CC. The limit of detection (LOD), determination coefficient (R2), and limit of quantification (LOQ) were calculated using ten data points as established by Miller and Miller method [23]. i-t curves of catechol at different concentrations are displayed in Fig. 8. As shown by Fig. 9, the forward anodic peak currents of i-t plot (peak height) versus the analyte (catechol) concentrations are linearly dependent in the range of 3-50 µM concentration, following the linear regression Eqs. 1, 2 [24]. From Figure 9 we found:
ip (μA) = 0.0101C(µM) + 0.0127 (9)
Herein, SD of the linear regression for the anodic peak current vs. analyte concentrations stated on Fig. 9 equals 7.11×10⁻³. Consequently, the calculated SD value was then used to determine the limits of detection (LOD) and quantification (LOQ) value as indicated in Eq.3 [25]. The value of R2 is 0.99908 which shows the excellent linear fitting within the studied concentration range. Moreover, the mesoporous Pt electrode exhibited good LOD and LOQ for CC having the values 2.111 and 7.0396 µM, respectively.
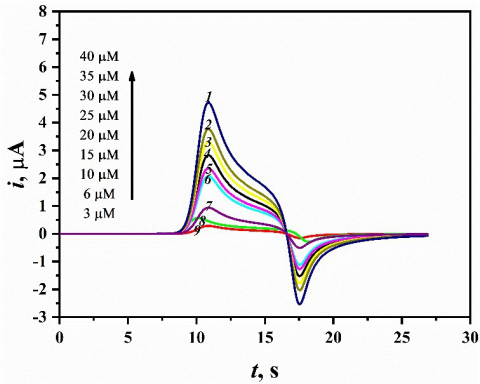
Figure 8. Current-time curves built from CV of catechol at different concentrations recorded at scan speed 50 mV s-1 in1.0 M HClO4 at nanostructured mesoporous Pt electrode

Figure 9. Current versus different concentrations of catechol (@ positive maxima) built from Fig. 8
3.5 Differential pulse Voltammetry study of CC at mesoporous Pt electrode
The sensitivity of mesoporous Pt nanostructured electrode for the detection and quantification of catechol was studied by differential pulse voltammetry (DPV). The DPV experiments were recorded at the optimum conditions of 10 mV s-1 scan rate, 50 ms pulse width and 30 mV pulse amplitude. Figure 10 shows the DP voltammograms for 5 µM catechol in 1.0 M HClO4 at mesoporous Pt electrodes. It is obvious that height of the oxidative peak increases with increasing the concentration of CC at mesoporous Pt electrode. Figure 11 clarifies the dependence of DPV peak current on the concentration of catechol. Clearly, we can see that catechol peak current increases linearly with the concentration, in the range 5- 50 µM. The detection limit (LOD), determination coefficient (R2), sensitivity and repeatability (RSD %) of CC were determined via DPV [23]. As indicated in Fig. 11, the peak height (ip) of the DPV and the analyte (catechol) concentrations are linearly dependent within the 3-50 µM concentration, following the linear regression Eq. 1 and 4 [24]. In this case, y-axis represents the height of peak current (ip, μA) and x-axis is the analyte concentrations (C, µM), then from Fig. 11 we obtained:
ip (μA) = 0.02333 C (µM) + 0.01569 (11)
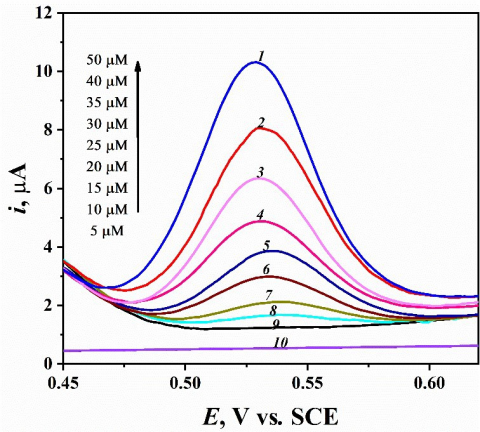
Figure 10. Differential pulse voltammograms of chatechol at different concentrations in the range from 5 to 50 µM at mesoporous platinum electrode in 1.0 M HClO4
Standard deviation of the linear regression for the anodic peak height of DP voltammogram vs. analyte concentrations stated on Fig. 11 equals 2.337×10⁻². Consequently, according to Eq.3 [25] and from SD value the determination of the detection limit (LOD) and quantification limit (LOQ) were done. Based on Eq.11 and Fig. 11 the value of R2 is 0.99743 which shows excellent linear fitting within the studied concentration range. Moreover, the mesoporous Pt electrode exhibited good LOD and LOQ for CC having the values 3.005 and 10.017 µM, respectively.
The limit of detection (LOD) and limit of quantification (LOQ) calculated in this work were compared by those determined in literature and collected in Table 1. As shown in Table 1, the mesoporous nanostructured Pt electrode exhibits good LOD and LOQ for CC in 1.0 M HClO4.

Figure 11. Plot of DPV peak current at mesoporous Pt electrode vs. catechol concentration (@ 0.53 V) in 1.0 M HClO4
Table 1. Comparison of the mesoporous Pt electrode with other modified working electrodes for catechol quantification
|
Working electrode |
LOD (µM) |
LOQ (µM) |
Method |
Ref. |
|
PNR/MCPE |
6.40 |
--- |
CV |
[24] |
|
RGO-MWCNTs/GC |
1.80 |
--- |
CV |
[25] |
|
Poly(calmagite) MCPE |
1.75 |
--- |
CV |
[26] |
|
Poly(BGA)/MCPE |
2.55 |
--- |
CV |
[27] |
|
Poly(oPD)/MCPE |
1.10 |
--- |
CV |
[30] |
|
P4NA/MGCE |
3.90 |
--- |
DPV |
[34] |
|
Mesoporous Pt |
2.60 |
8.70 |
CV |
This work |
|
Mesoporous Pt |
2.25 |
7.99 |
Conv. |
This work |
|
Mesoporous Pt |
2.20 |
7.33 |
Decon. |
This work |
|
Mesoporous Pt |
2.11 |
7.04 |
i-t curve |
This work |
|
Mesoporous Pt |
3.01 |
10.92 |
DPV |
This work |
The redox behavior of catechol was investigated at nanostructured mesoporous platinum film electrode which deposited electrochemically from the hexagonal liquid crystalline template. The mesoporous platinum electrode showed an excellent electrocatalytic activity and reversibility towards oxidation of catechol. The oxidation and reduction peak separation (ΔEp) has been found to be 73 mV vs. SCE. Moreover, the nanostructured mesoporous platinum film electrode provides a high precision and accuracy for detection and quantification of CC compound in 1.0 M HClO4 via various modern electrochemical techniques. The three novel methods (conv., deconv., i-t curve) provide a simple and capable tools for the determination of low concentration of CC compound with excellent LOD and LOQ values.
[1] Saglam, O, Dilgin, D.G., Ertek, B.,and Dilgin, Y. (2016) Differential pulse voltammetric determination of eugenol at a pencil graphite electrode. Mater Sci Eng C 60:156- 162
[2] Naik, T.S.S.K., and Swamy, B.E.K. (2017) Poly (phenosafranine)/SAOS modified sensor for the determination of dopamine and uric acid. J Anal Bioanal Electrochem 9:424-438.
[3] Barner, A.B., Bongat, A.F.G., and Demchenko, A.V., (2001) Catechol. In: Charette AB, Bode JW, Rovis T, Shenvi RA, Paquette LA (ed) Encyclopedia of Reagents for Organic Synthesis. Wiley & Sons, New York.
[4] Zhao, D.M., Zhang, X.H., Feng, L.J., Jia, L., and Wang,
S.F. (2009) Simultaneous determination of hydroquinone and catechol at PASA/MWNTs composite film modified glassy carbon electrode. Colloids Surf B 74:317–321.
[5] Feng, S.Q., Zhang, Y.Y., Zhong, Y.M., Li, Y.C., and Li,
S.X. (2014) Simultaneous determination of hydroquinone and catechol using covalent layer-by-layer self-assembly of carboxylated MWNTs. J Electroanal Chem 733:1–5.
[6] Huang, Y.H., Chen, J.H., Sun, X., Su, Z.B., Xing, H.T., Hu, S.R., Weng, W., Guo, H.X., Wu, W.B., and He, Y.S. (2015) One-pot hydrothermal synthesis carbon nanocages-reduced graphene oxide composites for simultaneous electrochemical detection of catechol and hydroquinone.. Sens Actuators B 212:165–173.
[7] Marrubini, G., Calleri, E., Coccini, T., Castoldi, A.F., and Manzo, L. (2005) Direct analysis of phenol, catechol andhydroquinone in human urine by coupled-column HPLC with fluorimetric detection. Chromatographia 62:25–31.
[8] Moldoveanu, S.C., and Kiser, M. (2007) Gas chromatography/mass spectrometry versus liquid chromatography/fluorescence detection in the analysis of phenols in mainstream cigarette smoke. J Chromatogr A 1141:90–97.
[9] Nagaraja, P., Vasantha, R.A., and Sunitha, K.R. (2001) A sensitive and selective spectrophotometric estimation of catechol derivatives in pharmaceutical preparations. Talanta 55:1039–1046.
[10] He, J.H., Qiu, R., Li, W.P., Xing, S.H., Song, Z.R., Li, Q., and Zhang, S.T. (2014) A voltammetric sensor based on eosin Y film modified glassy carbon electrode for simultaneous determination of hydroquinone and catechol. Anal Methods 6:6494–6503.
[11] Li, S.J., Xing, Y., Deng, D.H., Shi, M.M., and Guan, P.P. (2015) A comparative study of different types of reduced graphene oxides as electrochemical sensing platforms for hydroquinone and catechol. J Solid State Electrochem 19: 861–870.
[12] Attard, G.S., Corker, J.M., Göltner, G.C., Henke, S., and Templer, R.H. (1997) Liquid-crystal templates for nanostructured metals. Angew Chem 36:13-15.
[13] Attard, G.S., Bartlett, P.N., Coleman, N.R.B., Elliott, J.M., Owen, J.R., and Wang, J.H. (1997) Mesoporous platinum films from lyotropic liquid crystalline phases. Science 278;838-840.
[14] Elliott, J.M., Attard, G.S., Bartlett, P.N., Coleman, N.R.B., Merckel, D.A.S., and Owen, J.R. (1999) Nanostructured platinum (HI-ePt) films: effects of electrodeposition conditions on film properties. Chem Mater 11;3602–3609.
[15] Elliott, J.M., Birkin, P.R., Bartlett, P.N., and Attard, G.S. (1999) Platinum microelectrodes with unique high surface areas. Langmuir 15:7411-7415.
[16] Ghanem, M.A., Bartlett, P.N., Birkin, P.N., de Groot, P., and Sawicki, M. (2001) The Electrochemical deposition of nanostructured cobalt films from lyotropic liquid crystalline media. J Electrochem Soc 148: C119.
[17] Nelson, P.A., Elliott, J.M., Attard, G.S., and Owen, J.R. (2002) Mesoporous nickel/nickel oxide-a nanoarchitectured electrode. Chem Mater 14:524-529.
[18] Bartlett, P.N., Gollas, B., Guerin, S., and Marwan. (2002) The preparation and characterisation of H1-e palladium films with a regular hexagonal nanostructure formed by electrochemical deposition from lyotropic liquid crystalline phases. J Phys Chem Chem Phys 4:3835- 3842.
[19] Birkin, P.R., Elliot, J.M., and Watson, Y.E. (2000) Electrochemical reduction of oxygen on mesoporous platinum microelectrodes. Chem Commun 1693-1694.
[20] Evans, S.A.G., Elliott, J.M., Andrews, L.M., Bartlett, P.N., Doyle, P.J., and Denuault, G. (2002) Detection of hydrogen peroxide at mesoporous platinum microelectrodes. Anal Chem 74:1322-1326.
[21] Park, S., Chung, T.D., and Kim, H.C. (2003) Nonenzymatic glucose detection using mesoporous platinum. Anal Chem 75:3046-3049.
[22] Kucernak, A., and Jiang, J. (2003) Mesoporous platinum as a catalyst for oxygen electroreduction and methanol electrooxidation. Chem Eng J 93:81-90.
[23] Miller, J.N., and Miller, J.C. (2010) Statistics and chemometrics for analytical chemistry. Pearson Education.6th edition.
[24] Chitravathi, S., Swamy, B.E.K., Mamatha, G.P., and Sherigara, B.S. (2013) Determination of salbutamol sulfate by Alcian blue modified carbon paste electrode: A cyclic voltammetric study. Chem Sensors 3:1-8.
[25] Naik, T.S.S.K., and Swamy, B.E.K. (2017) Modification of carbon paste electrode by electrochemical polymerization of neutral red and its catalytic capability towards the simultaneous determination of catechol and hydroquinone: A voltammetric studyJ Electroana Chem 804:78-86.
[26] Umasankar, Y., Periasamy, A.P., and Chen, S.M. (2011) Electrocatalysis and simultaneous determination of catechol and quinol by poly(malachite green) coated multiwalled carbon nanotube film. Anal Biochem 411:71-79.
[27] Hu, F., Chen, S., Wang, C., Yuan, R., Yuan, D., and Wang, C. (2012) Study on the application of reduced graphene oxide and multiwall carbon nanotubes hybrid materials for simultaneous determination of catechol, hydroquinone, p-cresol and nitrite. Anal Chim Acta 724:40-46.
[28] Ganesh, P.S., Kumaraswamy, B.E., and Rekha. (2016) Electroanalysis of catechol in presence of hydroquinone at Poly (calmagite) modified carbon paste electrode: A voltammetric study. Sci Lett J 5:236.
[29] Chetankumar, K., Swamy, B.E.K., and Sharma, S.C. (2019) Poly (benzoguanamine) modified sensor for catechol in presence of hydroquinone: A voltammetric study. J Electroanal Chem 849:113365.
[30] Chetankumar, K., and Swamy, B.E.K. (2019) Electrochemical Investigation of Catechol and Hydroquinone at Poly(o-Phenylenediamine) Modified Carbon Paste Electrode: A Voltammetric Study. Anal Bioanal Electrochem 11:1638-1650.
[31] Bard, A.J., and Faulkner, L.R. (2001) Electrochemical methods: fundamentals and applications. John Wiley & Sons, New York. 2nd edition.
[32] Imbeaux, J.C., and Savéant, J.M. (1973) Convolutive potential sweep voltammetry: I. Introduction. J Electroanal Chem 44:169-187.
[33] Galvez, J., and Park, S. (1987) Pulse polarography: theory for the current-potential curves of an EE mechanism. J Electroanal Chem 235:71-85.
[34] Hassine, C.B.A., Kahri, H., and Barhoumi, H. (2021) Simultaneous determination of catechol and hydroquinone using nickel nanoparticles\poly-4 nitroaniline nanocomposite modified glassy carbon electrode. IEEE Sens J 21: 18864-18870.