A. Shoba | B. Kavitha* | P. Matheswaran | N. Jagadeeswari | S.Thanikaikarasan | N. Senthil Kumar*
© 2022 IIETA. This article is published by IIETA and is licensed under the CC BY 4.0 license (http://creativecommons.org/licenses/by/4.0/).
OPEN ACCESS
Chemically produced coppercontaining MnO2 nanoparticles were studied using FTIR, UV-Vis spectroscopy, XRD, AFM, cyclic voltammetric and charge/discharge behaviour. Mixed nanocomposites have a crystalline size of 50 nm was calculated through Debye Scherrer’s equation from XRD analysis. The FTIR spectra were recorded region 400-4000 cm-1, of clean and doped Manganese dioxide nanoparticles. Mn–O can be ascribed to the stretching vibration band of MnO2 nanoparticles at 631 cm-1. The bending and stretching vibrations of the O-H group are ascribed to the fundamental absorption peaks at 1620 cm-1 and 3400 cm-1. AFM is used to characterize the impact of surface roughness on the fundamental properties of MnO2, copper induced nanocomposites of MnO2 particles. Electrochemical impedance and voltammetric experiments are used to investigate the behaviour of individual and mixed nanocomposites as supercapacitors.
manganese dioxide, copper, nanoparticles, voltammetry, capacitor
MnO2 is one of the most significant materials and a number of researchers have given special observation to the efficacy of manganese dioxide in addition to the electromagnetic attributes of the materials [1, 2]. On account of low cost, high energy density, natural abundance and environmental friendliness manganese oxide (MnO2) has proved as one of the most promising pseudo capacitive materials [3, 4]. Preliminary electrochemicals studies performed by Lee and Goodenough expressing that MnO2could be utilized as an electrode material [5].Among different 3d transition metal-oxides, Mn-oxides have gained some particular attention owing to their well-defined structural and different compositions like MnO, MnO2,Mn2O3,Mn5O8and Mn3O4.Mn-Oxides nanomaterials have flexibility in structure addition with various physicochemical features. Different forms of Mn-Oxides nanostructures like nano-fibers, nano-rods, mesoporous sieves, nano-belts, nano-sheets, nano-wires, nano-tubes and molecular sieves have been prepared in many methods. The branches structures of MnO2 like orchids, urchins and other hierarchical structures are also prepared in a variety of methods [6].
On account of Manganese oxide’s different oxidation states, chemical, electrical and magnetic properties which is as potent as new nanoparticles that good for the environment [7].Transition-metal dioxide nanomaterial having redox active behavior, manganese dioxide (MnO2) and its nanocomposites have come out to be a novel class of nanomaterials which exhibit superior benefits and unprecedented performances because of their unique compositional, structural and physicochemical characteristics [8, 9]. MnO2 and its nanocomposites may also be overviewed in future. So some crucial unclear issues, potential tasks and ideas of upcoming perspectives about the construction of MnO2-based nano systems and rational design for the use of further electrochemical applications are also discussed [10]. Electro-chemical parameters such as electrode reaction rates or electric current should be normalized to acquire comparable values [11]. In powder catalysts, loads are frequently used to estimate these values, but in flat film catalysts, these values are not readily accessible. This indicates that the specific capacitance values of different materials show a big difference already [12].Nevertheless, there are several articles which use the average value of 40 µF/cm2 reported by McCrory as value for the specific capacitance in alkaline solutions without considering into account the material used and measurement conditions [13]. MnO2 NPs are very easy to prepare and have good stability owing to which it has been applied in several fields. The tunnel like $\alpha$-MnO2 has been utilized as an electrocatalyst for oxygen evolution and oxygen reduction in both organic and aqueous electrolytes [14].
Many researchers focus on the development of new non precious metal catalysts and their hydrogen evolution reaction activity. During the course of electrochemical activation process it was noticed that Cu2O nanowires were easily reduced to metallic Cu nanowires and formed a 3D conductive electron transfer scaffold.It was found that square manganese nanorods coated with multi-shaped Cu2O nanoparticles, including cuboctahedral shape, truncated octahedral shape truncated cubic shape and octahedral shape behaves as a photosensitizing materials [15]. From literature it was observed that manganese dioxide cannot reduce hydrogen whereas manganese oxide can be reductive hydrogen. Cu doping and sintering temperature alter the optical band gap of MnO2 and that can rise its operational range of environmental degradation applications [16].In modified chemical route, the synthesis of Cu doped α-MnO2 nanoparticlesare found to be very stable at higher temperature and their size can be adjusted by Cu doping and post-sintering temperature variations. Cyclic voltammetry and galvanostatic charge-discharge performance indicate the excellent cycling stability along with a maximum capacitance of 229.5 F/g for current density [17].
The aim of present study is to synthesize copper nanoparticles incorporated manganese dioxide nanoparticles by chemical method and characterized by FTIR and UV-Vis spectroscopy, structural studies of XRD, AFM and their electrochemical applications.
2.1 Materials
The chemicals employed in the experiment were all of the highest quality. Sigma Aldrich provided copper sulphate pentahydrate, ascorbic acid, and sodium hydroxide NaOH. All of the experiments were conducted with de-ionized water.
2.2 Synthesis of Cu nanoparticles
Copper nanoparticles were made utilising a reduction procedure with copper sulphate as a precursor. The process begins with the addition of 250 mL of 0.1 M solution of copper sulphate and 50 mL of 0.2 M solution of ascorbic acid were constantly stirring. After that, 50 mL of 1 M solution of sodium hydroxide was progressively added to the produced solution while it was heated at 60°C for 2 hours with constant stirring. The solution was allowed to settle down of nanoparticles when the reaction was completed. Filtration was used to separate the precipitates from the solution, and the nanoparticles were rinsed with deionized water and ethanol before being dried at ambient temperature. After drying, nanoparticles were stored in glass bottle for further analysis [18].
2.3 Synthesis of manganese oxides
Precipitation was used to generate MnO2 nanoparticles. 8 g of MnCl2 was dissolved in 150 mL distilled water, and then 8 g of NaOH was progressively additional while swirling constantly. A dark grey precipitate was formed after 4 hours. The precipitate was filtered then rinsed in distilled water. The homogeneous solution was placed in an autoclave and heated for 8 hours at 160°C. Following that, MnO2 powder nanomaterials was obtained and used in subsequent research. [19].
2.4 Characterization
The UV-VIS spectra were recorded using the produced metal nanoparticles. A computer-controlled JascoV-650 spectrophotometer was used to capture the UV-Vis absorption spectrum and calculate band gap energy. A Thermo Fisher Nicolet iS5 instrument and iD3 KBr were used to record the FT-IR spectra. Powder X-ray diffraction patterns were obtained using a Philips XPert Pro X-ray diffractometer using Cu Ka (k = 0.15418 nm) radiation to determine the crystal structure and phase purity of the product. CHI equipment, Sinsil International, model CHI 650C, were used to record cyclic voltammetry and galvanic charge/discharge. Computer controlled Nanosurf Easyscan used for studies of AFM behaviour of nanocomposites.
3.1 UV-VIS studies
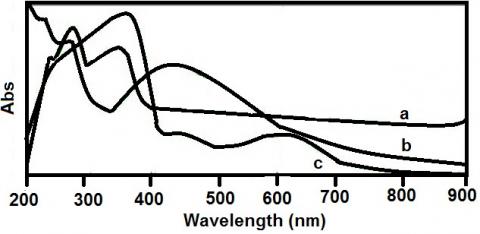
Figure 1 shows the UV-VIS absorption spectra of MnO2, Cu nanoparticles, and Cu included MnO2 nanocomposites. Three peak UV-vis absorption bands between 246, 294, and 365 nm are observed in the main absorption band of MnO2. A broad distinct peak in the 365 nm range, which is the adsorption edge for the as-obtained MnO2 dispersion in compared to bulk MnO2, was discovered, which can be explained by the existence of very small MnO2 nanoparticles. Copper nanoparticles likewise had a broad band between 350 and 600 nanometers, as well as two minor shoulders at 290 and 240 nanometers. In all-purpose, the subsistence of a sharp plasmon band near 600 nm for Cu demonstrates that Cu nanomaterials with a spherical shape have been obtained. The spherical and cylindrical particles have a single- and a double-peak absorption spectrum, respectively [20].
Figure 1. UV-Vis behaviour of a) MnO2b) Cu c) Cu doped MnO2Nanoparticles
3.2 FTIR studies
MnO2, Cu, and Cu FT-IR spectral studies include MnO2 nanoparticles, as seen in Figure 2. The absorption bands about 3425 and 1605 cm-1 correspond to water absorption of O-H stretching vibrations and bending vibrations, respectively. The above two peaks appear to be substantially stronger in doped MnO2 than in undoped MnO2. This agreement indicates that the undoped MnO2 has larger water content. This could be because the doping metal ions make MnO2 hydrate quickly. Similarly, Chen and colleagues have demonstrated that iron doping can result in greater crystal water content, which is consistent with our findings. Furthermore, all of the samples exhibit a prominent distinctive peak at 534 cm-1, which can be attributed to Mn-O stretching vibrations [21]. The distinctive peaks of copper, on the other hand, are visible in the equivalent compound, with the exception that the peak at about 534 cm-1 extends to a larger wavenumber. Two things could have a role in this outcome.
Figure 2. FTIR studies of MnO2,Cuand Cu doped MnO2 Nanoparticles
The amount of doping components is in trace, for example. The other is that doping elements, which are comparable in size to manganese oxide and have a distinctive peak that is very similar to manganese oxide, can substitute for manganese in the crystal. The absorption band seen at 668 cm-1 corresponds to the typical stretching collision of O–Mn–O, indicating that MnO2 is present in the sample. The surface –OH groups of Mn–OH for colloidal MnO2 nanoparticles are visible in the absorption band at 1264 and 814 cm-1. The weakly produced bands in the range 2361 and 1364 cm-1 can be linked to the Cu–O–Mn–O bond stretching. The force constant of a chemical bond, bond order, types of atoms linked by the bond, and reduced mass all influence the absorption position of infrared bands.
3.3 XRD studies
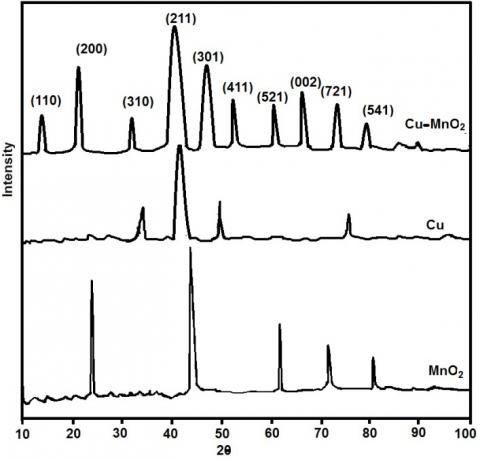
X-ray diffraction was used to describe MnO2, Cu, and Cu doped MnO2 nanoparticles, as shown in Figure 3. The MnO2-Cu XRD images show strong, powerful peaks in the produced nanoparticles, which are extremely crystalline in nature. All of the detected peaks have a tetragonal crystal structure. The diffraction peaks at 15°, 24°, 33°, 43.4°, 49.3°, 53.7°, 62.3°, 67.5°, 73.8°, and 81.4° correspond to the (h k l) planes (110), (200), (310), (211), (301), (411), (521), (002), (721), and (541) set to tetragonal structure and the MnO2-Cu space group. The peak values of the acquired XRD spectrum compared to the standard established that the manganese oxide nanoparticles generated were in the form of crystals. The (111), (200), and (220) planes of Cu, which may be indexed to Cu's fcc structure, were attributed to the characteristic peaks around 43.3°, 50.4°, and 74.1°, respectively. However, only samples connected with the (110), (111), and (220) planes of Cu2O nanomaterials showed minor peaks at roughly 29.7°, 36.4°, and 61.4°.
Figure 3. XRD behaviour of MnO2, Cu and Cu doped MnO2 Nanoparticles
3.4 AFM Studies
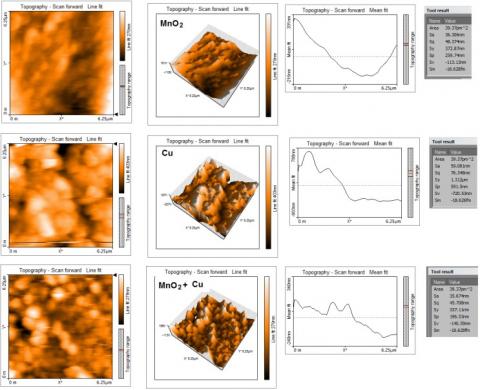
Based on the surface investigation, AFM pictures of MnO2, Cu, and Cu doped MnO2 nanoparticles were analysed for morphology. The photos in Figure 4 clearly show the MnO2 nanoparticles in a well scattered and sticky globular dispersion layer by layer form. Copper nanoparticles have a nodule-like structure to them. Copper-incorporated MnO2 nanocomposites appear to have congregated into maximal uniformity resembling needles and spheres. It can also be noted that the diameters of the produced nanoparticles ranged from 50 to 100 nm.
Figure 4. AFM Photographs of MnO2,Cu and Cu doped MnO2 Nanoparticles
The amplitude parameters are the most imperative factors in determining the topography of a surface. The most frequently used parameter values are shown. The most commonly utilised amplitude parameters are average roughness (Ra) and root mean square roughness (Rq). Rq is commonly used to investigate temporal variations in the creation of a new surface as well as spatial differences when analysing the surface feature at different scales.
3.5 Electrochemical studies
Voltammetric, galvanic charge and discharge, and electrochemical impedance spectroscopy were used to examine the electrochemical properties. The typical CV curves of the three samples at 50 mV/s are shown in Figure 5a. The rectangular and symmetrical curves of MnO2-undoped,Cu, and MnO2-Cu indicate their perfect electrical double-layer capacitive behaviour. Metal–doped MnO2 has a greater integrated area than MnO2 that is not doped, implying a higher specific capacitance. This could be due to their increased specific surface area, which can expose more electrochemical active spots for electrostatic charge storage at the double-layer interface. The CV curves are rectangular in shape, indicating that both faradic nature and electrical double layer capacitance play a role. The current density of metal nanocomposites grows linearly as the Cu content in MnO2 increases. The similarity of the curves suggests that the voltammetric current of NCs increases with Cu, indicating an increase in capacitance. The curves show capacitive performance, which is mostly attributable to the active material's redox transition.
Figure 5. cyclic voltammetricbehaviour of a) Cu doped MnO2 b) Cu c) MnO2 Nanoparticles
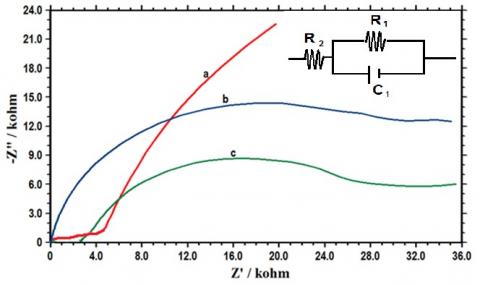
The resistive components of the products involved in the electrochemical system are investigated using electrochemical impedance spectroscopy of MnO2. The Nyquist plots of samples MnO2, Cu, and doped MnO2-Cu, whose equivalent circuit architecture is given in the inset of Figure 6, are displayed in Figure 6. (a). Equivalent series resistance (Re), double layer capacitance (CPE), charge transfer resistance (Rct), Warburg impedance (W), diffusion capacitance (C), and diffusion resistance (D) make up this equivalent circuit (Rd). The Figure (b) shows a portion of their high frequency area enlarged. It can be seen from the figure that the three samples have obvious capacitive reactance arc in the high frequency region, and the Re of the samples MnO2, Cu and MnO2-Cu are almost the same, approximately 2.68 Ω.
The semicircle is caused by the cathode material's charge transfer resistance (Rct) in relation to particle contact. The Warburg contribution of proton diffusion through the bulk of the material is the quasi-linear part at low frequency. This is also shown in Figure 6, where the Nyquist plots collected by electrochemical impedance spectroscopy (EIS) reveal a significant reduction in charge transfer resistance Rct after MnO2-Cu coating. When Rct is lowered (46, 38 and 30 k ohm) the charge/discharge operation can be performed at high rates. As the impedance behaviour of MnO2, Cu, and doped composites semicircle reduces, the resistance decreases, meaning that the resistance decreases as well. The capacitance of the layer (Cdl) increases. The resultant increased as well, as seen by the values of 0.2044, 0.7609, and 5.551 F.
Figure 6. Impedance spectroscopybehavior of a) MnO2 ; b) Cu; c) Cu doped MnO2 Nanoparticles. (Inset; Nyquist equivalent circuit)
MnO2, Cu and doped NCs charge-discharge curves in pH 1.0 at 1.0 A/g current density NCs have acceptable specific capacitance energy density, and coulombic efficiency(93.4%). It can be seen from the curves that there is good symmetry, indicating high columbic efficiency during the charge-discharge process. These results are in line with the charge/discharge curves shown in Figure 7. The charge/discharge profiles of MnO2-undoped and MnO2-Cu in this figure have a triangular mirror-like symmetrical distribution, implying that they store charges primarily in an electrochemical double-layer. Meanwhile, metal–doped MnO2 takes longer to charge and discharge than un-doped MnO2. It's worth noting that the profiles of MnO2, Cu, and MnO2-Cu depart significantly from the triangle, and their charging time is significantly longer than their discharging time. These findings suggest that some irreversible reactions may occur in MnO2, Cu and MnO2-Cu. The discharge specific capacitances of MnO2-undoped, Cu, and MnO2-Cu, estimated using GCD curves, are 179.8, 365.4, and 498.9 Fg-1 at 1 A g-1 respectively.
Figure 7. Galvanic charge dischargebehaviour of a) MnO2b) Cu c) Cu doped MnO2 Nanoparticles
Although some of the results are fairly similar to those in the literature, the experimental settings are somewhat different. Because this work focuses on rate performance, the scan rate or current density is often higher than most references, and some higher specific capacitance has been reached when compared to reference data. Appropriate pore size distribution and particle size could be factors in metal–doped MnO2 higher rate performance. More micro- and nanopores have emerged from metal doping, with MnO2-Cu having the greatest micropores and nanopores. A large number of micropores can significantly increase specific surface area, exposing more active sites and hence improving specific capacitance. Appropriate nanopores can help with electrolyte storage and transportation inside electrode materials by allowing electrolyte to easily enter the pores, lowering ion diffusion resistance, and improving rate performance.
Wet chemical technique has been used to successfully produce copper integrated MnO2 nanocomposites. UV-VIS and FTIR spectrum investigations were used to characterise synthesised nanomaterials. The increased surface area and structural behaviour of copper doped MnO2 nanocomposites are confirmed by XRD and AFM investigation. Copper doping has an effect on the structure, as seen by the small particle size. We looked into the electrochemical parameters of cyclic voltammetric, impedance, and charge discharge behaviour. MnO2, Cu, and MnO2-Cu depart significantly from the triangle, and their charging times are significantly longer than their discharging times. The discharge specific capacitance of179.8 F/g for MnO2, 365.4 F/g for Cu and 498.9 F/g for MnO2-Cu at 1 A g -1 values are respectively obtained
[1] Vahid Hoseinpour, Nasser Ghaemi, Green synthesis of manganese nanoparticles: Applications and future perspective–A review, Journal of Photochemistry & Photobiology, B: Biology, 2018, 189: 234–243
[2] Jayandran M, Haneefa M, Balasubramanian V, Green synthesis and characterization of Manganese nanoparticles using natural plant extracts and its evaluation of antimicrobial activity, Journal of Applied Pharmaceutical Science. 2015, 1:105–110.
[3] Hou Y, Cheng Y, Liu J, Design and synthesis of hierarchical MnO2 nanospheres/carbonnanotubes/conducting polymer ternary composite for high performance electrochemical electrodes, Nano Lett, 2010,10:2727–2733.
[4] Ramirez-Castro C, Crosnier O, Athouël L, Retoux R, Bélanger D, Brousse T, Electrochemical performance of carbon/MnO2nanocomposites prepared via molecular bridging as supercapacitor electrode materials, J Electrochem Soc., 2015, 16:2A5179.
[5] Lee H, Goodenough J, Supercapacitor Behavior with KCl Electrolyte, J Solid State Chem. 1999, 144:220-223.
[6] Fei JB, Cui Y, Yan XH, Qi W, Yang Y, Wang KW, He Q, Li JB, Controlled Preparation of MnO2 Hierarchical Hollow Nanostructures and their Application in Water Treatment, Adv. Mater. 2008, 20:452–456.
[7] Maryam Usman Ahmed, JanyoNoseh Dahiru, Ismaila Yada Sudi, Sandra Gabriel and Iliya Kulini John, Green Synthesis of Manganese Oxide Nanoparticles from Cassia tora Leaves and its Toxicological Evaluation, Asian J. Applied Sci., 2020, 13 (2): 60-67.
[8] Chen J, Meng H, Tian Y, Yang R, Du D, Li Z, Qu L, Lin Y, Recent advances in functionalized MnO2 nanosheets for biosensing and biomedicine applications, Nanoscale Horiz., 2019, 4:321-338.
[9] Ding B, Zheng P, Ma PA, Lin J, Manganese Oxide Nanomaterials: Synthesis, Properties, and Theranostic Applications, Adv. Mater., 2020, 1905823
[10] Jia Wen, Kui Yang, Shiguo Sun, MnO2-based nanosystems for cancer therapy, Chem. Commun.,2020, 56:7065-7079 DOI: 10.1039/D0CC02782K
[11] Łukaszewski M, Soszko M, Czerwiński A, Electrochemical Methods of Real Surface Area Determination of Noble Metal Electrodes – an Overview, Int. J. Electrochem. Sci. 2016, 11: 4442-4469.
[12] Paula Connor, Jona Schuch, Bernhard Kaiser and Wolfram Jaegermann, The Determination of Electrochemical Active Surface Area and Specific Capacity Revisited for the System MnOx as an Oxygen Evolution Catalyst, Z. Phys. Chem., 2020, 234(5): 979–994
[13] McCrory CCL, Jung S, Ferrer I.M, Chatman SM, Peters JC, Jaramillo TF, Benchmarking Hydrogen Evolving Reaction and Oxygen Evolving Reaction Electrocatalysts for Solar Water Splitting Devices, J. Am. Chem. Soc. 2015,137:4347-4367.
[14] Sonika Dawadi , Aakash Gupta, Manita Khatri, Biplab Budhathoki, Ganesh Lamichhane, Niranjan Parajuli Manganese dioxide nanoparticles: synthesis, application and challenges, Bull Mater Sci., 2020, 43:277
[15] Li Chen, Xing Zhang, Wenjie Jiang, Yun Zhang, Linbo Huang, Yuyun Chen, Yuguo Yang, Li Li, Jinsong Hu, In situ transformation of Cu2O@MnO2 to Cu@Mn(OH)2 nanosheet-on-nanowire arrays for efficient hydrogen evolution, Nano Research, 2018, 11:1798–1809
[16] Yu T, Sun Y, Zhe C, Wang W, Rao P, Synthesis of CuOx/MnO2 heterostructures with enhanced visible light-driven photocatalytic activity, J Mater Sci Chem Eng., 2017, 05: 12–25
[17] Dheeraj Mondal, Santanu Das, Biplab Kumar Paul, Debopriya Bhattacharya, Debopriyo Ghoshal , Ananda Lal Gayen , Kaustuv Das , Sukhen Das, Size engineered Cu-doped α-MnO2 nanoparticles for exaggerated photocatalytic activity and energy storage application, Materials Research Bulletin, 2019, 115:159–169.
[18] Ayesha Khan, Audil Rashid, Rafia Younas, Ren Chong, A chemical reduction approach to the synthesis of copper nanoparticles, International Nano Letters, 2016, 6:21–26
[19] Emad Salaam Abood, Mothana Salih Mashkoor, Amer Mousa Jouda, Cyclic voltammetry study for MnO2 nanoparticles modified carbon paste electrode, Nano Biomed. Eng., 2019, 11:368-374
[20] Tao Yu, Yangang Sun, Cui Zhe, Wei Wang, Pinhua Rao, Synthesis of CuOx/MnO2 Heterostructures with Enhanced Visible Light-Driven Photocatalytic Activity, Journal of Materials Science and Chemical Engineering, 2017, 5:12-25
[21] Manjula N, Chen S-M, Synthesis of highly electroactive nanoflowers like manganese-tin oxide and electroanalytical application for chloramphenicol determination in milk and honey samples, Journal of Electroanalytical Chemistry, 2021, 880:114914