Yutao Lian* | Qizhen Xie | Minggang Zheng
© 2020 IIETA. This article is published by IIETA and is licensed under the CC BY 4.0 license (http://creativecommons.org/licenses/by/4.0/).
OPEN ACCESS
As a critical component, the bipolar plate appreciably affects the performance of proton exchange membrane fuel cell (PEMFC). The flow field structure on the bipolar plate is significant in transporting the internal reaction gas and excess water. In the nature, the leaf veins provide efficient branch networks to the plant, contributing to distribute the nutrients in the whole system. By bionic means, a similar branching structure can be used to design flow channels on the bipolar plates for PEMFC, which helps distribute the reactant gas evenly and manage the water better. In this paper, a three-dimensional isothermal single phase model of the bio-inspired flow channel design based on the leaf vein pattern was presented. The effect of the angle between the main channel and sub-channels on the performance of PEMFC was studied at various cases. A PEMFC of 10.24cm2 activation area was assembled and examined experimentally. The results showed that increasing the angle appropriately was beneficial to improving the uniform oxygen distribution and excess water removal. After comprehensively analyzing the electrochemical performance, species distribution, and power loss of PEMFC, the optimal angle was presented.
PEMFC, bio-inspired flow field, angle, fuel cell performance, mass transfer
With the growing concern about environmental pollution and energy crisis worldwide, alternative clean energy technologies have been in urgent demand [1]. As one of the renewable energy technologies, hydrogen energy has drawn more and more attention. Among all types of hydrogen energy utilization, fuel cells are firstly introduced into industrial applications. PEMFC has merits such as green emissions, high efficiency, low-temperature operation, low noise, and low vibration. As one of the most essential parts of PEMFC, the flow-field design on the bipolar plates directly affects the distribution and transport of reaction gas, and the excess water emission [2]. Therefore, the rational flow channel structure is of the great significance of the PEMFC performance improvement. It can be observed from the literature that many researchers pay more attention to the conventional flow-field design [3-6]. Limited work has been available on the bio-inspired flow field in the bipolar plates.
In the nature, the nutrients distribution in the biological structures has an optimum arrangement. The flow-field design based on the biomimetic structure can significantly improve the PEMFC performance. Kloess et al. proposed the blade and lung structure of the flow field. It was found that the blade and lung structure enables the pressure drop between the inlet and outlet of the flow channels lower than the existing interdigitated and serpentine structure [7]. Iranzo et al. reviewed the application of natural or biological structures (such as fractal, leaf, or lung) on the flow field's design [8]. Ouellette et al. studied the effect of bio-inspired interdigitated and non-interdigitated flow fields on the fuel cell performance. The three dimensional numerical models of these two flow fields and the conventional serpentine flow field were developed and examined under different reactant flow rate combinations [9]. Liu et al. used the simulation and visualization experiments to study the difference of the transport process of liquid water with symmetric and asymmetric bionic flow field under gravity. The I-V curves showed the asymmetric bionic flow fields enable to provide the best PEMFC performance in the vertical direction [10].
At present, researches on the bionic flow field design of the leaf-vein structure are mainly divided into two categories: one is the study on the overall structure of the flow channels, the other is the study on the geometric parameters related to the flow channels. Qiao found that the vein density, the number of veins grading, and the distance between each vein were critical in the mass transfer and heat dissipation. Similarly, the geometric parameters of the flow field have an essential influence on the performance of PEMFC. After comparing different branch numbers of the flow field [11]. Roshandel et al. was the first researcher to design the flow-field structure by combining the leaf vein with the parallel flow channels. He found that based on this flow field, PEMFC power density was 55.82% higher than that with parallel flow channels and 27.13% higher than that with single serpentine flow channels [12]. Lorenzini-Gutierrez et al. proposed that the increase in the number of the flow field branches enables the improvement in the flow distribution uniformity and the reduction in the pressure drop between the inlet and outlet of flow channels [13]. Kang et al. conducted experiments comparing the performance of the leaf flow channels based on the ginkgo and dicotyledonous leaf structures, the parallel-style flow channels, and the serpentine-style flow channels [14]. It was found that the leaf flow channels’ maximum power density was 6.4% lower than that of the serpentine flow channels, and 37.5% higher than that of parallel flow channels under normal operating conditions. Badduri et al. [15] examined the effect of the leaf flow field design on the PEMFC performance experimentally under various operating conditions. It was found that at the back pressure of 3 bar, 75℃ operating temperature and 100% relative humidity, the PEMFC performance is the best.
The existing literature and patents rarely present the influence of the angle between the main channel and the sub-channels on the performance of PEMFC. A three-dimensional computational model of a biomimetic fractal-branched flow field was designed based on leaf-vein structure. For optimization purposes, numerical analyses on the bio-inspired flow-fields with different angles between the main channel and sub-channels were carried out. This work aims to present the optimal angle, which is of great importance for improving fuel cell performance.
It can be seen from Figure 1 that the leaf vein structure is mainly composed of two parts: the main channel and numerous sub-channels. The main channel connects the flow field inlet with the outlet. The sub-channels are used to transport the reactant gas to areas far away from the main channel. There exists an angle(θ) between the main channel and sub-channels. As shown in Table 1, to study the influence of the angle between the main channel and sub-channels on the performance of PEMFC, ten research cases are conducted.
(a) Leaf vein system
(b) The angle between the main channel and sub-channels
Figure 1. The leaf-vein structure [16]
The schematic diagram of the designed flow field based on the leaf-vein structure is shown in Figure 2. The activation area of the flow field is 32mm×32mm. The width and depth of each flow channel are both 1mm. Figure 3 shows the computation domain of a cell model based on COMSOL Multiphysics. The model consists of the cathode flow channels, cathode GDL, cathode catalyst layer, proton exchange membrane, anode catalyst layer, anode GDL, and the anode flow channels.
Table 1. The angle designs of different cases
|
Case |
Angle (θ) |
|
#1 |
0° |
|
#2 |
5° |
|
#3 |
10° |
|
#4 |
15° |
|
#5 |
20° |
|
#6 |
25° |
|
#7 |
30° |
|
#8 |
35° |
|
#9 |
40° |
|
#10 |
45° |
Figure 2. The schematic diagram of the designed flow field based on the leaf-vein structure
Figure 3. Schematic illustration of the computational domain for PEMFC
2.1 Assumptions and governing equations
In order to facilitate the calculation of the PEMFC model, the assumptions adopted by the models are[17-19]: 1) PEMFC operates in steady-state; 2) The phase of all gas components is ideal and incompressible [20]; 3) The reactant gas in the flow field is regarded as laminar flow; 4) The GDL, catalytic layer, and proton exchange membrane are all isotropic; 5) The operating temperature of PEMFC is 80℃; 6) The gravity is ignored. The governing equations used to solve the PEMFC flow fields include the mass conservation equation, the momentum conservation equation, charge and species transport equations [21, 22].
2.1.1 The mass conservation equation
When the transfer of components in the battery conforms to the continuous medium assumption while maintaining low-velocity flow, the mass conservation equation is:
$\frac{\partial(\varepsilon \rho)}{\partial t}+\nabla \cdot(\varepsilon \rho \vec{v})=S_{m}$ (1)
Equation 1 represents the unsteady state term, convection term, and mass source term in sequence from left to right. Where $\rho$ stands for the density of the reaction gas, g/cm3; $\varepsilon$ is the porosity of the porous media; $\vec{v}$ is the velocity vector of the reaction gas mixture, m/s; Sm is the source term of mass, kg/(m3·s), which depends on different computational domains corresponding to different solution formulas. In the flow field, gas diffusion layer and other non-electrochemical reaction zones of PEMFC, Sm=0; In the three-phase reaction zone of the catalytic layer, Sm is calculated by the following equation:
$S_{m a}=S_{H_{2}}=-\frac{M_{H_{2}}}{2 F} i_{a}$ (2)
$S_{m c}=S_{H_{2} O}+S_{O_{2}}=\frac{M_{H_{2} O}}{2 F} i_{c}-\frac{M_{O_{2}}}{4 F} i_{c}$ (3)
where, $M_{H_{2}}, M_{H_{2} 0}$ and $M_{O_{2}}$ stand for the molar mass of H2, H2O and O2, respectively, kg/mol; Sma and Smc are the source term of mass of the anode and the cathode, respectively; i is the exchange current density, A/m3.
2.1.2 The equation of momentum conservation
The momentum conservation in PEMFC can be written as:
$\frac{\partial(\varepsilon \rho \vec{v})}{\partial t}+\nabla \cdot(\varepsilon \rho \vec{v})=-\varepsilon \nabla p+\nabla \cdot(\varepsilon \mu \nabla \vec{v})+S_{v}$ (4)
where, p stands for the fluid pressure, Pa; $\mu$ stands for the kinetic viscosity coefficient of the reaction gas, Pa·s; Sυ is the source term of momentum. In the flow fields of bipolar plates, Sυ=0. In porous media, such as the diffusion layer and catalytic layer, the velocity of each component is low, and the distribution of velocity is uniform. The effect of viscosity force and an inertia force on each component can be ignored. According to the Darcy Law, Equation 4 can be reduced to:
$S_{v}=-\frac{k_{p}}{\mu} \nabla p$ (5)
where, kp represents the gas permeability of porous media, m2.
2.1.3 The equation of energy conservation
The energy conservation in PEMFC can be expressed by:
$\frac{\partial\left(\varepsilon \rho c_{p} T\right)}{\partial t}+\nabla \cdot\left(\varepsilon \rho c_{p} \vec{v} T\right)=\nabla \cdot\left(k^{e f f} \nabla T\right)+S_{Q}$ (6)
where, cp is the specific heat at constant pressure, J/(kg·K); T is the temperature, K; keff is effective thermal conductivity, W/(m·K); SQ is the source term of energy.
Consider electrical resistance, chemical reactions, phase transitions, and overpotential during PEMFC operation, the source term can be expressed as:
$S_{Q}=j^{2} R_{\text {ohm }}+\beta \dot{m}_{H 20, q} h_{r x n}+r_{w} h_{L}+j_{a, c} \eta$ (7)
where, $\mathrm{J}$ is the current density, $\mathrm{A} / \mathrm{m}^{2} ; R_{\text {ohm }}$ is ohmic resistivity, $\Omega \cdot m ; \beta$ is the effective ratio of fuel chemical energy to heat energy; $\dot{m}_{H_{2} O, g}$ is the rate of gaseous water formation; hrxn is the enthalpy change of reaction; rw is the rate of the water phase change; hL is the enthalpy of phase change; ja,c is the exchange current density of anode and cathode; $\eta$ is the sum of activation overpotential and concentration overpotential.
2.1.4 Component conservation equation
The mass flow rate of chemical components must consider both the velocity field and the chemical reaction. The flow rate of each component is divided into convection and diffusion. The general form of the transfer equation of each reaction component is:
$\frac{\partial(\varepsilon \rho)}{\partial t}+\nabla \cdot(\varepsilon \rho \vec{v})=\nabla \cdot\left(D_{k}^{e f f} \nabla \rho\right)+S_{k}$ (8)
where, $D_{k}^{e f f}$ stands for the effective diffusion coefficient of the components, m2/s; Sk stands for the source term, kg/(m3·s).
2.1.5 Current conservation equation and Bulter-Volmer equation
The governing equations and source terms for proton and electron transport are:
$\nabla \cdot\left(\delta_{\text {sol }} \nabla \Phi_{\text {sol }}\right)+R_{\text {sol }}=0$ (9)
$\nabla \cdot\left(\delta_{\text {mem }} \nabla \Phi_{\text {mem }}\right)+R_{\text {mem }}=0$ (10)
where, $\delta$ is the conductivity; $\Phi$ is the phase voltage; $\mathrm{R}$ is the exchange current density; sol, mem represents the solid phase and membrane phase. Equation 9 illustrates the electron conduction process in the solid phase. Equation 10 explains proton conduction in the membrane phase. R can be calculated according to the Bulter-Volmer equation:
$\begin{aligned} R_{a n}=R_{a n}^{r e f}\left(\frac{C_{H_{2}}}{C_{H_{2}}^{r e f}}\right.&)^{r_{a n}}\left[\exp \left(\frac{\alpha_{a n, a n} F \eta_{a n}}{R T}\right)\right. -\exp \left(-\frac{\alpha_{c a t, a n} F \eta_{a n}}{R T}\right) \end{aligned}$ (11)
$R_{\text {cat }}=R_{\text {cat }}^{\text {ref }}\left(\frac{C_{O_{2}}}{C_{O_{2}}^{\text {ref }}}\right)^{r_{\text {cat }}}\left[\exp \left(-\frac{\alpha_{\text {cat }, \text { cat }} F \eta_{\text {cat }}}{R T}\right)\right.\left.-\exp \left(-\frac{\alpha_{\text {an,cat }} F \eta_{\text {cat }}}{R T}\right)\right]$ (12)
where, $R_{\text {cat }}^{\text {ref }}$ and $R_{\text {an }}^{\text {ref }}$ are the reference exchange current density of anode and cathode, respectively; $\alpha$ stands for the charge transfer coefficient; $\eta$ is the overpotential.
2.2 Boundary conditions and the physical properties
Some suitable boundary conditions have been specified in order to solve the stated equations. The boundary conditions are: 1) The boundary of the anode side is set to zero potential, and the boundary of the cathode side is set as the battery potential. Other boundaries are insulated; 2) All wall boundary conditions are no-slip; 3) The outlet pressure is ambient pressure. Table 2 lists the main physical parameters of the PEMFC used in this work.
Table 2. Main physical parameters
|
Parameter |
Value |
|
|
Hgdl |
The thickness of GDL (m) |
3.80×10⁻⁴ |
|
Hele |
The thickness of the porous electrode (m) |
5×10⁻⁵ |
|
Hmem |
The thickness of the membrane (m) |
1×10⁻⁴ |
|
εgdl |
The porosity of GDL |
0.4 |
|
kgdl |
The permeability of GDL (m2) |
1×10-13 |
|
σgdl |
The conductivity of GDL (S/m) |
222 |
|
$w_{H_{2_{-}} i n}$ |
H2 mass fraction in the anode |
0.743 |
|
$w_{H_{2} O_{-} i n}$ |
H2O mass fraction in the cathode |
0.023 |
|
$w_{O_{2_{-}} i n}$ |
O2 mass fraction in the cathode |
0.228 |
|
μa |
Anode viscosity (Pa·s) |
1.19×10⁻⁵ |
|
μc |
Cathode viscosity (Pa·s) |
2.46×10⁻⁵ |
|
$M_{H_{2}}$ |
H2 molar mass (kg/mol) |
0.002 |
|
$M_{N_{2}}$ |
N2 molar mass (kg/mol) |
0.028 |
|
$M_{H_{2} 0}$ |
H2O molar mass (kg/mol) |
0.018 |
|
$M_{O_{2}}$ |
O2 molar mass (kg/mol) |
0.032 |
|
$D_{H_{2}-H_{2} O}^{e f f}$ |
H2-H2O binary diffusion coefficient (m2/s) |
1.1684×10⁻⁴ |
|
$D_{N_{2}-H_{2} O}^{e f f}$ |
N2-H2O binary diffusion coefficient (m2/s) |
3.2682×10⁻⁵ |
|
$D_{O_{2}-N_{2}}^{e f f}$ |
O2-N2 binary diffusion coefficient (m2/s) |
3.0466×10⁻⁵ |
|
$D_{O_{2}-H_{2} O}^{e f f}$ |
O2-H2O binary diffusion coefficient (m2/s) |
3.5807×10⁻⁵ |
|
T |
Cell temperature (K) |
353.15 |
|
Pref |
Reference pressure (Pa) |
1.01×10⁻⁵ |
|
$c_{O_{2}}$ |
Oxygen reference concentration (mol/m3) |
40.88 |
|
$c_{H_{2}}$ |
Hydrogen reference concentration (mol/m3) |
40.88 |
|
εmem |
The porosity of the membrane |
0.28 |
|
εele |
The porosity of the porous electrodes |
0.3 |
|
kele |
The permeability of the porous electrode (m2) |
2×10-14 |
|
$\sigma_{m e m}$ |
Membrane conductivity (S/m) |
9.5 |
|
F |
the Faraday constant (C/mol) |
96500 |
2.3 Model validation
To verify the model's accuracy, the electrochemical performance was tested based on a single cell test system. Besides, the calculated results are compared with the test data. Figure 4 compares the numerical results of the case#4 flow field with the polarization curves of the experimental data. The curve obtained by numerical simulation is basically consistent with the results measured by experiments. The I-V curve shows that the simulation results agree well with the experimental data.
Figure 4. Comparison of simulation results and experimental data
3.1 Fuel cell performance
Figure 5 shows the polarization and power density curves of PEMFC under the physical parameters shown in Table 2 for ten different angle cases, respectively. By comparison, it can be observed that flow channels with different angles have little difference in the region of low current density, where the activation polarization plays a significant role. In the high current density region where the ohmic loss domain, the difference between the polarization and power density curves corresponding to different channel structures gradually increases. In particular, compared with other cases, the polarization and power density curves of the flow channels with angles less than 15° decrease obviously.
(a)
(b)
Figure 5. The variations in the polarization and power density curve at various angle cases
Figure 6 compares the limiting current density and the maximum power density value between different angle design. As shown in Figure 6, both the limiting current density and maximum power density gained by the case#6 flow channel are superior to other flow channel cases. The value difference between case#4-7 is less than 2%. Therefore, it can be assumed that case#4-7 have similar effects on PEMFC performance. On the other hand, the limiting current density and the maximum power density value of case#1-3 are significantly lower than that of other cases, consistent with the apparent decrease in the polarization curve and power density curve of case#1-3.
Figure 6. The comparison of limiting current density and maximum power density at various angle cases
3.2 Oxygen mass fraction distribution
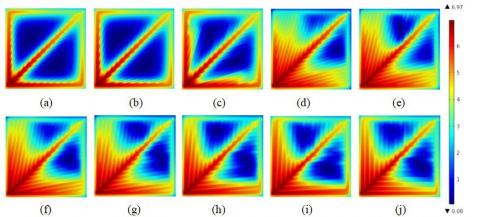
As illustrated in Figure 7, the oxygen mass fraction distribution at the interface of cathode gas diffusion layer and catalyst layer for different cases under the operating voltage of 0.65V. The molar concentration of oxygen molecules at the interface is distributed symmetrically on both sides of the main channel. The oxygen content in the main channel region is high and decreases slightly along the channel direction. The oxygen content in each sub-channel decreases along the flow direction. The total oxygen content near the sub-channel entrance is relatively higher than that near the exit. The lowest oxygen content in the whole flow field appeared near the outlet, which mainly due to the electrochemical reaction. As the oxygen consumption in the cathode flow channels increases from the inlet to the outlet, few oxygen reaches the outlet.
By comparing different cases, when the angle is more than 15°, as the angle increases, the oxygen concentration decreases in the sub-channel area. This phenomenon is particularly evident in the sub-channels near the outlets, which means less oxygen can reach this area to participate in the electrochemical reaction. This remarkably affects the electrochemical reaction in the flow channels. The oxygen concentration and distribution uniformity on the cathode diffusion layer of case#4 is the best. Because the sub-channels play a major role in the mass transport, the angle of 15° has the most dramatic effect on the improvement of the oxygen distribution efficiency. On the other hand, Figure 7 (a)-(c) shows that when the angle is less than 15°, the oxygen content in the sub-channel area increases sharply as the angle increases, which helps the reaction to proceed uniformly in the flow channels and enables the fuel cell to produce a more uniform current density distribution.
Figure 7. The comparison of oxygen distributions in cathode flow field: case (a) #1; (b) #2; (c) #3; (d) #4; (e) #5; (f) #6°; (g) #7; (h) #8; (i) #9; (j) #10
3.3 Water mass fraction distribution
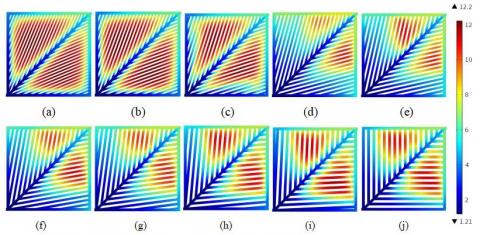
Figure 8 shows the water distribution in the cathode flow channels under the operating voltage of 0.65V. This is obvious that the water content in the main flow field is the lowest, and the water content in the sub-channels increases along the flow direction. The total water content near the outlet of sub-channels is obviously much higher than that near the inlet. The water generated in the electrochemical reaction blows towards the outlet by the gas, which causes the water gathered near the outlet. The water transport in the sub-channels plays an important role in the whole flow field. It is evident that when the angle is more than 15°, as the angle increases, the water content in the sub-channels increases. It is not conducive to the gas diffusion in the flow fields and full reaction. However, when the angle is less than 15°, the sub-channels water content increases sharply as the angle decreases. It is easy to block the flow channels, hinder gas diffusion, affect the reaction, and cause water flooding in severe circumstances, which leads to fuel cell performance deterioration. When the angle is 15°, the sub-channels can improve the uniformity of the water distribution most effectively.
Figure 8. The comparison of water distributions in cathode flow field: case (a) #1; (b) #2; (c) #3; (d) #4,; (e) #5; (f) #6; (g) #7; (h) #8; (i) #9; (j) #10
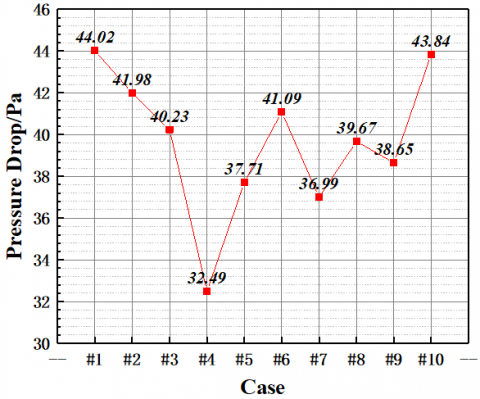
3.4 The pressure drop
Figure 9. The comparison of pressure drop from the inlet to the outlet at different angle cases
The pressure drop of reactant gas from the flow field inlet to the outlet is an important index to measure the flow field design. The higher pressure drop means more pump power consumed to transport the reaction gas in the flow field. Figure 9 shows the pressure drop of different angle design under the operating voltage of 0.65V. It can be seen from the figure that the pressure drop between the inlet and the outlet of the flow channels with case#4 is significantly lower than that of other cases.
In order to study the influence of the optimal angle of the bionic flow field on the PEMFC electrochemical performance and species transport capacity, ten cases of different angles betweent the main channel and sub-channels of the flow field were simulated. Results showed that with an appropriate increase in the angle between the main channel and sub-channels, the distribution uniformity of oxygen in the flow field had improved. Therefore, a more uniform distribution of current density had been generated. When the angle was higher than 15°, the oxygen content in the catalyst layer decreased sharply. By contrast, the water content in the flow field increases dramatically. At this point, increasing the angle causes more excess water, which results in the flow-field flooding and gas diffusion blocking.
Comprehensively analyzing the polarization and power density curves, oxygen distribution, water distribution, and the pressure drop, the optimal angle of the flow-field design based on the leaf-vein structure for PEMFC is presented. It is found that the proper angle ranges from 15° to 30°. In detail, when the fuel cell mostly operates in the area of high power density or limiting current density, the optimal angle is about 25°. When the fuel cell mostly works at low operating temperatures, the influence of oxygen and water content is essential. At this moment, the optimal angle is almost 15°. When the designed flow field is used in PEMFC stack, the stack's parasitic power is increased due to the high pressure drop from the cell inlet to the outlet. The pressure drop of case#4 is the lowest, which aids in improving the PEMFC system efficiency.
This work was supported by Jinan Science and Technology Development Plan (Grant No.: 201102026).
[1] Choi, K.S., Kim, H.M., Moon, S.M. (2011). Numerical studies on the geometrical characterization of serpentine flow-field for efficient PEMFC. International Journal of Hydrogen Energy, 36(2): 1613-1627. https://doi.org/10.1016/j.ijhydene.2010.10.073
[2] Manso, A.P., Marzo, F.F., Barranco, J., Garikano, X., Mujika, M.G. (2012). Influence of geometric parameters of the flow fields on the performance of a PEM fuel cell. A review. International journal of hydrogen energy, 37(20): 15256-15287. https://doi.org/10.1016/j.ijhydene.2012.07.076
[3] Chowdhury, M.Z., Genc, O., Toros, S. (2018). Numerical optimization of channel to land width ratio for PEM fuel cell. International Journal of Hydrogen Energy, 43(23): 10798-10809. https://doi.org/10.1016/j.ijhydene.2017.12.149
[4] Karvelas, E. G., Koubogiannis, D. G., Hatziapostolou, A., & Sarris, I. E. (2016). The effect of anode bed geometry on the hydraulic behaviour of PEM fuel cells. Renewable Energy, 93, 269-279. https://doi.org/10.1016/j.renene.2016.02.079
[5] Velisala, V., Srinivasulu, G.N. (2018). Numerical simulation and experimental comparison of single, double and triple serpentine flow channel configuration on performance of a PEM fuel cell. Arabian Journal for Science and Engineering, 43(3): 1225-1234. https://doi.org/10.1007/s13369-017-2813-7
[6] Chowdhury, M.Z., Timurkutluk, B. (2018). Transport phenomena of convergent and divergent serpentine flow fields for PEMFC. Energy, 161: 104-117. https://doi.org/10.1016/j.energy.2018.07.143
[7] Kloess, J.P., Wang, X., Liu, J., Shi, Z., Guessous, L. (2009). Investigation of bio-inspired flow channel designs for bipolar plates in proton exchange membrane fuel cells. Journal of Power Sources, 188(1): 132-140. https://doi.org/10.1016/j.jpowsour.2008.11.123
[8] Iranzo, A., Arredondo, C.H., Kannan, A.M., Rosa, F. (2020). Biomimetic flow fields for proton exchange membrane fuel cells: A review of design trends. Energy, 190: 116435. https://doi.org/10.1016/j.energy.2019.116435
[9] Ouellette, D., Ozden, A., Ercelik, M., Colpan, C.O., Ganjehsarabi, H., Li, X., Hamdullahpur, F. (2018). Assessment of different bio-inspired flow fields for direct methanol fuel cells through 3D modeling and experimental studies. International Journal of Hydrogen Energy, 43(2): 1152-1170. https://doi.org/10.1016/j.ijhydene.2017.06.073
[10] Liu, S., Chen, T., Xie, Y., Zhang, J.W., Wu, C.Q. (2019). Numerical simulation and experimental study on the effect of symmetric and asymmetric bionic flow channels on PEMFC performance under gravity. International Journal of Hydrogen Energy, 44(56): 29618-29630. https://doi.org/10.1016/j.ijhydene.2019.06.046
[11] Qiao, Y.Q. (2011). MEng Thesis. Wuhan University of Technology, Wuhan, China.
[12] Roshandel, R., Arbabi, F., Moghaddam, G.K. (2012). Simulation of an innovative flow-field design based on a bio inspired pattern for PEM fuel cells. Renewable Energy, 41: 86-95. https://doi.org/10.1016/j.renene.2011.10.008
[13] Lorenzini-Gutierrez, D., Hernandez-Guerrero, A., Ramos-Alvarado, B., Perez-Raya, I., Alatorre-Ordaz, A. (2013). Performance analysis of a proton exchange membrane fuel cell using tree-shaped designs for flow distribution. International journal of hydrogen energy, 38(34): 14750-14763. https://doi.org/10.1016/j.ijhydene.2013.08.012
[14] Kang, H.C., Jum, K.M., Sohn, Y.J. (2019). Performance of unit PEM fuel cells with a leaf-vein-simulating flow field-patterned bipolar plate. International Journal of Hydrogen Energy, 44(43): 24036-24042. https://doi.org/10.1016/j.ijhydene.2019.07.120
[15] Badduri, S.R., Srinivasulu, G.N., Rao, S.S. (2020). Influence of bio-inspired flow channel designs on the performance of a PEM fuel cell. Chinese Journal of Chemical Engineering, 28(3): 824-831. https://doi.org/10.1016/j.cjche.2019.07.010
[16] Katifori, E. (2018). The transport network of a leaf. Comptes Rendus Physique, 19(4): 244-252. https://doi.org/10.1016/j.crhy.2018.10.007
[17] Ramiar, A., Mahmoudi, A.H., Esmaili, Q., Abdollahzadeh, M. (2016). Influence of cathode flow pulsation on performance of proton exchange membrane fuel cell with interdigitated gas distributors. Energy, 94: 206-217. https://doi.org/10.1016/j.energy.2015.10.110
[18] Sezgin, B., Caglayan, D.G., Devrim, Y., Steenberg, T., Eroglu, I. (2016). Modeling and sensitivity analysis of high temperature PEM fuel cells by using Comsol Multiphysics. International journal of hydrogen energy, 41(23): 10001-10009. https://doi.org/10.1016/j.ijhydene.2016.03.142
[19] Frappé, E., De Bernardinis, A., Bethoux, O., Candusso, D., Harel, F., Marchand, C., Coquery, G. (2011). PEM fuel cell fault detection and identification using differential method: simulation and experimental validation. The European Physical Journal Applied Physics, 54(2): 23412. https://doi.org/10.1051/epjap/2011100277
[20] Peng, Y.J., Zhang, G.R., Wang, Y., Liu, Z.X., Huang, M., Zheng, Y.B. (2017). Differences on the Influences of Humidity of Cathod and Anode on the Performance of Proton Exchange Membrane Fuel Cell. Transactions of China Electrotechnical Society, 32: 196.
[21] Bezmalinović, D., Radošević, J., Barbir, F. (2014). Initial conditioning of Polymer Eelectrolyte Membrane fuel cell by temperature and potential cycling. Acta Chimica Slovenica, 62(1): 83-87. https://doi.org/10.17344/acsi.2014.730
[22] Ifrek, L., Cauffet, G., Chadebec, O., Bultel, Y., Rosini, S., Rouveyre, L. (2017). 2D and 3D fault basis for fuel cell diagnosis by external magnetic field measurements. The European Physical Journal Applied Physics, 79(2): 20901. https://doi.org/10.1016/j.electacta.2019.04.193