Ghzzai Almutairi* | Feraih Alenazey | Yousef Alyousef
OPEN ACCESS
This article flows the results of an exploratory investigation of a 100 W Solid Oxide Fuel Cell (SOFC) stack conduct and to assess its execution in the capacity of the repetition test with various temperatures in the wake of changing the mode to a Solid Oxide Electrolysis Cells (SOEC) and Co-Electrolysis. The 100 W stack comprises of 6 electrodes upheld cells, which were installed at the SOFC stack bench. This bench was intended to test short stacks in the power range 20-200 W, at the Water and Fuel Research Institute, KACST. In this examination, the 100 W SOFC operated at 650 – 750oC with H2 – air, to research the impact of reiteration on the execution of SOFC stack at diverse temperatures with the difference in the mode (SOFC-SOEC-SOFC). From the main result, the stack temperature assumed an imperative part in the execution of the stack. The maximum current density was 400 mA cm2 (at an average cell voltage of 0.75 V) and the maximum power was 90 W, at the stack operating temperature of 750oC. The result of the 6 cell stack was influenced by a reiteration test, where the cuurent was 20 A toward the start of the test and diminished to 15A at 750oC. It might be because of the debasement in a few cells' execution, which is because of expanding the area specific resistance (ASR) which was in the scope of 0.50 – 0.80 Ω cm2. And furthermore, the carbon deposition processes on the anode side surface.
solid oxide fuel cell, electrolysis, co-electrolysis, hydrogen produced, carbon deposition
Solid oxide fuel cells (SOFCs) are electrochemical reactors that can proficiently convert fuel gas, chemical fuel into electrical fuel with insignificant ecological dangers. SOFCs is a developing innovation for clean, solid and adaptable fuel production. The high-temperature SOFCs have a few favorable circumstances contrasted with different sorts of fuel components, for example, the contamination percentage, and higher electrical productivity (~75%) [1,2].
Furthermore, SOEC (Solid oxide electrolysis cells) innovation has the preferred standpoint that it can be based on the accessible solid oxide fuel unit (SOFC) innovation [3]. It can be operated in a reverse mode (SOECs and Co-Electrolysis) to electrolyze steam and carbon dioxide to produce syngas, which offers an optional approach to con-vert low-emission electrical fuel into stored chemical fuel. Where the SOFCs mode can be converted to SOECs mode to produce the synthe-sis gas, generally referred to as syngas, which is a blend of hydrogen and carbon monoxide [4]. Besides, joining both SOFC and SOEC in one mode can be a promising innovation to store electrical fuel as chemical fuel and to reconvert it into electricity upon request where it can produce hydrogen or from steam, which is then stored and in this manner used to produce fuel and heat (SOFC mode) [5].
The SOEC mode can produce hydrogen when a steam is introduced to the anode side of the SOEC, where it is diminished to hydrogen and afterward Oxide ions go through the electrolyte to the electrode where they recombine to form oxygen molecules, discharging two electrons, as the following equation (1) depict the electrochemical reactions in the SOEC.
$\mathrm{H}_{2} \mathrm{O}+$ electrical fuel $+$ heat $\rightarrow \mathrm{H}_{2}+1 / 2 \mathrm{O}_{2}$ (1)
Beside steam electrolysis, the SOEC mode is also capable of elec-trolyzing carbon dioxide into carbon monoxide and oxygen, as in the following equation (2) [6-10].
$\mathrm{CO}_{2}+$ electrical fuel $+$ heat $\rightarrow \mathrm{CO}+1 / 2 \mathrm{O}_{2}$ (2)
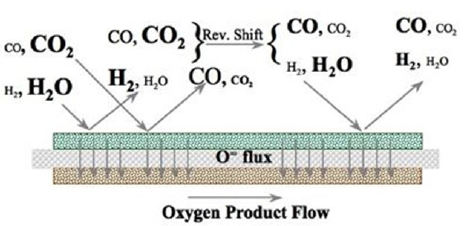
The SOFC mode can act as co-electrolysis to produce synthesis gas (syngas) when steam and carbon dioxide are electrolyzed to produce syngas, which is a blend of Hydrogen and carbon monoxide as shown in Figure 1 and the equations above [11-13].
Figure 1. Schematic view of the Co-Electrolysis processing [14]
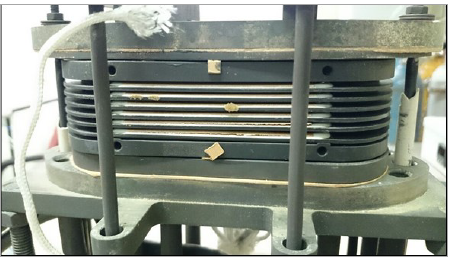
Figure 2. 100 W SOFC stacks
Figure 3. The testing bench for stacks in the fuel scope of 20-200 W
In this examination, we utilized 100 W SOFC stack, which depends on planar Solid Oxide Cells for the SOFC and SOEC applications as shown in Figure 2. The 6 cells comprise of a thin (ca. 10 μm) 8 mol % Y2O3 stabilized Zirconia (YSZ) electrolyte bolstered by a permeable Ni/YSZ fuel-electrode (ca. 250 μm). The Oxygen electrode depends on (La,Sr) (Co,Fe)O3-δ (LSCF) Perovskite and doped-Ceria obstruction layer, with a surface area of 48 cm2.
The anode and electrolyte layers are produced by the tape casting of water-based slurries. After water dissipates, the green tape is cut and sintered at high temperature to make the half (anode/electrolyte) cells. And after that, a Gd2O3-doped CeO2 diffusion boundary layer and the LSCF-based electrode are then connected to the half cells with screen printing and sintered. The stack comprises an assembly of 6 Ni-YSZ reinforced cells interfaced with proprietary SOFCONNEX™ gas dis-semination layers and Crofer 22 APU metallic inter-connectors. The latter is covered on the air side to decrease Cr evaporation.
Figure 3 demonstrates the testing bench, which is intended for stacks in the power scope of 20-200 W and it is outfitted with a reform-er/evaporator unit to perform tests in the natural gas steam improving and in the electrolysis mode. The evaporator/steam reformer unit is made by an evaporator, a blending chamber, a steam changing reactor, temperature, and the control and checking units. The reactor depends on the valuable metal catalyst. In the reformer reactor, the temperature can be balanced between 350 and 700 oC and the S/C was set between 2 and 2.5 with a specific end goal to have a methane transformation between 10 and 90%.
Table 1. Summarize the details of the operating equation under SOFC and SOEC modes
|
Tests |
T |
Total fuel flow rate |
H2 |
N2 |
H2O |
CO2 |
Air flow rate |
|
°C |
Nl/min |
vol % |
vol % |
vol % |
vol% |
Nl/min |
|
|
SOFC |
750 |
2.4 |
60 |
40 |
0 |
0 |
10 |
|
SOFC |
700 |
2.4 |
60 |
40 |
0 |
0 |
10 |
|
SOFC |
650 |
2.4 |
60 |
40 |
0 |
0 |
10 |
|
SOEC |
750 |
3.5 |
10 |
0 |
90 |
0 |
3.5 |
|
Co-electrolysis |
750 |
3.5 |
25 |
0 |
60 |
15 |
3.5 |
|
SOFC |
750 |
2.4 |
60 |
40 |
0 |
0 |
10 |
|
SOFC |
700 |
2.4 |
60 |
40 |
0 |
0 |
10 |
|
SOFC |
650 |
2.4 |
60 |
40 |
0 |
0 |
10 |
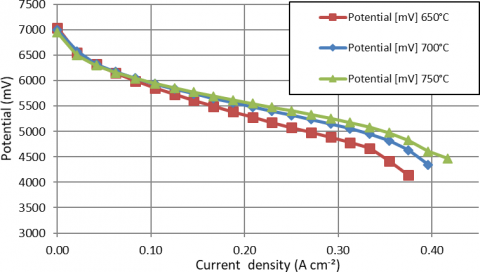
Figure 4. Influence of the stack temperature on the total potential of the stack
Figure 5. Influence of the stack temperature of the fuel
Firstly, The electrochemical stack was tested under the SOFC mode to consider the execution of the stack at various temperatures (650, 700 and 750 oC) and the anode was introduced by 2.4 Nl min-1 as blend fuel (60% H2 and 40 N2%). Air flow rate at the electrode side was 10 Nml min-1. The Cutoff voltage was set at 0.7 V to spare the stack. And after- ward the stack was tested under Solid Oxide Electrolysis (SOCE) and co-electrolysis (Steam + CO2) utilizing a similar aggregate flow rate at the fuel and oxygen electrode of 750 oC. At long last, the stack was converted to the SOFC mode at the same equation to study its execu- tion. An outline of the equations utilized amid the tests is given in Ta- ble 1. Keeping in mind the end goal to avert fuel-electrode oxidation at open circuit voltage, a little percentage of H2 was incorporated into the fuel gas flow. So as to counteract issues identified with carbon deposi- tion, H2O/CO2 co-electrolysis tests were performed at 750oC and the H2O/C proportion bolstered at the fuel-electrode-side was kept up to be above 2.
The measures of CO and H2 was investigated utilizing PerkinElmer Clarus' 680 GC Gas Chromatograph (GC). The content of residual CO2 in the gas blend downflow the stack was measured by Sensotec Rapidox's 3100 EA Dual Gas Analyzer. These estimations in the co- electrolysis mode were performed beginning from OCV up to 1.4 V, in steps comparing to the additions of 0.1 A cm2. At any progression, the GC estimation was performed subsequently to waiting 15 min for the adjustment of the voltage and temperature.
These gasses (hydrogen and syngas), which are produced by equa- tions 1 and 2, can be utilized to produce synthetic fuels, for example, natural gas (methane), liquid fuel (methanol or hydrocarbon) "fischer- Tropsch process" which are utilized as storage fuel for the SOFC appli- cations [15].
Many research endeavors have been made to comprehend the proce- dures amid SOFC-SOEC-SOFC operation deciding the decay of cell voltage after some time. The degradation phenomena issue due to the on testing equations, for example, flow-density, steam content in the fuel gas, steam conversion rate, and operating temperature. The degra- dation phenomena have been followed and talked about by R. Knibbe et al. [16].
There are heaps of degradation processes which have just been seen in the SOEF mode, because of extensive p(O2) gradient across the electrolyte [17], because of a more solid driving force for diffusion processes [18,19]. This may cause extra debasement features of those referred to from SOFC operation [16,20,21], for example, the diffusion processes and the development of oxygen in the electrolyte [16,18] and diverse oxygen movement in the oxygen anode and hereafter extraordi- nary catalytic activity for oxygen decrease and oxygen advancement as SOFC and SOEC, respectively [22]. Additionally, this causes delami- nation or microstructure degradation of the electrolyte/oxygen anode interface [23-25].
Also, the material of cell electrodes will cause some issue in the degradation of the cell execution. Laguna-Bercero et al. [26] presented and examined the execution of LSCF and LSM/YSZ oxygen electrode for the operated SOFC-SOEC at high temperature. They found that the aggregate ASR (area specific resistance) values have been found to diminish as indicated by LSM/YSZ > LSCF. Nguyen Q tested LSM, LSF, and LSCF as oxygen electrodes under both the fuel device and electrolysis operating mode. He found that the LSCF electrodes demon- strated the best execution and solidness on account of the most minimal estimations of ASR [27]. Therefore, blended conducting oxygen elec- trodes lanthanum strontium cobalt ferrites (LSCF) are presented as great contenders for reversible oxygen electrodes in high-temperature electrolysis cells.
The aims of this paper are to examine the impact of changing mode on the execution of a 100 W Solid Oxide Fuel Cell (SOFC) in the wake of operating the stack on steam electrolysis mode and co-electrolysis mode with various temperatures (650750 oC) to portray the execution and strength of the stack.
Initially, the stack was operated under the SOFC mode at the three unique temperatures (650, 700 and 750 oC) utilizing blend fuel (60 %H2 and 40% N2). The fuel was fed by 1.44 l min-1 H2 and 0.96 l min-1 N2 at anode side and the electrode was fed by 10 l min-1 air.
Figure 4 and Figure 5 demonstrates the average polarization curves and power of the stack which was gathered at 650, 700 and 750oC. These results will be taken as a kind of perspective curve for future work. The execution of the tested stack acquired in the principal testing under the operated SOFC was given the average results. Figure 4 demonstrates the voltage versus the current density (IV curve) for the primary result of the stack, which has been operated with 650, 700 and 750 oC temperatures. It can be seen that the open circuit voltage (OCV) was nearly the same for the three temperatures. The primary OCV val-ues were around 7000 mV and every cell was around 1.1 V. The cur-rent density recorded at 0.75 V, was measured as 0.35, 0.38 and 0.42 A cm-2 at 650, 700 and 750 oC, respectively.
As can be found in Figure 5, at 750 oC the maximum power of stack was 90 W at 0.42 A cm-2, though, the power of stack diminished to 82 W at 0.40 A cm-2 when the stack operated at 650oC. At low temperature (600 oC), the power of the stack was recorded by 74.5 W at 0.38 A cm-2.
It gives the idea that the stack temperature assumes a vital part in the execution of the stack. The expansion in temperature will prompt an increment in the execution of the stack. From the above curves, the stack showed great and homogeneous operating equation. Nonetheless, before playing out the test in the electrolysis and co-electrolysis mode, the data above were researched keep- ing in mind the end goal to influence a reference to the result of the next experiment. After this point, the operating equation of the stack was converted to electrolysis mode.
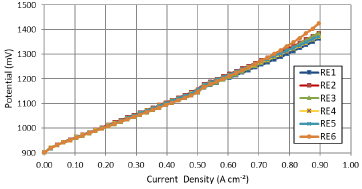
The electrolysis test comprises of the assessment of the execution of the stack at 750 °C, with proportions of water 90%. Investigation in the electrolysis mode has been performed by these following steps. Firstly, the IV Curve has been completed by expanding and reducing the flow. From that point onward, numerous GC examinations have been re- searched keeping in mind the end goal to determine the impact of the current density on the percentage of H2. This test has been rehashed 6 times under the same operating equations.
At a low current density (under 1.0 A cm-2), the execution of the stack tested under electrolysis mode was fundamentally the same as for each of the 6 times rehashed. Be that as it may, the polarization curves in every one of the 6 times rehashed were acquired at high current den- sity, which were influenced by expanding flow and expanding cell resistance accordingly [28]. It can be obviously seen after the 6th ex- periment.
Figure 7 demonstrates the measure of hydrogen production, which was produced from the stack tested under electrolysis mode. It can be seen that H2 production was influenced by expanding the current densi- ty. Where the most noteworthy measure of hydrogen production was acquired at the highest current density, which is around 0.18 mole.
The measure of the hydrogen produced is only a straight line since hydrogen production is directly relative to the stack current density. After this point, the stack operating equation will be converted to co- electrolysis mode to study the influencing parameters on the stack while changing the operating equations.
The co-electrolysis tests comprise of the assessment of the execution of the stack at 750°C, with 60% H2O and 15% CO2. As an initial step, H2O/CO2 co-electrolysis will be performed at 750°C to evade issues identified with carbon deposition. Likewise, the H2O/C proportion fed at the fuel-electrode-side will be kept up at 2.
An investigation in co-electrolysis mode has been performed by these steps. Firstly, the IV Curve has been done, with a flow-rate 0.05 A cm-2 for 60 seconds, by expanding and reducing the flow. From that point onward, the GC examinations have been explored keeping in mind the end goal to decide the impact of the flow density on the per- centage of H2 and measure of carbon. The flow rate was 0.1 A cm-² and the testing played out the estimation in the wake of waiting 10 minutes for the adjustment of the voltages and temperatures.
The figure 8 will flow the results of IV curves which were acquired in co-electrolysis mode, at 750°C, with 60% of steam, 15% of CO2 and 25% of hydrogen. This test has been rehashed 6 times under the same operating equations.
In the stack test of the co-electrolysis mode the maximum flow- density that will be reached, is 0.90 A cm-2 in order to avoid the occur- rence of carbon deposition on the surface of the anode side. As shown in figure 8, the stack gives a constant result through repeating the test 6 times. However, there is a bit difference in RE6 test at a high flow- density, because of cell resistance.
Figure 9: shows the amount of hydrogen produced which was pro- duced from the stack tested under the co-electrolysis mode. The behav- ior of hydrogen produced in the co-electrolysis test is the same as the previous behavior in the electrolysis test and the same case, taking into account that the amount of water is lower than in the previous, but the presence of carbon dioxide that reacts with water to form hydrogen and carbon monoxide as described in the equation:
$\mathrm{CO}_{2}+\mathrm{H}_{2} \mathrm{O}+$ heat $\rightarrow \mathrm{H}_{2}+\mathrm{CO}+\mathrm{O}_{2}$ (3)
The co-electrolysis mode process demonstrates that a similar meas- ure of hydrogen can be produced by utilizing a little measure of water contrasted with the electrolysis mode and production of carbon monox- ide when carbon dioxide is utilized as a part of the procedure to pro- duce syngas and the consumption of carbon dioxide, which safeguards the environment.
The GC results were utilized to compute the moles of carbon (in) and the moles of carbon (out). The measure of carbon will be figured by the following Equations:
Carbon in $=\frac{\frac{1}{3} * d\left(C O_{2}\right) * \text { vol }\left(C O_{2}\right)}{M\left(C O_{2}\right)}$
Carbon out $=\frac{\left.\frac{1}{3} * d\left(C O_{2}\right) * \text { Sample vol } G C \% C O_{2} G C\right)}{M\left(C O_{2}\right)}$
$+\frac{\left.\frac{1}{2} * d(C O) * \text { Sample vol } G C \% C O G C\right)}{M(C O)}$
Table 2, outline the results which were acquired from GC and as per the above formulas and the estimation of the moles of carbon at the inlet and outlet of the stack framework can be computed to demonstrate the impact of Current density on the measure of carbon which was found in the fumes of the stack framework while operating under the co-electrolysis mode process.
As indicated by these results, it can be seen that there is an enormous distinction between the moles of carbon at the outlet and at the inlet of stack framework while operating under the co-electrolysis mode pro-cess. The debasement that shows up inside the stack, could be the rea-son of this distinction, because of carbon deposition form on the sur-face of the anode side.
After being rehashed 6 times on the electrolysis mode and rehashed 6 times on the co-electrolysis, the stack was re-operated as a fuel cell mode to study the execution, impacts, and behavior, additionally, how it functions subsequent to confront the extreme operating equations.
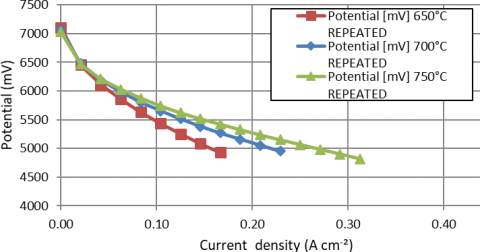
Figure 10 and figure 11 demonstrates the average polarization curves and fuel of the stack which were gathered in 650, 700 and 750 oC after electrolysis mode and co-electrolysis mode testing.
As can be found in Figure 10 and figure 11, at 750 oC the stack rec-orded the maximum current density and power of the stack which was 0.32 A cm-2 and 70W, respectively. Though, the power of the stack diminished to 54 W at 0.23 A cm-2 when the stack is operated at 650 oC. At low temperature (600 oC), the power of the stack was recorded at the lowest value by 40 W at 0.17 A cm-2.
Table 3 condenses the results of stack current in the fuel cell mode toward the start of the test and after the electrolysis mode and co-electrolysis mode testing, when the stack was re-operated as fuel cell unit again as per the above forecasts. From Table 3, the figure 10-11, the cells of stack seem to have some damage because of the harsh oper-ating equations.
From table 2 and table 3, it is likewise liable to produce carbon depo-sition on the surface of anode side. It can be noticed that the degrada-tion rate in the SOFC is high in light of the fact that the carbon deposi-tion form when the stack was operating with fuel containing hydrocar-bons, for example, methane or carbon dioxide, it is the most vital factor affecting the stability in a solid oxide fuel cell potential which is caus-ing quick debasement in the execution of stack [29].
Table 2. The value of the moles of carbon at the inlet and outlet of the stack system
|
Flow (A) |
Moles of carbon in (mol) |
Moles of Carbon out (mol) |
|
|
0,007784438 |
|
|
0A |
|
1,45336E-07 |
|
5A |
|
1,48775E-07 |
|
10A |
|
2,20617E-07 |
|
15A |
|
3,55885E-07 |
|
20A |
|
3,79878E-07 |
|
25A |
|
3,81282E-07 |
Table 3. The results of stack flow on fuel cell mode at beginning of testing and after electrolysis mode and co-electrolysis mode testing
|
|
1st time: Flow reached |
Repetition: Flow reached |
|
SOFC test 650℃ |
18A |
8A |
|
SOFC test 700℃ |
19A |
11A |
|
SOFC test 750℃ |
20A |
15A |
Figure 6. the summary of polarization curves of electrolysis mode, at 750° C with 90% of steam
Figure 7. The amount of hydrogen produced from electrolysis mode
Figure 8. the summarizing of polarization curves of co-electrolysis mode, at 750° C with 60% of steam, 15% of CO2 and 25% of H2
Figure 9. The amount of hydrogen produced from the co-electrolysis mode
Figure 10. Influence of electrolysis mode and co-electrolysis mode testing on the total power of the stacks
This investigation abridged some electrochemical estimations of the SOFC application with the electrolysis and co-electrolysis modes that have been performed keeping in mind the end goal to examine the con-duct of a 6-cells stack (SOFCs) and to assess its execution. Along these lines, it is accomplished to characterize the impacts of numerous pa-rameters (stack T, CO2 chemical and carbon deposition) on the execu-tion of the stack (Total Potential, power, and hydrogen produced). The following conclusions were drawn from the flow examination:
• The stack can work in numerous modes, for example, SOFC, SOEC and Co-electrolysis in the most ideal execution, as to acquire great results.
• It can utilize the stack modes to convert a low-value carbon form (CO2) to a high-value carbon form, for example, syngas or synfuel.
• It features a portion of the degradation that showed up inside the stack because of the high number of investigations that were done.
• Carbon deposition is an important factor in SOFC debasement, lead-ing to the direct structural damage to the anode surface, which is com-posed of carbon between the porous anode, resulting in the reduced surface area of reaction on the anode side.
[1] T. Komatsu, K. Watanabe, M. Arakawa, H. Arai., Journal of Fuel Sources, 193(2), 585 (2009).
[2] K. Kevin, Q. Nguyen, C. S. Singhal, High Temperature Solid Oxide Fuel Cells: Fundamentals, Design and Applications. Cell Stack and Designs, Elsevier Ltd., Oxford 2003, pp. 197–228.
[3] V. Nguyen, Q. Fang, U. Packbier, L. Blum., international journal of hydrogen fuel, 38, 4281 (2013).
[5] D. Klotz, A. Leonide, A. Weber , E. Ivers-Tiffee, International Journal of Hydrogen Fuel, 39, 20844 (2014).
[6] Laguna-Bercero MA. Recent steps in high temperature electrolysis using solid oxide fuel cells: a review. J Fuel Sources, 203, 4 (2012).
[7] Borglum B, Tang E, Pastula M., ECS Trans, 35, 63 (2011).
[8] Elangovan S, Hartvigsen J, Larsen D, Inlet I, Zhao F., ECS Trans, 35, 2875 (2011).
[9] Minh Nguyen Q., ECS Trans, 35, 2897 (2011).
[10] Hayashi K, Miyasaka A, Katou N, Yoshida Y, Arai H, Hirakawa M, et al., ECS Trans, 35, 121 (2011)
[11] R. Green, C. Liu, S. Adler., Solid State Ion, 179(17-18), 647 (2008).
[12] F. Bidrawn, G. Kim, G. Corre, J. Irvine, j. Vohs, R. Gorte., Electro-chem Solid State Lett., 70, 11:B167 (2008).
[13] S. Ebbesen, M. Mogensen., Journal of Fuel Sources, 193(58), 349 (2009).
[15] M. Dry, Catal. Today, 71, 227 (2002).
[16] Ruth Knibbe, Marie Lund Traulsen, Anne Hauch, Sune Dalgaard Ebbesen, and Mogens Mogensen, Electrochem. Soc., 157(8), B1209 (2010).
[17] T. Jacobsen, M. Mogensen, ECS Trans. 13(26), 259 (2008).
[18] M. Martin, Solid State Ionics, 136e137, 331 (2000).
[19] M. Martin, J. Chem. Thermodyn., 35, 1291 (2003).
[20] H. Yokokawa, H.Y. Tu, B. Iwanschitz, A. Mai, J. Fuel Sources, 182, 400 (2008).
[21] H. Nabielek, L. Blum, H.P. Buchkremer, V.A.C. Haanappel, L.G.J. de Haart, W.J. Quadakkers, R. Steinberger-Wilckens, R.W. Stein-brech, U. Reisgen, F. Tietz, Ceram, Eng. Sci. Proc., 28(4), 65 (2009).
[22] A. Hauch, S.D. Ebbesen, S.H. Jensen, M. Mogensen, J. Mater. Chem. 18, 2331 (2008).
[23] J.S. Herring, J.E. O’Brien, C.M. Stoots, G.L. Hawkes, J.J. Hartvigsen, M. Shahnam, Int. J. Hydrog. Fuel, 32, 440 (2007).
[24] A.V. Virkar, Int. J. Hydrog. Fuel, 35, 9527 (2010).
[25] J.R. Mawdsley, J.D. Carter, A.J. Kropf, B. Yildiz, V.A. Maroni, Int. J. Hydrog. Fuel, 34, 4198 (2009).
[26] M.A. Laguna-Bercero, J.A. Kilner, S.J. Skinner, Chem Mater, 22, 1134 (2010).
[27] Guyen Q. Minh, ECS Trans, 35, 2897 (2011).
[28] O. A. Marina, L. R. Pederson, M. C. Williams, G. W. Coffey, K. D. Meinhardt, C. D. Nguyen, and E. C. Thomsen, J. Electrochem. Soc., 154(5), B452 (2007).
[29] G. Almutairi, Y. Alyousef and F. Alenazey, J. New Mat. Electro-chem. Systems, 20, 129 (2017).