Yan Lv* | Lu Yang | Fanyang Bu | Jixin Yang
© 2023 IIETA. This article is published by IIETA and is licensed under the CC BY 4.0 license (http://creativecommons.org/licenses/by/4.0/).
OPEN ACCESS
Considering the shortcomings of traditional detection methods of abalone freshness, such as cumbersome operation and low accuracy, this study established a rapid detection method of abalone freshness by using an electronic tongue. A sensor array consisting of eight inert metal electrodes (Au, Pd, Pt, Ag, Ti, Al, Ni, W) was used for detection. However, the detection data of redundant sensors will affect the efficiency and accuracy of detection, so the sensor array needs to be optimized. The original sensor array consisting of eight inert metal electrodes was used to detect four kinds of abalone meat (refrigerated at 4℃ for 1 day, 4 days, 7 days and 10 days) with different freshness. The detection data were analyzed by one-way analysis of variance. According to the analysis results, Al and Pt electrodes with poor stability and differentiation were eliminated. Multiple comparative analysis of variance was used to conduct a significant analysis of the data of the remaining six electrodes. According to the significant difference, the electrodes without significant difference were divided into different groups to obtain four combinations. By combining principal component analysis and support vector classification, the performance of the original array composed of eight electrodes and the four groups of sensor arrays obtained after grouping were analyzed, and the most suitable sensor array for abalone freshness detection was selected. The results showed that the group III sensor array composed of Ag, Pd and Ti electrodes had the best effect on the freshness identification of abalone.
abalone, freshness, optimization of sensor arrays, analysis of variance, principal component analysis, support vector classification
Abalone is a rare marine shellfish, which is rich in protein, vitamins and trace elements, and is known as the "soft gold" of the ocean. However, due to its rich nutrition, when enzymes and microorganisms interact together, abalone is prone to decay and deterioration in the process of storage and sale, resulting in an unpleasant odor, thus reducing the nutritional value and flavor of abalone, and even producing some harmful substances, leading to food safety problems [1]. Therefore, it is very important to test the freshness of abalone in the process of production and sale. At present, sensory evaluation, chemical index detection, physical analysis, microbial method and so on are mostly used for freshness detection. These methods are generally cumbersome, time-consuming and laborious, and cannot obtain an ideal detection accuracy [2, 3]. Therefore, it is particularly important to use new technology and new methods to improve detection efficiency and accuracy.
In recent years, the electronic tongue has been widely used in many fields as a new kind of sensory bionic technology. Its sensors are sensitive to specific compounds and can simulate the human taste system, learn and recognize through pattern recognition and expert system, and analyze samples with different freshness [4, 5]. Compared with traditional detection methods, the electronic tongue has the advantages of simple sample pretreatment, fast detection speed and easy automation. Jia et al. [6] used partial least square (PLSR) and multiple linear regression (MLR) to construct a quantitative prediction model for predicting the total viable count (TVC) of Takifugu Bimaculate during refrigeration (0℃ and 4℃) by electronic tongue signal and realized the rapid freshness detection of Takifugu Bimaculate by the electronic tongue. Wadehra et al. [7] tested the change in the quality and storage time of unsealed pasteurized milk based on the voltammetric electronic tongue, combined with principal component analysis and cluster analysis, and found that physical and chemical indexes such as TVC, viscosity and acidity in milk samples were consistent with the chromatograms of principal component analysis and cluster analysis of electronic tongue. This indicates the feasibility of electronic tongue in milk quality detection. Existing research results show that electronic tongues can be used for food freshness detection, but the detection accuracy is not high enough. The reason lies in the lack of optimization of the sensor array in the research of freshness prediction using an electronic tongue. The sensor array is the core component of the electronic tongue system, and its performance directly affects the test result of the electronic tongue. Due to the complex material composition, if the sensor array is not selected and optimized specifically, the introduction of redundant sensors with poor identification effect will lead to the redundancy of electronic tongue detection data and affect the efficiency and accuracy of the identification model, thus affecting the detection results [8-11]. In order to improve the efficiency and accuracy of the electronic tongue, the sensor array should be optimized on the basis of the characteristics of detection objects to obtain the most suitable sensor array.
In this paper, the sensor array for abalone freshness detection was optimized. Spss and Matlab software was used to analyze the sensor detection data. Origin software was used for mapping. Based on the results of a one-way analysis of variance, sensors with poor stability and differentiation for abalone freshness identification were eliminated, and the sensor array was initially screened [12]. After multiple comparative analyses, significant differences between the sensors were obtained, and the sensors were classified and combined into different groups. Finally, principal component analysis and support vector machine classification were used to select the best performance of the sensor array and realized the optimization of the sensor array used to identify abalone freshness.
2.1 Experimental materials and pretreatment
Abalones used in this experiment were purchased from a supermarket in Dalian. Fresh abalone, each weighing 60±5g, was selected and processed immediately after being transported to the laboratory. The abalone meat after removal of viscera and hemline was placed in a clean ziplock bag and refrigerated in a constant temperature refrigerator at 4℃.
2.2 Experimental apparatuses
The experiment was conducted using an electronic tongue system built by our research team, which consisted of a sensor array, an electrochemical workstation and a computer. The sensor array is a three-electrode system composed of working electrodes, an auxiliary electrode and a reference electrode. The working electrodes are composed of eight inert metal disk electrodes with a diameter of 2mm, including aurum (Au), palladium (Pd), platinum (Pt), nickel (Ni), argentum (Ag), titanium (Ti), aluminum (Al) and wolframium (W). The auxiliary electrode is a platinum column electrode with a diameter of 1mm (Pt010). The reference electrode is an argentum-argentic chloride electrode (R0303). All electrodes is purchased from Tianjin Aida Hengsheng Technology Development Co., LTD. The experimental electrochemistry workstation is a product of Shanghai Chenhua Instrument Co., LTD. (CHI620E). In addition, the instruments and equipment used in the experiment are an electronic scale provided by Shanghai Youke Scientific Instrument Co., LTD. (FA1004B), a tissue masher provided by Vanke Instrument Changzhou Co., LTD. (JJ-2B), a centrifuge provided by Shanghai Shangpu Instrument and Equipment Co., LTD. (SN-LSC-40), an electric thermostatic drying oven provided by Shaoxing Shangcheng Instrument Manufacturing Co., LTD. (101-00A), a refrigerator provided by Guangdong Midea Electric Appliance Co., LTD. (BCD-172CM(E)) and an ultrasonic cleaning machine provided by Kunshan Ultrasonic Cleaning Instrument Co., LTD. ( KQ-2200DB).
2.3 Experimental method
On the 1st, 4th, 7th and 10th day of the experiment, 50g of abalone meat stored in the refrigerator (4℃) was weighed, chopped and added with 300ml purified water, mashed (homogenized) in the masher for 3 minutes, centrifuged at 4000r/min for 10min. After standing, the supernatant was taken for testing [12-14]. The supernatant of 180ml was taken and divided into 3 equal parts of 60ml each, every part was tested 5 times at room temperature (25℃), and the obtained data were recorded.
Cyclic voltammetry was used as the excitation of the sensor array in order to obtain electrochemical response signals in the experiment, and the parameters of cyclic voltammetry were set in Table 1. In this method, potential signals of linear change at a certain rate were applied to the study electrode within a certain potential range. When the potential reached the upper (lower) limit of the scanning range, it was reversely scanned to the lower (upper) limit, that was, triangle wave potential signal scanning. Meanwhile, the current response on the electrode during the potential scanning process was automatically measured and recorded. The resulting current-potential curve is called the cyclic voltammogram [15], according to which the characteristics of electrochemical reactions can be analyzed.
Table 1. Parameter setting of cyclic voltammetry
|
Initial potential (V) |
High potential (V) |
Low potential (V) |
Scanning rate (V/s) |
Sampling interval (V) |
Sensitivity |
|
-0.9 |
1 |
-0.9 |
0.1 |
0.001 |
e-5 |
2.4 Data processing and analytical method
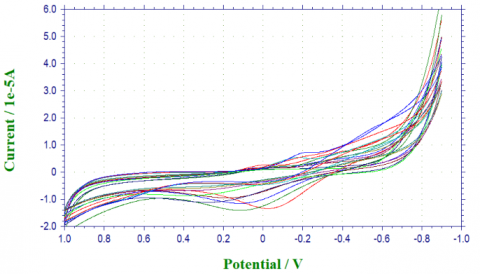
Figure 1. The response curve of the Pd electrode to four kinds of abalone meat liquid with different freshness
According to the above experimental methods, the self-constructed electronic tongue was used to detect four kinds of abalone meat liquid with different freshness (Refrigerated at 4℃ for 1 day, 4 days, 7 days and 10 days), and the cyclic voltammetry characteristic curves were obtained. The cyclic voltammetry characteristic curves of four kinds of abalone meat liquid with different freshness were superimposed for observation and analysis. Figure 1 shows the voltammetry characteristic curve obtained by Pd electrode detection of four kinds of abalone meat liquid with different freshness. The minimum point on the curve was a distinguishing feature point, which was taken as the characteristic value of one measurement. A total of 60×8 data matrix was obtained in the experiment, in which 8 was the characteristic value of eight electrodes, and 60 referred to the 60 groups of data obtained by setting 3 samples for each of four kinds of abalone meat samples with different freshness and testing each sample for 5 times. The Grubbs method was used to eliminate abnormal data and the significant β=0.05. After the elimination of abnormal data, the average value of 5 repeated measurements of each sample was taken as the characteristic value of the sample, and a 12×8 data matrix was obtained. In addition, in order to eliminate dimensional differences between characteristic data, data need to be standardized [16]. The commonly used methods include the min-max and z-score standardization methods [17, 18]. In this paper, z-score standardization was adopted to form a standardized matrix of the sample data matrix. Statistical analysis can be conducted on the data after data preprocessing.
3.1 Analysis of variance (ANOVA)
The response performance of the sensors can directly affect the performance of the system [19]. So the stability of the response to the same sample and the differentiation of the response to different samples are the standards to distinguish the performance of sensors [20]. One-way ANOVA was used to eliminate the sensors with poor stability and differentiation. Each sensor was taken as a factor and the response signal characteristic values of 12 samples were taken as the level to form a 12×8 data matrix for the homogeneity test of variance. One-way ANOVA was carried out on the data matrix conforming to the homogeneity test of variance, and the results were shown in Table 2.
Table 2. Results of one-way ANOVA of the sensor response value
|
Sensor name |
Intra-class mean square (´10-3) |
F value |
P value |
|
Ag |
0.005072 |
5.72 |
0.0217 |
|
Al |
0.09116 |
1.33 |
0.3301 |
|
Au |
0.0002 |
36.75 |
5.01393e-0.5 |
|
Ni |
7.43E-05 |
5.62 |
0.0227 |
|
Pd |
0.00032 |
20.09 |
0.0004 |
|
Pt |
0.00179 |
2.33 |
0.1503 |
|
Ti |
2.48E-05 |
11.22 |
0.0031 |
|
W |
0.00261 |
12.64 |
0.0021 |
The intra-class mean square value represents the stability of the sensor response to samples. The smaller the intra-class mean square is, the better the stability of the sensor. F and P values represent the differentiation of the sensor response to samples. The larger the F value and the smaller the P value is, the better the sensor can differentiate between different samples. The intra-class mean square value is less than 0.01 and the P value is less than 0.05, indicating that the sensor can be used for sample identification [21, 22].
As can be seen from Table 2, Al electrode had poor stability and differentiation, while Pt electrode had poor differentiation. The other six electrodes showed good stability and differentiation. Therefore, Al and Pt electrodes were excluded. In order to find whether there were significant differences between the remaining six electrodes of Ag, Au, Ni, Pd, Ti and W, the multiple comparative analysis of variance was further carried out, and the results were shown in Table 3.
As can be seen from Table 3, there were no significant differences between Au, Ni, Pd and W electrodes at the significant level of 5%. Therefore, when constructing a sensor array, one of the four electrodes of Au, Ni, Pd and W can be selected to combine with Ag and Ti electrodes, and the six electrodes can be combined into four groups, labeled as groups Ⅰ, Ⅱ, Ⅲ and IV. Group I includes Ag, Au and Ti, group Ⅱ includes Ag, Ni and Ti, group Ⅲ includes Ag, Pd and Ti, and group Ⅳ includes Ag, W and Ti, respectively.
Table 3. Results of multiple comparative analysis of variance of the sensor response performance
|
Sensor name |
Mean value |
5% significance level |
|
Ag |
0.93013 |
a |
|
Au |
0.68059 |
c |
|
Ni |
0.68382 |
c |
|
Pd |
0.68043 |
c |
|
Ti |
0.71299 |
b |
|
W |
0.60908 |
c |
3.2 Principal component analysis (PCA)
Principal component analysis (PCA) is an unsupervised and visual multivariate analysis technique. The function of PCA is to reduce the dimension of multidimensional data. A few principal components are used to describe the entire sample [23, 24]. The new variable of PCA is called the principal component (PC), The expression to calculate the score of the principal component is:
$Y=V^T X^*$ (1)
The cumulative contribution rate $Q_k$ of the first k principal components is:
$Q_k=\frac{\sum_{i=1}^k \lambda_i}{\sum_{i=1}^n \lambda_i}, k \leq n$ (2)
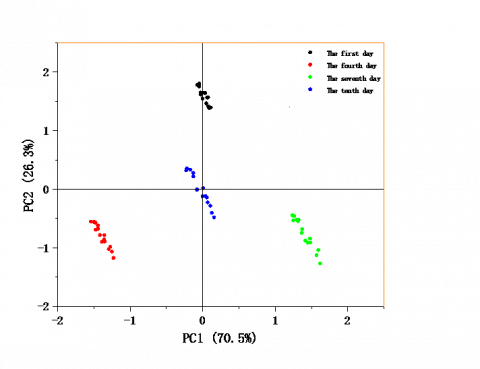
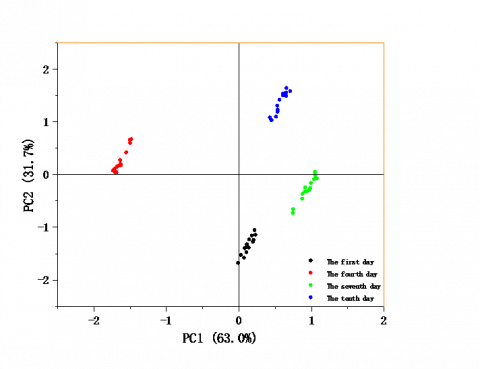
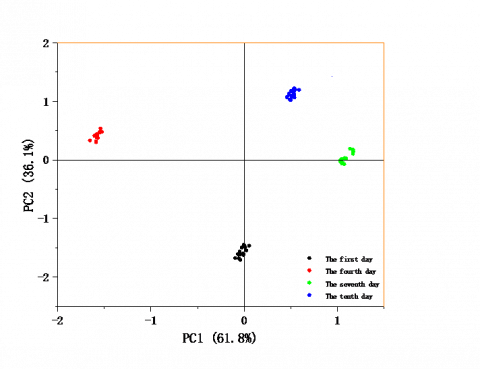
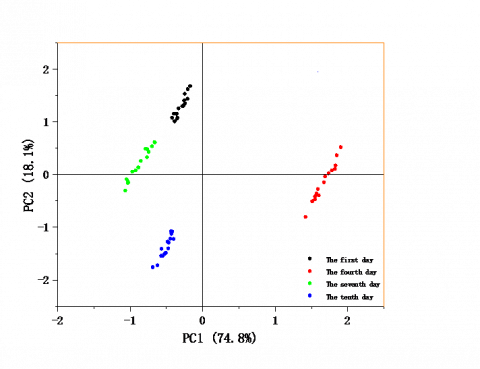
In the above formulas, Y is the principal component, $X^*$ is the standardized matrix of the sample data matrix, $V$ is the eigenvector matrix corresponding to the eigenroot root $\lambda_i(i=1,2, \ldots, n)$. The higher the cumulative contribution rate of principal components, the more sample components can be detected by the sensor array, and the better the sensor identification of samples [25-27]. The initial sensor array contained by eight sensors is the original sensor array, and the four groups of sensor arrays (groups Ⅰ, Ⅱ, Ⅲ and IV) obtained by the above analysis of variance are the newly combined arrays. In order to study the identification ability of the original sensor array and four groups of newly combined sensor arrays on the freshness of abalone, PCA was conducted on the 60×8 response data matrix of the original sensor array and the 60×3 response data matrix of the four groups of newly combined sensor arrays respectively. The results were shown in Table 4 and Figure 2 to Figure 6.
According to the results of PCA, the cumulative contribution rates of the first two principal components of the four groups of newly combined sensor arrays were higher than that of the original sensor array, indicating that the newly combined sensor array can cover more sample information and had stronger identification ability for the freshness of abalone. The cumulative contribution of the group III sensor array was the highest at 97.9%. It can also be seen from the PCA charts that compared with the original sensor array, the samples of the same species are more concentrated in the PCA charts of the newly combined sensor array, especially the group III sensor array, which indicates that it has the best sample identification ability.
Table 4. PCA results of the original and newly combined sensor arrays on the four kinds of abalone meat with different freshness
|
Sensor array name |
The variance contribution rate of the first principal component (PC1) |
The variance contribution rate of the second principal component (PC2) |
Cumulative variance contribution rate of the first and second principal components (PC1+PC2) |
|
Original array |
60.2% |
23.1% |
83.3% |
|
Group I array |
70.5% |
26.3% |
96.8% |
|
Group II array |
63% |
31.7% |
94.7% |
|
Group III array |
61.8% |
36.1% |
97.9% |
|
Group IV array |
74.8% |
18.1% |
92.9% |
Figure 2. PCA chart of the original sensor array detecting four kinds of abalone meat with different freshness
Figure 3. PCA chart of the group I sensor array detecting four kinds of abalone meat with different freshness
Figure 4. PCA chart of the group II sensor array detecting four kinds of abalone meat with different freshness
Figure 5. PCA chart of the group III sensor array detecting four kinds of abalone meat with different freshness
Figure 6. PCA chart of the group IV sensor array detecting four kinds of abalone meat with different freshness
3.3. Support vector machine (SVM)
Support vector machine is a supervised machine learning method based on statistical learning theory, which can analyze data, identify patterns, and be used for classification and regression analysis. As a classification model, SVM can map the input vector to a high-dimensional feature space through some pre-selected nonlinear mapping, and construct the optimal classification hyperplane in this space to maximize the separation boundary between different samples, so that the samples can be divided into different categories [28, 29].
Based on the principal component analysis, the support vector machine model was used to classify 60 groups of detection data of abalone samples with different freshness from the original sensor array and four groups of newly combined sensor arrays. Among them, 40 groups of data were used for model training and 20 groups of data were used for model testing to compare the recognition accuracy of the original sensor array and the four groups of newly combined sensor arrays. In this paper, the radial basis function (RBF) was selected as the kernel function of the support vector machine, as shown in the formula below:
$K\left(x, x_k\right)=\exp \left(\frac{\left\|x-x_k\right\|^2}{2 \gamma^2}\right)$ (3)
In the formula, x is the input vector, $x_k$ is the RBF center, and γ represents the width of the nucleus.
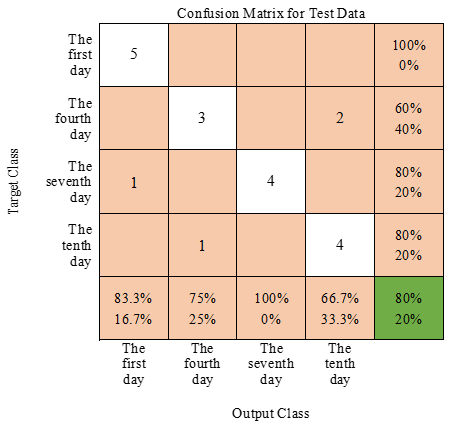
Figure 7. Confusion matrix of SVM test set of the original sensor array
Figure 8. Confusion matrix of SVM test set of the group I sensor array
Figure 9. Confusion matrix of SVM test set of the group II sensor array
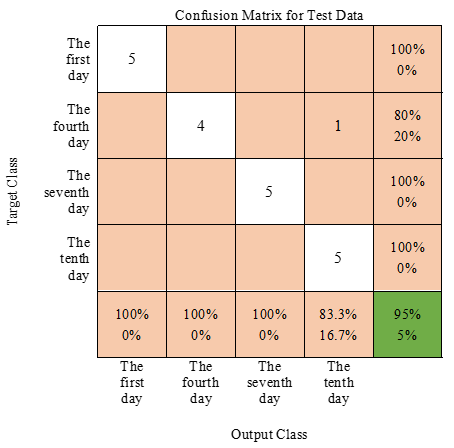
Figure 10. Confusion matrix of SVM test set of the group III sensor array
Figure 11. Confusion matrix of SVM test set of the group IV sensor array
In order to achieve a better classification effect, the penalty parameter C and the kernel parameter γ in the support vector machine model should be optimized, and the combination (C, γ) can be optimized by the particle swarm optimization algorithm [30, 31]. The particle population was set to 20, the maximum number of iterations was set to 100, and the value range of C and γ is [10-2,103]. Finally, the particle swarm optimization algorithm was used to optimize the parameters of the support vector machine. When C=63, γ=0.1839, the model classification effect was the best, and then the optimal parameters were obtained. The test set was used to test the optimized support vector machine model, and the confusion matrix of the test set was obtained, as shown in Figure 7 to Figure 11.
It can be seen that in the confusion matrix of the SVM test set of the original sensor array, two samples belonging to the fourth day were misjudged as the tenth day,1 sample belonging to the seventh day and 1 sample belonging to the tenth day were misjudged as the first day and the fourth day respectively, so the accuracy rate obtained by the SVM classifier was 80%. In the confusion matrix of the SVM test set of the group Ⅲ sensor array, 1 sample belonging to the fourth day was misjudged as the tenth day, and the accuracy of the SVM classifier was 95%. The accuracy of the SVM classifier for detection data of the group I, II and IV sensor arrays was 90%, 85% and 90%, respectively. As can be seen from the confusion matrix figures above, for abalone samples with four kinds of different freshness, the classification accuracy of the SVM model of the newly combined sensor arrays was higher than that of the original array, especially the classification accuracy of the group Ⅲ was better than that of other groups.
Through principal component analysis and support vector machine classification, it can be seen that the group Ⅲ sensor array is superior to the original sensor array and the other three groups of newly combined sensor arrays in terms of sample information coverage and classification recognition performance. Therefore, the group Ⅲ sensor array (Ag, Pd, Ti) is selected to identify the freshness of abalone to achieve the best results.
A sensor array composed of eight inert metal electrodes was used to identify four kinds of abalone with different freshness. Based on the signal data of the sensor array, the optimization of the sensor array was carried out by analysis of variance, principal component analysis and support vector machine.
(1) In the one-way analysis of variance, the stability of the sensor response to the same sample and the differentiation of the sensor response to different samples was determined by the intra-class mean square value, F value and P value. The sensors which meet the requirements of stability and differentiation, can be further analyzed by multiple comparison analyses, and the sensors were classified and combined according to their significant differences.
(2) The results of the principal component analysis showed that the cumulative variance contribution rates of the first two principal components of the newly combined sensor arrays were improved, among which group III had the highest cumulative variance contribution rates of the first two principal components, reaching 97.9%. This indicates that the group III sensor array exhibits the best ability to distinguish samples.
(3) The results of the support vector machine were consistent with those of the principal component analysis. The classification performance of the group Ⅲ sensor array is better than other groups, which further verifies the results of principal component analysis.
This study is funded by the Natural Science Found of Liaoning Province (2021-MS-300) and the Scientific Research Fund of Liaoning Provincial Education Department (LJKZ0526).
[1] Li, S.P., Chao, S.S., Gao, S.L. (2019). Current situation and countermeasures of the abalone aquaculture industry in China. Jiangxi Aquatic Science and Technology, 2019(6): 44-46. https://doi.org/10.3969/j.issn.1006-3188.2019.06.017
[2] Chen, S.J., Zhang, X.F., Pan, C., Xue, Y., Wang, Y.Q., Wu, Y.Y., Huang, H., Hu, X. (2022). Recent progress in quality evaluation of aquatic products. Meat Research, 36(6): 53-59. https://doi.org/10.7506/rlyj1001-8123-20220110-001
[3] Lv, R., Huang, X., Xin, J., Jiang, F., Mu, L., Gu, F., Han, F. (2015). Research progress on detection methods for fish freshness. Journal of Agricultural Science and Technology (Beijing), 17(5): 18-26.
[4] Zhang, J.H., Wang, H.D., Shao, L.T., Xu, X.L., Wang, H.H. (2022). Progress and trends in rapid novel technologies for characterization of fresh meat freshness: A review Food Science, 43(13): 210-217. https://doi.org/10.7506/spkx1002-6630-20210508-074
[5] Yang, M.Y., Cai, Y.Y., Xie, J., Lu, Y. (2020). Research progress on rapid detection technology of fish freshness. Science and Technology of Food Industry, 41(9): 334-339. https://doi.org/10.13386/j.issn1002-0306.2020.09.054
[6] Jia, Z., Chen, X.T., Pan, N., Cai, S.L., Zhang, Y., Liu, Z.Y. (2021). The freshness of frozen fugu bimaculatus detected by electronic tongue. Modern Food Science and Technology, 37(05): 220-229. https://doi.org/10.13982/j.mfst.1673-9078.2021.5.0994
[7] Wadehra, A., Patil, P.S. (2016). Application of electronic tongues in food processing. Analytical Methods, 8(3): 474-480. https://doi.org/10.1039/C5AY02724A
[8] Wei, G.F., Li, M.D., Zhao, J., Kong, W.F., Zhang, X.S. (2022). Determination of SO2 in wine based on DFI-RSE electronic nose sensor array optimization. Transactions of the Chinese Society of Agricultural Engineering, 38(7): 291-299.
[9] Zhang, S., Han, S., Xiong, L., Hou, Y., Gao, X., Tang, X. (2022). Detection of stored grain pests Tribolium castaneum (Herbst) based on the feature optimization of gas sensor array. Transactions of the Chinese Society of Agricultural Engineering, 38(10): 303-309.
[10] Wang, X.D., Xu, L.P., Wang, H.M., Cai, Y.M., Jin, J.H., Zhu, L.T. (2017). Optimization method of sensor array for quick detection of taste quality of beef. Transactions of the Chinese Society for Agricultural Machinery, 48(7): 332-338. https://doi.org/10.6041/j.issn.1000-1298.2017.07.042
[11] Zhang, T., Sun, Q., Yang, L., Yang, L., Wang, J. (2017). Vigor detection of sweet corn seeds by optimal sensor array based on electronic nose. Transactions of the Chinese Society of Agricultural Engineering, 33(21): 275-281. https://doi.org/10.11975/j.issn.1002-6819.2017.21.034
[12] Yang, R.Q., Chen, Y.L., Sun, L.C., Zhang, L.J., Liu, G.M., Cao, M.J. (2023). Quality change of sea bass (Lateolabrax japonicas) Muscle during cold storage at 4 ℃. Food Science, 44(01): 239-245. https://doi.org/10.7506/spkx1002-6630-20211210-126
[13] Zhang, B.H., Li, X.P., Li, J.R., Yang, Q., Wei, Z.P., Xie, J., Wang, Y.B., Ding, Y.T. (2022). Construction of freshness prediction model for refrigerated large yellow croaker (Larimichthys crocea) based on the characteristic volatile compounds. Journal of Bohai University (Natural Science Edition), 43(2): 140-154. https://doi.org/10.3969/j.issn.1673-0569.2022.02.006
[14] Zheng, S.W., Chen, W.H. (2019). EvaIuation of cod freshness based on electronic nose and electronic tongue technology. China Condiment, 44(5): 164-169. https://doi.org/10.3969/j.issn.1000-9973.2019.05.038
[15] Lv, Y., Zhang, X., Zhang, P., Wang, H., Ma, Q., Tao, X. (2021). Comparison between voltammetric detection methods for abalone-flavoring liquid. Open Life Sciences, 16(1): 354-361. https://doi.org/10.1515/biol-2021-0035
[16] Hou, Q.K. (2019). Development of testing device for taste quality of abalone conditioning liquid. Da Lian: Dalian Polytechnic University.
[17] Fan, Y.G., He, M., Lin, H.X., Chen, B., Zhou, S.P. (2014). BP neural network application research in petrochemical tower system corrosion prediction. In Applied Mechanics and Materials, 488: 487-491. https://doi.org/10.4028/www.scientific.net/AMM.488-489.487
[18] Liu, X.Y. (2021). Research on optimization algorithm of electronic nose sensor array based on feature selection. Chong Qing: Chongqing University of Posts and Telecommunications.
[19] Lv, Y., Zhang, Z., Hou, Q.K., Li, X.C., Zhang, X.Y., Sun, J.L., Zhang, X., Tao, X.H. (2019). Optimization of sensor arrays for the identification of abalone flavoring liquids. Journal of New Materials for Electrochemical Systems, Vol. 22, No. 2, pp. 102-106. https://doi.org/10.14447/jnmes.v22i2.a07
[20] Wang, W., Wei, R.F., Guo, Y.L. (2019). Optimization of rapid detection of volatile compounds in oolong tea by electronic nose sensors. Journal of Tropical Crops, 40(3): 583-589. https://doi.org/10.3969/j.issn.1000-2561.2019.03.024
[21] Lin, D., Hu, J.X., He, B.B., Wu, B.Z., Leng, C.J., Yi, Y.W. (2021). Application of data fusion of electronic nose and electronic tongue in flavor recognition of fish-flavor sauce. China Condiment, 46(9): 145-150. https://doi.org/10.3969/j.issn.1000-9973.2021.09.028
[22] Arrieta-Almario, A.A., Palencia-Luna, M.S., Arrieta-Torres, P.L. (2018). Determination of adulterant in milk through the use of a portable voltammetric electronic tongue. Rev. Mex. Ing. Química, 17, 877-884.
[23] Yu, C., Zhang, X.J., Mei, G.M., Fang, Y., He, P.F. (2022). Determination of sodium metabisulfite content in shrimp by multi-frequency large amplitude pulse voltammetry electronic tongue. Chinese Journal of Food Science, 22(2): 328-336.
[24] Kumar, S., Ghosh, A. (2020). Identification of fractional order model for a voltammetric E-tongue system. Measurement, 150: 107064. https://doi.org/10.1016/j.measurement.2019.107064
[25] Leon-Medina, J.X., Anaya, M., Tibaduiza, D.A. (2022). Yogurt classification using an electronic tongue system and machine learning techniques. Intelligent Systems with Applications, 16: 200143. https://doi.org/10.1016/j.iswa.2022.200143
[26] Yu, C., Zhang, X.J., Mei, G.M., Fang, Y., He, P.F. (2022). Determination of sodium metabisulfite in prawn based on multifrequency pulse electronic tongue. Journal of Chinese Institute of Food Science and Technology, 22(2): 328-336.
[27] Li, Y., Li, F.F., Yu, L.H., Sun, J.X., Guo, L.P., Dai, A.G., Wang, B.W., Huang, M., Xu, X.L. (2020). The electronic nose and tongue were used separately and in combination to detect chicken minced meat with soy protein or starch. Transactions of the Chinese Society of Agricultural Engineering, 36(23): 309-316. https://doi.org/10.11975/j.issn.1002-6819.2020.23.036
[28] Shi, Q.R., Guo, T.T., Yin, T.J., Wang, Z.Q., Li, C.H., Sun, X., Yuan, W. (2018). Classification of Pericarpium Citri Reticulatae of different ages by using a voltammetric electronic tongue system. International Journal of Electrochemical Science, 13: 11359-11374. https://doi.org/10.20964/2018.12.45
[29] do Nascimento, A.S., Silva, F.D.L., Machado, C.S., Cavalcante da Silva, S.M.P., Estevinho, L.M., Dias, L.G., Carvalho, C.A.L.D. (2022). Use of the electronic tongue as a tool for the characterization of Melipona scutellaris Latreille honey. Journal of Apicultural Research, 61(1): 79-90. https://doi.org/10.1080/00218839.2020.1842579
[30] Xian, X.D. (2022). Research on bridge damage detection based on particle swarm optimization support vector machine. Nan Ning: Guangxi University.
[31] Xu, G.Q., Cao, N., Li, L., Xie, G.K., Yao, Y. (2022). Debris flow disaster prediction model based on improved particle swarm optimization ν support vector machine. Foreign Electronic Measurement Technology, 41(9): 73-81. https://doi.org/10.19652/j.cnki.femt.2204003