Sabah A. Gitaffa | Abbas H. Issa* | Yaser N. Ibrahem
© 2022 IIETA. This article is published by IIETA and is licensed under the CC BY 4.0 license (http://creativecommons.org/licenses/by/4.0/).
OPEN ACCESS
Two significant motivations for continuing development in early process detection problems are technological plant safety and dependability. To avoid economic losses in oil exploration, faults in Field Digitizing Units (FDUs) instruments must be detected. The creation of algorithms that can detect process issues before they reach their threshold is a big task, and trend checks associated with a particular measured value are typical. The efficiency of the Deep Neural Network (DNN) technique employing Matlab and a low-computational power device, such as the Raspberry Pi 4, for drift fault detection in FDUs is evaluated in this article. The DNN classifier is among the deep learning algorithms being studied. The FDUs instruments provided the data for this experiment. In training and testing data, the six features (Distortion, Noise, Common-Mode Rejection (CMRR), Gain Error, Phase Error, and Crosstalk) were extracted from free fault and faulty FDUs. The trained model has been offline tested, with the model being used to detect drift faults using FDU performance. Accuracy, specification, precision, recall, and F-measure were used to determine the efficiency of the classifier, with 99.7% accuracy in the DNN with Matlab and 98% accuracy in the DNN with Python.
field digitizing unit instrument, fault detection and isolation, deep neural network, artificial intelligence, Raspberry Pi
Engineering systems get increasingly advanced as technology improves. The more sophisticated a system is, the more prone it is to failure and the greater the risk of it collapsing. Failures must be identified, isolated, and fixed as soon as possible in order to keep the system from becoming troublesome, necessitating the employment of proper Fault Detection and Isolation (FDI) approaches [1-3]. If an instrument malfunctions, immediate measures should be taken. Furthermore, as this instrument is used more frequently, it could cause various issues, such as instrument accuracy loss, bias, drift, and full failure. Therefore, data from instruments could not be calculated accurately, and the industrial system or equipment would have an optimum deviation that would compromise output safety and efficiency [4, 5]. For process monitoring, various univariate and multivariate faults have been developed in the literature [6].
DNNs are a machine learning technique based on the Artificial Neural Network concept (ANN). Deep learning architectures have benefited game creation, natural language processing, and medical image analysis, among other disciplines of computer vision, speech recognition, and medicine formulation. For example, hyperparameter adjustment, for example, was successfully used to improve the performance of regular DNN models [7]. These methods have much promise in reducing the burden on humans in predicting FDUs instrument faults and isolation based on dataset analysis. Hence, it becomes essential to detect the fault of the FDUs instrument to reduce the progression of the fault on it, and the data that will be processed the next time will be incorrect, causing the loss of information about the oil reserve. The data for this study comes from the FDU instrument. In furthermore, the foregoing are the contributions of the paper.
The implementation takes two forms: A software implementation that mimics the data using the Matlab software environment version (2020a) and a Raspberry Pi 4 implementation it's a solitary computer running Linux. Artificial Intelligence (AI) applications will be increasingly executed on small general-purpose CPUs [8]. These inexpensive systems are easy to establish, occupy a small area, and have the necessary computational power. The Raspberry is programmed with the Python programming language (version 3.8).
During the last two decades, FDI has gotten a lot of press in any system. As a result, research on FDI domains has been conducted, and some prior studies using Deep Neural Networks to perform computer vision and image processing classifications have been published in DNN. Gulshan et al. [9] proposed an algorithm that automatically detects diabetic retinopathy and diabetic macular edema in retinal fundus images was developed using deep learning. Using only a prospective improvement collection of 128,175 retinal images that were evaluated 3 – 7 times for retinopathy, a machine learning model was built. The algorithm's sensitivity and specificity aided in detecting diabetic retinopathy that may be referred to a specialist (RDR). Diabetic patients' retinal fundus images were analyzed for detecting referable diabetic retinopathy and a DNN algorithm with high sensitivity and specificity was used. Li et al. [10] advised that a new form of Principal Component Analysis (PCA) be utilized at a nuclear power plant (NPP) for sensor fault detection and isolation. To increase model accuracy in operation, data pre-processing and false alarm reduction techniques are integrated with a generic PCA methodology. In a variety of ways, data pre-processing eliminates solitary points and random oscillations from raw data. The effectiveness of the recommended data pre-processing and false alarm reduction strategies is evaluated using sensor readings. The suggested PCA model, according to simulation results, regardless of whether there are significant or minor failures, functions well on the FDI of sensors. As a method for demonstrating their ability to detect and classify problems, deep neural networks are presented as a First, the defect detection and classification tasks are envisioned as neural network-based classification problems [11]. The impact of two crucial elements, as well as data augmentation, on the output of a neural network is next investigated: the total number of neurons in the last hidden layer and the total number of hidden layers. Neural networks and data augmentation are also used to address the problem of defect categorization. The researchers concluded that increasing the size of the network would not improve the accuracy of defect identification. A.K. The usage of ANN for fault identification and diagnosis on a 3 - phase distribution line system was examined using 3 - phase currents and voltages as inputs to the NN and post-fault values normalized to pre-fault values [12]. The proposed NNs have attained suitable performance based on their simulation results. They also stressed the need to select the optimum ANN interface to receive the network's most significant outcomes. The simulation results suggest that ANNs, particularly Back Propagation Neural Networks (BPNNs), are dependable and effective for detecting and diagnosing electrical power distribution system faults. BPNNs perform effectively and have a high accuracy of around 100 percent. Many approaches for detecting, separating, and reconstructing sensor signals have been proposed [13]. When the existing criteria are met, the following differences in the records from sensors of the same type can reveal an exception. By contrasting sensor reading variations induced by an Initiating Event (IE) with those caused by sensor faults, an interquartile range-based approach is utilized to prevent inappropriate recovery behaviours. In addition, if sensor failures are discovered to be the source of the discrepancies. In that case, the problematic sensors can be separated without having to analyse all of the mounted ones by utilizing a sequential backward selection-based strategy. Finally, methods based on multivariate autoregressive models for reconstructing values from damaged sensors during normal NPP activity or during an IE are discussed.
This study will use DNN approach to establish FDU instrument fault detection and isolation categorization procedure. The gathering of FDU data in the form of a Real number is followed by feature extraction and classification using free-fault and fault features.
The following is how the paper is structured: In Section 2, there is a list of related works. Section 3 provides an overview of FDI. Section 4 explains the DNN in simple terms. The Performance Evaluation Metrics for Classifiers are shown in Section 5. The simulation results model is shown in Section 6 using Matlab and Python. Section 7 demonstrates the conclusion.
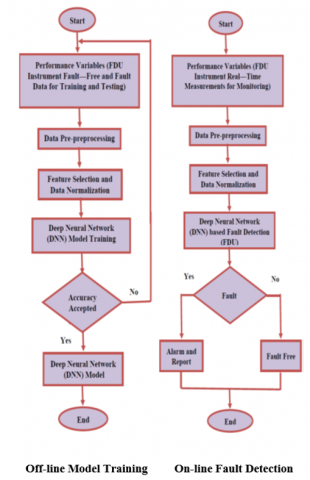
Exploration of the world's most valuable economic resource is the first step in learning more about it. Reading and filtering data that will be utilized to build an oil story using FDU technology is one of the initial steps in the oil prospecting process. This important revenue stream needs a greater emphasis on consistency and dependability. As a result, try to keep the FDU instrument away from the fault that might otherwise cause it to fail or cease; this can be accomplished by constant surveillance, aided by improved fault detection and classification capabilities. The fault detection and insulation capabilities of the FDU instrument would be efficient and reliable. The purpose of fault detection and isolation is to make certain flaws less severe. Figure 1 depicts the construction of the FDU instrument detection and isolation method based on the Deep Neural Network (DNN). Structure of DNN Deep Neural Networks has an input layer, an output layer and few hidden layers between them. There are two stages to the procedure: Model training offline and training online FDI [14].
Figure 1. Structure of fault detection and isolation approach based on deep neural networks
A DNN one-class description model was built during the offline model training method.
Firstly, in order to execute the best model training, the acquired data from a reading oil exploration from the FDUs instruments must be included. All faulted and fault-free FDUs must be included. Second, the evidence for defect and normal retraining is processed and randomly distributed throughout the dataset. The methods of data preprocessing in this article by filtering the data, choose the effect features and do scaling for reading. Finally, the variables are selected to accurately portray the fault and normal situations of the FDUs. The variables need to be picked with care. After that, the training data is standardized. Fourth, the DNN model is trained using preprocessed data from phase three. It uses a hypersphere in a high-dimensional environment with a tight border to simulate the fault and normal data distribution. The DNN model's FDI performance is then evaluated using data for both training and testing. If the accuracy is unsatisfactory, the process will be repeated until the DNN model is successful. It is a good idea to experiment with several combinations of factors and then pick the one that produces the greatest results. In the online FDI procedure, a trained DNN model will be deployed [14, 15].
The process variables of the FDUs instruments are monitored for online FDI. The data from the monitoring system is similar to the offline model training technique; the data has been preprocessed, the variables are picked, and the normalization process is carried out. The trained DNN model is then utilized to look for outliers in the monitoring data. Depending on the FDU instrument's upper limit, a defect is recognized and alerted to the management when one or more of these features exceed the specified limit. The FDU instrument would be normal if it were not for this. The FDU instruments are identify defects based on the role of DNN that used by DNN model.
As a result, one of the most significant topics in instrumentation has been fault detection and isolation, which will be explored in this paper. The six types of FDU instrument faults (Distortion, Noise, CMRR, Gain Error, Phase Error, and Crosstalk) are used to detect and isolate various faults in this study.
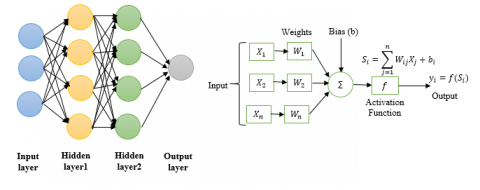
Between the entrance and output layers, the DNN has numerous layers [16]. Although neural networks come in a variety of forms and sizes, they all have the same basic components: connections, neurons, biases, weights, and functions [17]. These components work similarly to people and may be trained in the same way as every other machine learning approach.
A DNN with a background in dog breeds, For example, the image is evaluated to assess the likelihood that the dog in the image is of a particular race. Before providing the recommended label, the user can analyse the findings and select which probabilities the network should reveal (those larger than a certain threshold, for example). A layer is a mathematical procedure, and DNNs with various layers are known to as "deep" networks.
DNNs are capable of complex non-linear modelling relationships. DNN architectures produce composition models that show the item as a layered primitive composition. The extra layers allow for the collecting of information from lower layers, potentially allowing for the modeling of complicated data with fewer units than a deep network with equivalent performance. When dealing with sparse multivariate polynomials, DNNs, for instance, have been shown to be immensely better at approximation than external networks [18].
As demonstrated in Figure 2, deep architectures are made up of various variations of a few basic principles. In various domains, each design has proven to be successful. Comparing the performance of multiple architectures is generally impossible unless they have been tested on the same datasets.
Figure 2. Deep neural network architecture and process [19]
Without looping, data from the input to the output layer is sent back into the DNNs. The DNN will start by creating a map of virtual neurons and assigning the connections between them random integer values and "weights." To get a result between 0 and 1, multiply the inputs and weights. An algorithm will change the weights if the network fails to recognize a pattern correctly [20]. As a result, the algorithm may increase the weight of specific criteria until it discovers the best mathematical manipulation for thoroughly processing the data.
The metrics given below are used to assess the model that has been proposed. The term "accuracy" is one of the most commonly used and, in some situations, the sole option for assessing an algorithm's output in classification problems. As Eq. (1) shows, it is the fraction of correctly classified data items to the total number of observations [21].
Accuracy $=\frac{\mathrm{TP}+\mathrm{TN}}{\mathrm{TP}+\mathrm{TN}+\mathrm{FP}+\mathrm{FN}}\quad100 \%$ (1)
where, TN = True Negatives, TP = True Positives, FP = False Positives and FN = False Negatives.
Specificity: Measures the ability of a test to be harmful when the condition is not present, as shown in Eq. (2) [5].
Specificity $=\frac{\mathrm{TN}}{\mathrm{TN}+\mathrm{FP}}\quad100 \%$ (2)
Precision: It simply displays how many positive observations predicted by an algorithm are positive. According to Eq. (3), the precision is determined by dividing the total number of true positives by the total number of true positives and false positives [22, 23]:
Precision $=\frac{\mathrm{TP}}{\mathrm{TP}+\mathrm{FP}}\quad100 \%$ (3)
Recall: It specifies the number of related data items that have been selected. In reality, how many truly favourable observations could the algorithm has predicted. According to Eq. (4), the number of true positives divided by the sum of true positives and false negatives equals the recall [8].
Recall $=\frac{\mathrm{TP}}{\mathrm{TP}+\mathrm{FN}}\quad100 \%$ (4)
F-Measure: This statistic considers precision and recalls when determining an algorithm's efficiency. It is the harmonic mean of precision and recall, which can be written out as Eq. (5) [24, 25].
$\mathrm{F}-$ measure $=2 * \frac{\text { precision } * \text { recall }}{\text { precision }+\text { recall }}\quad100 \%$ (5)
5.1 Experimental dataset and feature extraction
The data sample utilized in the experiment was obtained via FDUs from the Oil Exploration Company, as shown in Table 1. Table 1 in this paper are included the oil exploration data read by the FDUs instrument. Six fault detection and isolation features for fault and normal FDUs were sequenced at random in these data; there were 1000 samples altogether, including 404 faulty samples and 596 normal ones. These variables are selected for their importance in determining the fault for FDUs, where in normal work any FDU unit that contains fault numbers for these variables are not valid for work. The 15 samples from this dataset, together with their metadata, are included in the table below.
Table 1. Samples of data from the FDUs' instruments
|
Serial No. |
Line Name |
Point No. |
Class* |
Distortion (dB) |
Noise (µV) |
CMRR (dB) |
Gain Error (%) |
Phase Error (us) |
Crosstalk (dB) |
|
12309011 |
18 |
1994 |
2 |
-112.35 |
0.35 |
93.00 |
0 |
1.73 |
100 |
|
6169107 |
19 |
1996 |
1 |
-118.61 |
0.36 |
127.71 |
0.04 |
-1.8 |
130 |
|
12291857 |
18 |
1996 |
2 |
-101.00 |
2.37 |
136.39 |
0 |
-0.49 |
140 |
|
6169425 |
19 |
1997 |
2 |
-116.39 |
1.45 |
90.00 |
1.5 |
21 |
135 |
|
12291037 |
18 |
1997 |
1 |
-113.04 |
0.35 |
138.14 |
0 |
-0.53 |
140 |
|
6169006 |
19 |
1998 |
1 |
-105.20 |
0.36 |
138.47 |
0.02 |
-1.86 |
140 |
|
12290070 |
18 |
1998 |
2 |
-113.67 |
0.35 |
135.21 |
2 |
0.7 |
140 |
|
6025638 |
18 |
1999 |
2 |
-118.88 |
1.33 |
99.00 |
0.01 |
-0.09 |
101 |
|
12267875 |
19 |
2000 |
1 |
-114.45 |
0.35 |
120.00 |
0.01 |
20 |
133 |
|
12349085 |
18 |
2000 |
2 |
-113.64 |
0.37 |
132.54 |
1.60 |
-1.03 |
130 |
|
6046958 |
18 |
2001 |
1 |
-103.03 |
0.34 |
138.07 |
-0.01 |
-8 |
132 |
|
12266623 |
19 |
2001 |
2 |
-103.05 |
1.55 |
131.97 |
0.01 |
-1.42 |
140 |
|
6288095 |
18 |
2002 |
2 |
-103.99 |
0.35 |
131.70 |
1.70 |
23 |
140 |
|
10892987 |
19 |
2002 |
1 |
-114.62 |
1.00 |
110.00 |
0.04 |
-10 |
140 |
|
10892985 |
19 |
2003 |
2 |
-112.73 |
1.80 |
148.32 |
0.04 |
-2.28 |
105 |
*where, Class 1 is representing free fault FDUs and class 2 is representing fault FDUs.
The FDU fault detection and isolation model was created using the Deep Neural Network (DNN) classification method. There were two sections to the dataset: Training data and test data. The accuracy, specification, Precision, Recall, and F-Measure for each classification method were used to assess the FDUs output. Each of the six characteristics (Distortion, Noise, CMRR, Gain Error, Phase Error, and Crosstalk) was measured for accuracy, specification, Precision, Recall, and F-Measure to identify the FDUs as fault-free or fault-free. Each classification technique was utilized, and the accuracy was measured, specification, Precision, Recall, and F-Measure to classify the FDUs as fault-free or fault; each classification method was employed. When there is fault in the features of a used FDU, the trainee model will show the details of this FDU, which will have isolated by line number and point number for this FDU.
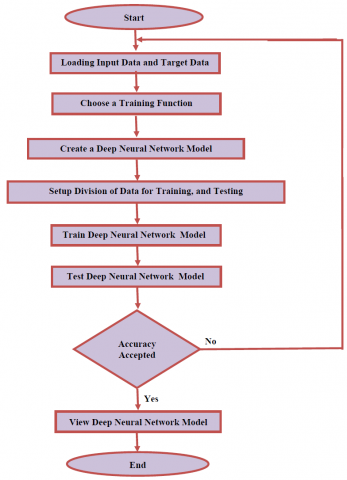
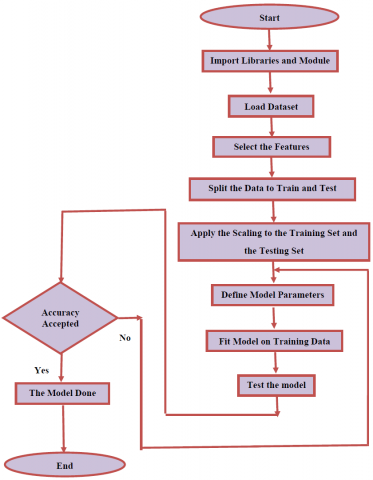
Figure 3. Model steps in Matlab
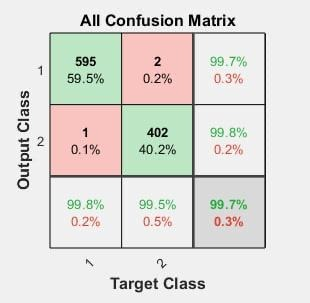
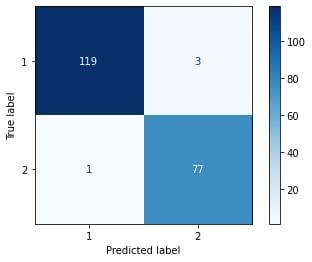
Figure 4. Confusion matrix for DNN classifier in Matlab
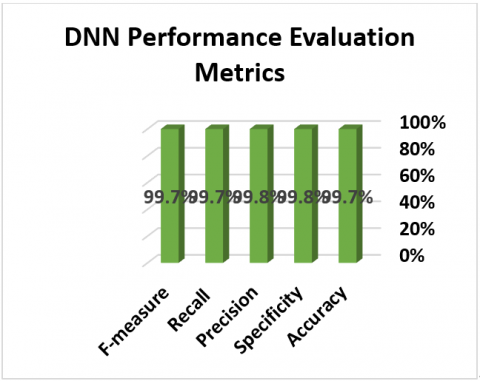
Figure 5. Evaluation metrics for DNN classifier in Matlab
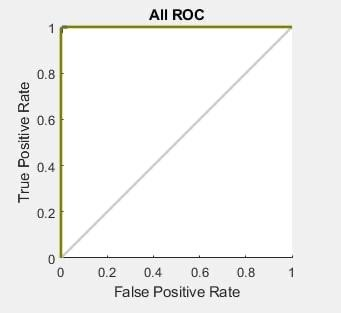
Figure 6. ROC curve for DNN classifier in Matlab
5.2 Deep neural network Matlab results
This section will explain the findings of DNN techniques for identifying and classifying errors, and Figure 3 illustrates the model processes. This part was built with the Matlab Programming Language with three hidden layers, each with nine neurons. The Confusion Matrix, as shown in Figure 4, will calculate the Performance Evaluation Metrics (accuracy, specification, Precision, Recall, and F-Measure) for this classifier and the Region of Convergence Curve (ROC Curve) for this classifier, as shown in Figures 5 and 6 respectively.
5.3 Deep neural network python results
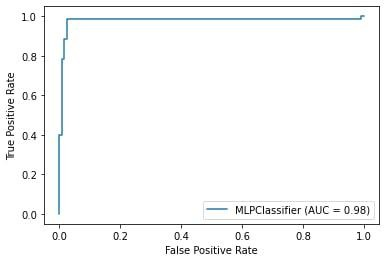
The scikit-learn machine learning library from the Python programming language was used to train classifiers on the Raspberry Pi 4 [26]. The MLP Classifier function was used to train the DNN and also with 3 hidden layers, and each layer has 9 neurons. The python procedures employed in this study are represented in Figure 7. From the confusion matrix as shown in Figure 8, we will calculate the performance evaluation metrics (accuracy, specification, Precision, Recall, and F-Measure) for this classifier as shown in Figure 9 shows the ROC curve for this classifier, and Figure 10 shows the ROC curve for this classifier. If the accuracy is unsatisfactory, the process will be repeated until the DNN model is successful. The methods that have been taken to improve the accuracy in the iterative process are, firstly, we change the biases, weights, and functions in the network, and also we change the number of hidden layers and cell neurons. Finally, increase and reorganize the data used in training the model. Based on the obtained results, it turns out that the proposed DNN model has good advantages:
1- Methods based on DNN are flexible to use which could significantly save time and effort.
2- The DNN is very efficient in fault detection and isolation, since it has high accuracy, high predicted speed and lowest training time.
3- The ability to handle a large number of data.
Figure 7. Model steps in Python
Figure 8. Confusion matrix for DNN classifier in Python
Figure 9. Evaluation metrics for DNN classifier in Python
Figure 10. ROC curve for DNN classifier in Python
The drift faults in the FDU instrument fault detection problem are explained in this paper. Using a DNN classifier, to determine if fault or free fault FDUs are present, the technique uses six attributes as a parameter. The performance of classifiers has been measured by the following: Accuracy, Specification, Precision, Recall, and F-Measure. Experiment results show that DNN is a successful classifier based on the outcomes, and that Matlab and Python are very similar, as shown in the section of results. Eventually, a single-board gadget that is more powerful could be utilized to do a difficult task instead of a Raspberry Pi 4, and new instruments could be utilized for many additional instrument faults kinds instead of FDUs. Diagnose and prediction of faults can also be done using a data-driven approach.
|
ANN |
Artificial Neural Network |
|
AI |
Artificial Intelligence |
|
BPNN |
Back Propagation Neural Network |
|
CMRR |
Common-Mode Rejection |
|
DNN |
Deep Neural Network |
|
FDI |
Fault Detection and Isolation |
|
FDUs |
Field Digitizing Units |
|
FN |
False Negatives |
|
FP |
False Positives |
|
IE |
Initiating Event |
|
NPP |
Nuclear Power Plant |
|
PCA |
Principal Component Analysis |
|
ROC |
Region of Convergence |
|
TN |
True Negatives |
|
TP |
True Positives |
[1] Xu, F., Puig, V., Ocampo-Martinez, C., Olaru, S., Stoican, F. (2015). Set-theoretic methods in robust detection and isolation of sensor faults. International Journal of Systems Science, 46(13): 2317-2334. https://doi.org/10.1080/00207721.2014.989293
[2] Nasser, A.R., Azar, A.T., Humaidi, A.J., Al-Mhdawi, A. K., Ibraheem, I.K. (2021). Intelligent fault detection and identification approach for analog electronic circuits based on fuzzy logic classifier. Electronics, 10(23): 2888. https://doi.org/10.3390/electronics10232888
[3] El Kafrawy, P., Fathi, H., Qaraad, M., Kelany, A.K., Chen, X. (2021). An efficient SVM-based feature selection model for cancer classification using high-dimensional microarray data. IEEE Access, 9: 155353-155369. https://doi.org/10.1109/ACCESS.2021.3123090
[4] Chatterjee, S. (2022). Fault detection for a nonlinear switched continuous time delayed system using machine learning and self-switched UKF. Journal Européen des Systèmes Automatisés, 55(2): 245-251. https://doi.org/10.18280/jesa.550212.
[5] Abed, A.M., Gitaffa, S.A., Issa, A.H. (2021). Quadratic support vector machine and K-nearest neighbor based robust sensor fault detection and isolation. Engineering and Technology Journal, 39(5): 859-869. http://dx.doi.org/10.30684/etj.v39i5A.2002
[6] Harkat, M.F., Mansouri, M., Abodayeh, K., Nounou, M., Nounou, H. (2020). New sensor fault detection and isolation strategy–based interval‐valued data. Journal of Chemometrics, 34(5): e3222. https://doi.org/10.1002/cem.3222
[7] Yadav, R., Kumar, Y. (2021). Detection of non-technical losses in electric distribution network by applying machine learning and feature engineering. Journal Européen des Systèmes Automatisés, 54(3): 487-493. https://doi.org/10.18280/jesa.540312.
[8] Abed, A.M., Gitaffa, S.A., Issa, A.H. (2021). Robust geophone string sensors fault detection and isolation using pattern recognition techniques based on Raspberry Pi4. Materials Today: Proceedings, https://doi.org/10.1016/j.matpr.2021.04.360
[9] Gulshan, V., Peng, L., Coram, M., Stumpe, M.C., Wu, D., Narayanaswamy, A., Venugopalan, S., Widner, K., Madams, T., Cuadros, J., Kim, R., Raman, R., Nelson, P.C., Mega, J.L., Webster, D.R. (2016). Development and validation of a deep learning algorithm for detection of diabetic retinopathy in retinal fundus photographs. Jama, 316(22): 2402-2410. https://doi.org/10.1001/jama.2016.17216
[10] Li, W., Peng, M.J., Wang, Q.Z. (2018). Fault detectability analysis in PCA method during condition monitoring of sensors in a nuclear power plant. Annals of Nuclear Energy, 119: 342-351. https://doi.org/10.1016/j.anucene.2018.05.024
[11] Heo, S., Lee, J.H. (2018). Fault detection and classification using artificial neural networks. IFAC-Papers OnLine, 51(18): 470-475. https://doi.org/10.1016/j.ifacol.2018.09.380
[12] Onaolapo, A.K., Akindeji, K.T. (2019). Application of artificial neural network for fault recognition and classification in distribution network. In 2019 Southern African Universities Power Engineering Conference/Robotics and Mechatronics/Pattern Recognition Association of South Africa (SAUPEC/RobMech/PRASA), pp. 299-304. https://doi.org/10.1109/RoboMech.2019.8704808
[13] Lin, T.H., Wu, S.C. (2019). Sensor fault detection, isolation and reconstruction in nuclear power plants. Annals of Nuclear Energy, 126: 398-409. https://doi.org/10.1016/j.anucene.2018.11.044
[14] Zhao, Y., Wang, S.W., Xiao, F. (2013). Pattern recognition-based chillers fault detection method using support vector data description (SVDD). Applied Energy, 112: 1041-1048. https://doi.org/10.1016/j.apenergy.2012.12.043
[15] Zhao, Y., Xiao, F., Wen, J., Lu, Y.H., Wang, S.W. (2014). A robust pattern recognition-based fault detection and diagnosis (FDD) method for chillers. HVAC&R Research, 20(7): 798-809. https://doi.org/10.1080/10789669.2014.938006
[16] Schmidhuber, J. (2015). Deep learning in neural networks: An overview. Neural Networks, 61: 85-117. https://doi.org/10.1016/j.neunet.2014.09.003
[17] Deng, L., Yu, D. (2014). Deep learning: methods and applications. Foundations and Trends in Signal Processing, 7(3-4): 197-387. https://doi.org/10.1561/2000000039
[18] LeCun, Y., Bengio,Y., Hinton, G. (2015). Deep Learning. Nature, 521: 436-444. https://doi.org/10.1038/nature14539
[19] Sugiyama, S. (2019). Human Behavior and Another Kind in Consciousness: Emerging Research and Opportunities IGI Global.
[20] Jmal, A., Barioul, R., Meddeb Makhlouf, A., Fakhfakh, A., Kanoun, O. (2020). An embedded ANN Raspberry PI for inertial sensor based human activity recognition. In International Conference on Smart Homes and Health Telematics, 12157: 375-385. Springer, Cham. https://doi.org/10.1007/978-3-030-51517-1_34
[21] Powers, D.M.W. (2020). Evaluation: from precision, recall and F-measure to ROC, informedness, markedness and correlation. International Journal of Machine Learning Technology, pp. 37-63. https://doi.org/10.48550/arXiv.2010.16061
[22] Vakili, M., Ghamsari, M., Rezaei, M. (2020). Performance analysis and comparison of machine and deep learning algorithms for IoT data classification. https://doi.org/10.48550/arXiv.2001.09636
[23] Hadi, M.H., Issa, A.H., Sabri, A.A. (2021). Improvement of salp swarm algorithm (SSA2) for intelligent fault detection in smart wireless sensor networks. Materials Today: Proceedings. https://doi.org/10.1016/j.matpr.2021.07.248
[24] Jabbar, A.F., Mohammed, I.J. (2020). Development of an Optimized Botnet Detection Framework based on Filters of Features and Machine Learning Classifiers using CICIDS2017 Dataset. In IOP Conference Series: Materials Science and Engineering, 928(3): 032027. https://doi.org/10.1088/1757-899X/928/3/032027
[25] Kherraki, A., Ouazzani, R.E. (2022). Deep convolutional neural networks architecture for an efficient emergency vehicle classification in real-time traffic monitoring. IAES International Journal of Artificial Intelligence, 11(1): 110. http://doi.org/10.11591/ijai.v11.i1.pp110-120
[26] Hao, J., Ho, T.K. (2019). Machine learning made easy: A review of scikit-learn package in python programming language. Journal of Educational and Behavioral Statistics, 44(3): 348-361. https://doi.org/10.3102%2F1076998619832248