Srinivasa Rao Bommisetty* | Kanna Babu Chettu | Shivananda Nayaka Hanumanthappa
© 2022 IIETA. This article is published by IIETA and is licensed under the CC BY 4.0 license (http://creativecommons.org/licenses/by/4.0/).
OPEN ACCESS
The objective of this research work is to investigate the influence of cutting parameters on the average surface roughness (Ra) in an end milling process. Feed rate (f), Spindle speed (s) and Depth of cut (d) are the cutting parameters considered as significant factors. A case study on the progressive feed (PF) and conventional constant feed (CF) machining characteristics of Aluminum alloy BS L168-T6511 using end milling is considered. Taguchi's design of experiments (DoE) technique is applied for various combinations of cutting factors and average surface roughness was measured using Mitutoyo surftest SJ-301 surface roughness tester. The experimental results of Ra are analyzed by response surface methodology (RSM). The predicted values using the developed regression mathematical model are compared against experimental results and were found in close agreement. ANOVA technique was applied to further analyze the data for checking the model adequacy and to predict the influence of each parameter on output response Ra. Main effect plots, Interaction plots, 3D surface plots, and Contour plots are established. The investigation reveals that output response (Ra) is predominantly affected by feed rate and progressive feed machining (PFM) yields better surface finish than the conventional constant feed machining (CFM) for the end milling.
ANOVA, end milling, progressive feed, RSM, surface roughness, Taguchi
The challenge of contemporary machining industries is mainly interested in the achievement of high-quality products in terms of surface finish, dimensional exactness in a stipulated time. End milling is one of the most commonly used metal cutting process occupying cores of manufacturing industries like aerospace, defense, automotive, marine, and other fields. The mechanism behind the formation of surface finish in CNC end milling process is very dynamic, complicated and process dependent. The quality of surface of a machined component plays an important role in its performance. A good quality milled surface significantly improves fatigue life, corrosion resistance, and creep life. Surface finish is of great important, particularly in case of fighter aircraft structural components, as they will be subjected to high level of fatigue loads. Some of fighter aircraft detail parts are very intricate in shape and needs extensive end milling process to realize the final component.
The ability to control the machining process by setting proper input factors, for a better surface finish and in turn a good quality product is of vital importance. Many researchers have concentrated on various optimization and predictive modeling techniques to determine the optimal input parameters, and to achieve the better surface finish. Hashimoto et al. [1] described the characteristics of surfaces created by various finishing methods, and discussed the influence of surface finish on its performance. According to Ghosh et al. [2] better surface finish can be obtained by a combination of high speed, low feed, and low depth of cut. They concluded that RSM-PSO is an efficient optimization technique for keyway milling. The advantage of dry machining over the wet machining has been clearly established by selecting proper cutting tools and tool geometry [3, 4]. The optimization, carried out in their work gives an opportunity for the user to select the best tool geometry and cutting conditions so as to get the required surface quality. Varghese et al. [5] presented a detailed investigation of effects of cutting parameters and different cooling environments on the machinability of austenitic stainless steel AISI 304. ANOVA and Regression analysis, through a DoE full factorial design (43), were conducted to relate the surface roughness of face milled high strength steel to the most common machining parameters [6]. The optimization resulted in spindle speed of 1250rpm, depth of cut of 1.0 mm, and table feed rate of 67mm/min with a composite desirability of 0.83, to give Ra and MRR values of 0.15 and 2333mm3/min respectively. The objective of the study is to determine the optimum combination of parameters for minimum surface roughness during MQL assisted milling process on AISI-1045 alloy [7]. Surface roughness model is developed by both ANN and RSM. It is found that RSM coupled with PSO gives better result and it is validated by confirmation tests. It is perceived that the feed has significant effect on surface roughness followed by spindle speed and Depth of cut has small effect on roughness. Kumar and Rajamohan [8] developed a mathematical model using RSM, with the data obtained by end milling of Al 6063-T6. The surface roughness and flatness values predicted from the proposed model were found in good agreement with the experimental results. Investigations shows output response increases rapidly with an increase of feed rate and decreases with an increase in cutting speed. A fuzzy model was developed for predicting the surface roughness for a set of input parameters: cutting speed, feed rate and depth of cut [9]. Therefore, the operator can predict the quality of the response in advance with that. Vakondios et al. [10] examined the influence of the milling strategy selection on the surface roughness of an aluminum alloy Al7075-T6. They performed 96 experiments and the results are processed using regression analysis and ANOVA. The models were statistically validated and experimentally verified are in good fit. Surface topography of super alloy GH4169 work piece machined by milling and grinding was studied and their result shows that Ra and Rz values from milling are 2-5 times and 1-3 times as high as those of grinding [11]. Ramanujam et al. [12] conducted CNC end milling experiments on Inconel 718 super alloy based on L9 orthogonal array and optimized the cutting parameters by Taguchi and desirability function. They developed a regression model for Ra and MRR. ANOVA shows that the cutting velocity is the most significant machining parameter. Pang et al. [13] carried out an experimental investigation on end milling of halloysite nanotubes (HNTs) based on Taguchi’s L27 orthogonal array. Results from their study shows that the application of the Taguchi method can determine the best combination of machining parameters that can provide the optimal machining responses: surface roughness and cutting force. CNC milling of brass was conducted by Ranganath et al. [14] have used RSM to accomplish the objective of the experimental study. The result shows that, tool diameter is the most significant factor followed by feed rate. Yahya et al. [15] optimized machining parameters based on surface roughness prediction for AA6061 using RSM. Cutter flutes have a more significant influence on surface roughness followed by feed rate and depth of cut. Julie et al. [16] were carried out ANOVA analysis to identify the significant factors affecting surface roughness and also found that optimal cutting combination by seeking the best surface roughness by SN ratio. Rashmi et al. [17, 18] were optimized the machining parameters for AA6061 using RSM& PSO, and calculated the cutting force by an indirect method. ANOVA results reveals that the effect of spindle speed is much more evident than the effect of feed rate and depth of cut on surface roughness.
A lot of research has been observed through literature on conventional constant feed machining of end milling process and minimizing the surface roughness using different statistical techniques. But only few articles [19, 20] are available on progressive feed machining, wherein the feed is applied progressively rather than instantly to minimize cutting force and tool wear. However, to the best of author’s knowledge there is no literature observed on minimizing surface roughness through progressive feed method of machining in end milling process. Especially machined components assembled in fighter aircraft structures like: longerons, spars, central frames, side frames, shear walls, trouser ducts, integral fuel walls and various supporting ribs of the fuselage etc., will be subjected to high level of fatigue loads during maneuvering. In the case of these parts surface finish plays a crucial role in their fatigue life and in-turn durability of the aircraft. Hence it is very important to fabricate a component with good surface finish to enhance the life of each detail part of aircraft. The primary objective of the present study is to adopt progressive feed method of machining in end milling of BS L168-T6511alloy, in order to achieve better surface finish on the machined components. A comparative analysis has been made between constant feed machining and progressive feed machining besides finding the influence of cutting parameters on output response (Ra). The chosen material for this research work is a widely used for high technology applications like aerospace, defense, marine and automotive etc. due to its high level of technical merits.
Usually in CNC part programming a constant feed rate will be chosen for a given set of cut-segment. As the part program is executed by the controller one block at a time or block by block, there exists a time delay between executions of two successive blocks. This leads to a stop and go fashion of tool movement while machining. Due to this nature of tool movement, at the start of every cut-segment and where there exists a change in cut direction, the tool starts from stationary position i.e. at a feed rate of ZERO mm/min and accelerates to the intended feed rate (f) mm/min instantly. This will lead to sudden impact of tool with the work piece and hence an increase in the cutting force, spindle deflection, machine tool vibration, tool wear, surface roughness, chattering and finally leads to poor product quality. Instead of that, if the feed rate increases progressively to the intended feed at the start of each cut and where there is a change in the direction of the cut, these ill effects will be minimized to the safe level and/or eliminated completely. In PF method of machining, feed rate increases step by step until cutting tool travels through a distance equal to its diameter, after that it travels with an intended feed rate (f)mm/min. The concept of progressive feed with four steps was illustrated in Figure 1.
Figure 1. Concept of progressive feed with four steps
2.1 Calculation of ‘Step distance’ for progressive feed rate
$l=\frac{D}{n}$ for end milling (1)
where, l=Step distance, D=Cutter diameter, n=Number of steps chosen, through which the feed rate is to be increased to intended feed rate (f).
Carbide end milling cutter of 20mm diameter with two flutes has been chosen for this study. Once the tool starts moving from its stationary position and after reaching a distance equal to its diameter (i.e. 20mm), it will be fully engaged with the work piece and there exists a firm support between tool and work piece. Hence, tool will be allowed to move with an intended feed rate (f)mm/min and this 20mm would be considered as progressive feed rate zone. That means feed rate will increase step by step through this distance of 20mm in a pre-determined number of steps (e.g.: four or five or even more/less), thereafter it will travel with an intended feed rate (f) mm/min.
2.2 Calculation of increase in feed rate per step
$f_s=\frac{f-f_0}{n} \mathrm{~mm} / \mathrm{min}$ (2)
where, fs=Increase in feed rate per step, n=Number of steps chosen through which the feed rate is to be increased to intended feed rate (f), f=Intended feed, f0=Starting feed rate (feed rate for step-1), x=starting % of (f), (i.e. x=30, 25, and 20 percentage of (f) at levels 200, 400 and 600 respectively has been considered as a case study.
For example, when the intended feed rate is 200mm/min as in level-1 of Table 2, 30% of 200 is 60mm/min, which will be taken as starting feed rate (f0). The balance 140(200-60)mm/min is divided into four steps, with an equal step increase of 35mm/min(140/4), which gives the values of 95,130,165 and then tool reaches the indented feed rate (f) of 200mm/min. Similarly step values are calculated for level-2 and level-3. Here, the author has chosen a four step increase as a case study, but it is possible to take other combinations of steps like three/five or even more/less for future study.
Cutting parameters and their levels are finalized based on the trial runs and literature review. The various machining parameters and their levels are shown in Table 1 and Table 2.
3.1 Workpiece details
BS L168-T6511 aluminum alloy work piece samples of size 100mm×80mm×20mm are considered for the experimental study. Test samples are prepared from a single billet to have identical properties throughout the specimen. The chemical composition of the work piece material is shown in Table 3, confirmed by spectroscopy.
3.2 Cutting tool and machine tool details
Precision measuring instruments Co. made X-PM16807-2000 solid carbide end mill cutter of 20mm diameter, with two flutes, has been used for this purpose (Figure 2a). The machine tool shown in Figure 2b, used for conducting experiments is the AMS MCV-450 model, three axes CNC vertical machining center. The major specifications of the machine are: Axis travel: X-800mm, Y-450mm, Z-500mm. Maximum spindle speed-60000rpm; Maximum feed rate-10m/min; Basic power supply–18kVA, Positional accuracy-0.015mm, Repeatability ± 0.005mm.
(a) Solid carbide end mill cutter with two flutes
(b) AMS MCV–450 Vertical milling machine
(c) Dry cutting condition
Figure 2. Machine tool and cutting tool used for research
Table 1. Machining parameters for CF and PF machining
|
Cutting Parameters |
Unit |
Level-1 |
Level-2 |
Level-3 |
|
Spindle speed (s) |
RPM |
2000 |
3000 |
4000 |
|
Depth of cut (d) |
mm |
0.75 |
1.5 |
2.25 |
|
Feed rate (f) |
mm/min |
200 |
400 |
600 |
|
Starting % of ‘f’’ in PF machining (x) |
mm/min |
30% (60) |
25% (100) |
20% (120) |
Table 2. Feed rate steps for progressive feed machining
|
Levels |
Feed rate (mm/min) |
|||||
|
Starting % of feed (x) |
Step 1 |
Step 2 |
Step 3 |
Step 4 |
Beyond Steps |
|
|
Level-1 |
30% of 200 |
60 |
95 |
130 |
165 |
200 |
|
Level-2 |
25% of 400 |
100 |
175 |
250 |
325 |
400 |
|
Level-3 |
20% of 600 |
120 |
240 |
360 |
480 |
600 |
Table 3. Chemical composition of BS L168-T6511 Aluminum alloy
|
Major Elements |
BS L168-T6511 Al alloy content weight percentage |
|||||||||||
|
Cu |
Mn |
Si |
Mg |
Fe |
Zn |
Ti+Zr |
Ti |
Cr |
Ni |
Al |
Others |
|
|
Min |
3.9 |
0.4 |
0.5 |
0.2 |
0 |
0 |
0 |
0 |
0 |
0 |
Balance |
0 |
|
Max |
5 |
1.2 |
0.9 |
0.8 |
0.5 |
0.25 |
0.2 |
0.15 |
0.1 |
0.1 |
0.15 |
|
(Courtesy:https://www.wilsonsmetals.com/datasheets)
Table 4. Experimental results from constant and progressive feed machining
|
Speed rpm |
DOC mm |
Feed, mm/ min |
x |
Ra in µm CF |
Ra in µm PF |
Y |
S/N for Ra_CFM |
S/N for Ra_PFM |
|
2000 |
0.75 |
200 |
30 |
0.64 |
0.5 |
21.875 |
3.8764 |
6.0206 |
|
2000 |
1.5 |
200 |
30 |
0.57 |
0.46 |
19.298 |
4.8825 |
6.7448 |
|
2000 |
2.25 |
200 |
30 |
0.51 |
0.42 |
17.647 |
5.8486 |
7.5350 |
|
2000 |
0.75 |
400 |
25 |
0.83 |
0.68 |
18.072 |
1.6184 |
3.3498 |
|
2000 |
1.5 |
400 |
25 |
0.76 |
0.62 |
18.421 |
2.3837 |
4.1522 |
|
2000 |
2.25 |
400 |
25 |
0.71 |
0.57 |
19.718 |
2.9748 |
4.8825 |
|
2000 |
0.75 |
600 |
20 |
1.01 |
0.9 |
10.891 |
-0.0864 |
0.9151 |
|
2000 |
1.5 |
600 |
20 |
0.95 |
0.78 |
17.895 |
0.4455 |
2.1581 |
|
2000 |
2.25 |
600 |
20 |
0.9 |
0.71 |
21.111 |
0.9151 |
2.9748 |
|
3000 |
0.75 |
200 |
30 |
0.51 |
0.4 |
21.569 |
5.8486 |
7.9588 |
|
3000 |
1.5 |
200 |
30 |
0.52 |
0.42 |
19.231 |
5.6799 |
7.5350 |
|
3000 |
2.25 |
200 |
30 |
0.43 |
0.36 |
16.279 |
7.3306 |
8.8739 |
|
3000 |
0.75 |
400 |
25 |
0.75 |
0.59 |
21.333 |
2.4987 |
4.5830 |
|
3000 |
1.5 |
400 |
25 |
0.67 |
0.52 |
22.388 |
3.4785 |
5.6799 |
|
3000 |
2.25 |
400 |
25 |
0.6 |
0.47 |
21.667 |
4.4369 |
6.5580 |
|
3000 |
0.75 |
600 |
20 |
0.92 |
0.78 |
15.217 |
0.7242 |
2.1581 |
|
3000 |
1.5 |
600 |
20 |
0.86 |
0.72 |
16.279 |
1.3100 |
2.8534 |
|
3000 |
2.25 |
600 |
20 |
0.82 |
0.64 |
21.951 |
1.7237 |
3.8764 |
|
4000 |
0.75 |
200 |
30 |
0.41 |
0.33 |
19.512 |
7.7443 |
9.6297 |
|
4000 |
1.5 |
200 |
30 |
0.42 |
0.34 |
19.048 |
7.5350 |
9.3704 |
|
4000 |
2.25 |
200 |
30 |
0.34 |
0.28 |
17.647 |
9.3704 |
11.057 |
|
4000 |
0.75 |
400 |
25 |
0.67 |
0.53 |
20.896 |
3.4785 |
5.5145 |
|
4000 |
1.5 |
400 |
25 |
0.58 |
0.47 |
18.966 |
4.7314 |
6.5580 |
|
4000 |
2.25 |
400 |
25 |
0.54 |
0.42 |
22.222 |
5.3521 |
7.5350 |
|
4000 |
0.75 |
600 |
20 |
0.83 |
0.68 |
18.072 |
1.6184 |
3.3498 |
|
4000 |
1.5 |
600 |
20 |
0.76 |
0.61 |
19.737 |
2.3837 |
4.2934 |
|
4000 |
2.25 |
600 |
20 |
0.74 |
0.58 |
21.622 |
2.6153 |
4.7314 |
|
Overall average percentage of improvement in surface finish PFM over CFM is: 19.206 |
||||||||
3.3 Experiment details
Experiments were conducted as per Taguchi’s L27 orthogonal array [21, 22] and detailed as in Table 4. Spindle speed (s), feed rate (f) and axial depth of cut (d) are the input process parameters and surface roughness (Ra) is the output response. Conventional climb milling with dry machining (Refer Figure 2c) condition was chosen to study the clear cut analysis of the constant feed and progressive feed machining. The measured surface roughness (Ra) values against each experimental run are depicted in Table 4. Column ‘x’ shows the starting percentage of feed rate (f) and column ‘Y’ displays the percentage of improvement in surface finish against each experimental run. S/N ratio of Ra from constant feed and progressive feed machining are presented in last two columns of the Table 4 respectively.
The influence of cutting parameters such as spindle speed, feed rate and depth of cut on the surface roughness of machined work sample with progressive feed and constant feed types machining environments is analyzed with the help of two statistical approaches: (1) ANOVA and (2) Relationships among the factors by multiple linear regressions. Mean values of surface roughness (Ra) are measured using Mitutoyo surftest SJ-301 (Refer Figure 3) surface roughness tester by taking an average of three readings, taken at three different locations on machined surface of work piece against each experimental run.
Figure 3. Mitutoyo surftest SJ-301 surface roughness tester
4.1 Analysis of variance (ANOVA) outcomes
ANOVA is a statistical technique to investigate the design parameters and it is used for establishing the significant factor which influences the design model [23]. It is useful for inferring the input data and test results in an organized way from the design of experiments [24, 25]. The experimental values of Ra from Table 4 from constant feed and progressive feed machining have been further analyzed using Minitab 18 statistical analysis software to find the effect of individual input factors on the response (Ra).
Table 5 and Table 6 shows the ANOVA result for surface roughness (Ra) of machined work piece surface in constant and progressive feed machining respectively. The last column of the Table 5 and Table 6 displays percentage contribution of each parameter on the total variation indicating the degree of influence on the response (Ra). The percentage of influence of input parameters on the response (Ra) in constant feed machining is as follows: feed rate: 76.60, spindle speed: 16.36 and depth of cut: 6.22 (Refer Table 5). The interaction terms {(s*f: 0.04%), (s*d: 0.09%) and (f*d: 0.45%)} do not have much statistical significance on surface roughness since P–values for these terms are more than the confidence level of 0.005. The percentage of influence of input parameters on output response in progressive feed machining is as follows: feed rate: 74.19, spindle speed: 16.89 and depth of cut: 7.41 (Refer Table 6). The interaction terms {(s*f: 0.23%) and (s*d: 0.13%)} do not have much statistical significance on surface roughness. The interaction term (f*d: 0.94% and P: 0.005) shows statistical significance on average surface roughness since its P-value is less than or equal to the confidence level of 0.005. ANOVA reveals that feed rate is the most influencing parameter among the spindle speed, feed rate and depth of cut considered in constant and progressive feed machining. It is well accepted that for a given values of tool diameter, nose radius, rake angle, number of cutting edges and flutes of a cutting tool, the quality of the surface finish is primarily a function of the feed rate. The total variations are explained by the model is R2=99.75% in constant feed machining whereas R2=99.79% in progressive feed machining. R2 (Adj) is 99.31% with the significant factors {s, f, d, (f*d)} in progressive feed machining whereas 99.20% in constant feed machining with the significant factors {s, f, and d}. R2 (Pred) is 97.19%, expected to explain the new data in constant feed and it is 97.57% in progressive feed machining (Table 5 and Table 6). Pie charts (Figure 4a & Figure 4b) were drawn to show the percentage contribution of cutting parameters on the output response (Ra) in both constant feed and progressive feed machining respectively. It is evident that, in both the machining environments feed rate having predominant effect on Ra followed by spindle speed and depth of cut is having least influence and interaction terms (s* f, s*d, and f*d) have negligible influence.
(a) Constant feed machining
(b) Progressive feed machining
Figure 4. Percentage of contribution of machining parameters on Ra
Table 5. ANOVA results for Ra from CF machining
|
Source |
DF |
Seq SS |
Adj MS |
F-Value |
P-Value |
% of Cont. |
|
s |
2 |
0.140452 |
0.070226 |
265.19 |
0 |
16.36 |
|
f |
2 |
0.657541 |
0.32877 |
1241.5 |
0 |
76.60 |
|
d |
2 |
0.053363 |
0.026681 |
100.76 |
0 |
6.22 |
|
s*f |
4 |
0.000326 |
0.000081 |
0.31 |
0.865 |
0.04 |
|
s*d |
4 |
0.00077 |
0.000193 |
0.73 |
0.598 |
0.09 |
|
f*d |
4 |
0.003881 |
0.00097 |
3.66 |
0.056 |
0.45 |
|
RE |
8 |
0.002119 |
0.000265 |
|
|
0.25 |
|
Total |
26 |
0.858452 |
|
|
|
100 |
|
Model summary: R2=99.75%, R2 (adj)=99.20%, R2 (pred)=97.19% |
||||||
Table 6. ANOVA results for Ra from PF machining
|
Source |
DF |
Seq SS |
Adj MS |
F-Value |
P-Value |
% of Cont. |
|
s |
2 |
0.102785 |
0.051393 |
317.17 |
0 |
16.89 |
|
f |
2 |
0.451563 |
0.225781 |
1393.4 |
0 |
74.19 |
|
d |
2 |
0.045119 |
0.022559 |
139.22 |
0 |
7.41 |
|
s*f |
4 |
0.00137 |
0.000343 |
2.11 |
0.171 |
0.23 |
|
s*d |
4 |
0.000815 |
0.000204 |
1.26 |
0.362 |
0.13 |
|
f*d |
4 |
0.005704 |
0.001426 |
8.8 |
0.005 |
0.94 |
|
RE |
8 |
0.001296 |
0.000162 |
|
|
0.21 |
|
Total |
26 |
0.608652 |
|
|
|
100 |
|
Model summary: R2=99.79%, R2 (adj)=99.31%, R2 (pred)=97.57% |
||||||
4.2 Correlations and confirmations
In order to recognize the effect of spindle speed, feed rate, and depth of cut on the surface roughness and to verify the exactness of the developed regressive model, correlation and conformation tests were accomplished.
4.2.1 Development of a mathematical model
The response surface method (RSM) is used to develop a mathematical model for the prediction of surface roughness. RSM is a pool of mathematical and statistical techniques those are useful for modeling and analysis of problems in which response of attentiveness is influenced by several input parameters. A second-order polynomial response surface mathematical equation was developed for average surface roughness (Ra) as a function of machining parameters considered. The developed regression mathematical models to predict the output response (Ra) in constant feed and proposed progressive feed type of machining are shown in Eq. (3) and Eq. (4) respectively.
Ra=0.6920-0.000107*s+0.001036*f-0.0856*d+0.000000*s*s-0.000000*f*f-0.0020*d*d +0.000000*s*f+0.000008*s*d-0.000011*f*d (3)
Ra=0.5535-0.000109*s+0.000943*f-0.0400*d+0.000000*s*s-0.000000*f*f-0.0040*d*d +0.000000*s*f+0.000013*s*d-0.000144*f*d (4)
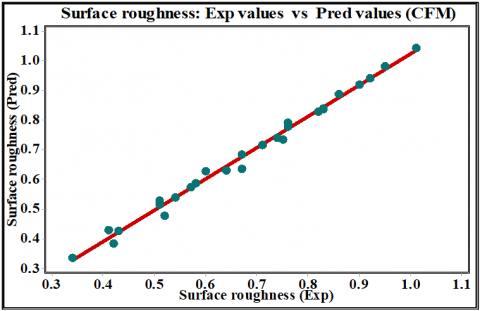
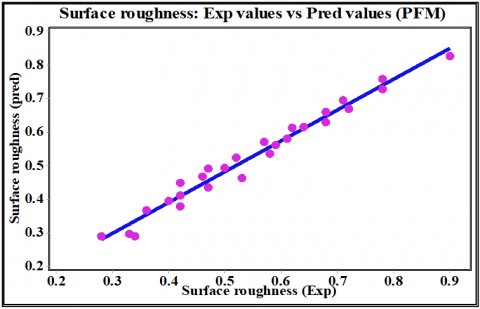
The correlation graphs between predicted and experimental values of response (Ra) are established (Figure 5a and Figure 5b). The developed regression model shows a good correlation between the experimental and predicted values of Ra. Experimental values of surface roughness from the conducted experiments and predicted values of response (Ra) from the developed regression models are shown in Table 7. The mean relative error between experimental and predicted values of Ra is 2.56 in constant feed machining and it is 5.08 in progressive feed machining (Table 7). Hence the developed regression model is effective and it can be used to find the response (Ra) for a given set of input parameters. These errors may be due to machine tool vibration, spindle run-out, chip loads and work piece material property.
(a) Constant feed machining
(b) Progressive feed machining
Figure 5. Experimental Vs predicted values of Ra
Table 7. Experimental Vs Predicted values of surface roughness with their Abs % of errors
|
Tr. no |
Ra in CF |
% of error |
Abs % of error |
Ra in PF |
% of error |
Abs % of error |
||
|
Exp |
Pred |
Exp |
Pred |
|||||
|
1 |
0.64 |
0.630 |
1.56 |
1.56 |
0.50 |
0.494 |
1.15 |
1.150 |
|
2 |
0.57 |
0.573 |
-0.53 |
0.53 |
0.46 |
0.469 |
-1.94 |
1.935 |
|
3 |
0.51 |
0.514 |
-0.78 |
0.78 |
0.42 |
0.448 |
-6.68 |
6.679 |
|
4 |
0.83 |
0.836 |
-0.72 |
0.72 |
0.68 |
0.661 |
2.76 |
2.757 |
|
5 |
0.76 |
0.777 |
-2.24 |
2.24 |
0.62 |
0.614 |
0.92 |
0.919 |
|
6 |
0.71 |
0.716 |
-0.85 |
0.85 |
0.57 |
0.572 |
-0.33 |
0.325 |
|
7 |
1.01 |
1.041 |
-3.07 |
3.07 |
0.90 |
0.828 |
7.97 |
7.972 |
|
8 |
0.95 |
0.981 |
-3.26 |
3.26 |
0.78 |
0.760 |
2.60 |
2.603 |
|
9 |
0.90 |
0.918 |
-2.00 |
2.00 |
0.71 |
0.696 |
2.02 |
2.021 |
|
10 |
0.51 |
0.529 |
-3.73 |
3.73 |
0.40 |
0.395 |
1.25 |
1.250 |
|
11 |
0.52 |
0.478 |
8.08 |
8.08 |
0.42 |
0.379 |
9.67 |
9.667 |
|
12 |
0.43 |
0.425 |
1.16 |
1.16 |
0.36 |
0.368 |
-2.31 |
2.306 |
|
13 |
0.75 |
0.735 |
2.00 |
2.00 |
0.59 |
0.562 |
4.75 |
4.746 |
|
14 |
0.67 |
0.682 |
-1.79 |
1.79 |
0.52 |
0.525 |
-0.92 |
0.923 |
|
15 |
0.60 |
0.627 |
-4.50 |
4.50 |
0.47 |
0.492 |
-4.70 |
4.702 |
|
16 |
0.92 |
0.940 |
-2.17 |
2.17 |
0.78 |
0.729 |
6.54 |
6.538 |
|
17 |
0.86 |
0.886 |
-3.02 |
3.02 |
0.72 |
0.670 |
6.92 |
6.917 |
|
18 |
0.82 |
0.829 |
-1.10 |
1.10 |
0.64 |
0.616 |
3.77 |
3.766 |
|
19 |
0.41 |
0.428 |
-4.39 |
4.39 |
0.33 |
0.296 |
10.40 |
10.38 |
|
20 |
0.42 |
0.383 |
8.81 |
8.81 |
0.34 |
0.29 |
14.70 |
14.74 |
|
21 |
0.34 |
0.336 |
1.18 |
1.18 |
0.28 |
0.289 |
-3.05 |
3.054 |
|
22 |
0.67 |
0.634 |
5.37 |
5.37 |
0.53 |
0.463 |
12.70 |
12.69 |
|
23 |
0.58 |
0.587 |
-1.21 |
1.21 |
0.47 |
0.435 |
7.38 |
7.383 |
|
24 |
0.54 |
0.538 |
0.37 |
0.37 |
0.42 |
0.412 |
1.82 |
1.821 |
|
25 |
0.83 |
0.839 |
-1.08 |
1.08 |
0.68 |
0.630 |
7.39 |
7.390 |
|
26 |
0.76 |
0.791 |
-4.08 |
4.08 |
0.61 |
0.581 |
4.80 |
4.803 |
|
27 |
0.74 |
0.740 |
0.00 |
0.00 |
0.58 |
0.536 |
7.56 |
7.560 |
|
Mean value of absolute % of error |
2.56 |
Mean value of absolute % of error |
5.08 |
|||||
4.2.2 Model fitness check
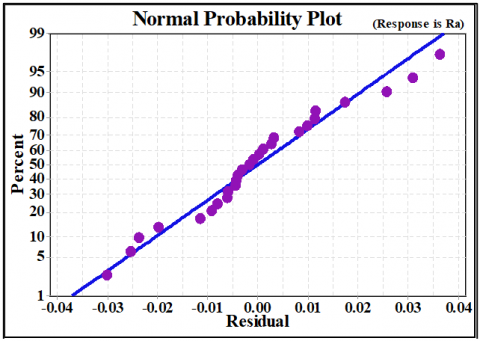
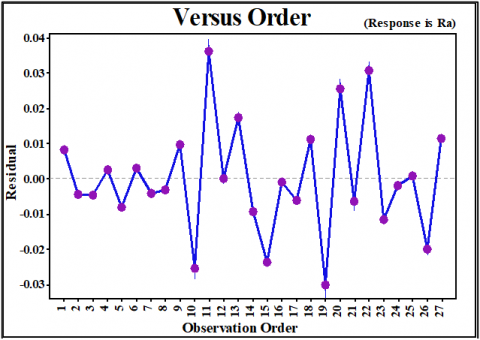
The residual plots were used to analyze and investigate the adequacy of the developed regression model. Residual is the difference between the experimentally measured value and predicted value. These are studied using the following plots: normal probability plots of the residual (Figure 6a), the plots of residuals versus predicted response (Figure 6b) and residual versus the order of predicted response (Figure 6c).
Figure 6a. reveals that the residual is not in a particular trend. However, the errors are distributed normally. Figure 6b shows that there is no forecastable trend and random structure. Figure 6c. displays the distribution of residual against observation order.
(a)
(b)
(c)
Figure 6. (a) Normal probability plot of residual for Ra; (b) Plot of residual versus fitted Ra values; (c) Plot of residual versus order of Ra values
4.3 Parametric influence on surface roughness
4.3.1 Main effects plot for constant and progressive feed
The main effects of machining parameters on mean value of Ra for constant feed and progressive feed machining are shown in Figure 7(a) and Figure 7(b) on the same scale to better understand the trend. It shows that progressive feed is giving better surface finish than the constant feed machining. This is mainly due to avoidance of sudden impact of the cutting tool with the work piece. This leads to, less chattering, reduction in cutting forces and in turn reduction of tool deflection as well as tool vibration.
(a) Constant feed machining
(b) Progressive feed machining
Figure 7. Main effect plots for Ra on same scale
In both, constant feed and progressive feed machining; increase in spindle speed decreases the average surface roughness (Ra). But an increase in feed rate, increases the response (Ra) drastically, whereas an increase in depth of cut decreases the Ra. Even though same trend has been observed in both the types of machining, main effects plots reveals that average surface roughness (Ra) in progressive feed machining is comparatively lesser than the constant feed machining.
4.3.2 Interaction effect of feed rate on response (Ra)
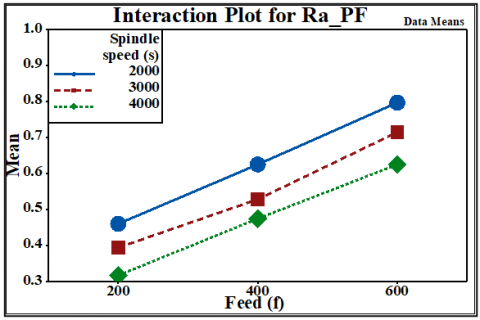
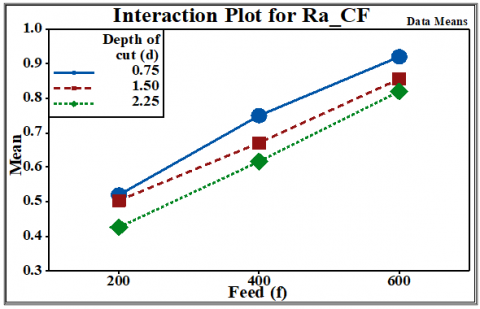
Interaction plots for mean value of Ra have been drawn against feed rate keeping other factors constant one at a time. Figure 8a and Figure 8b shows the interaction effect of feed rate for a given value of spindle speed. It reveals that at a constant spindle speed, average surface roughness (Ra) increases drastically with the increase of feed rate (f) in both constant and progressive feed machining. However, comparatively better surface finish was noticed in progressive feed machining than the conventional constant feed machining. Figure 8c and Figure 8d shows the interaction effect of feed rate for a constant value of depth of cut. It reveals that, mean value surface roughness (Ra) increases considerably with the increase of feed rate (f) in both the machining environments. Here also better surface finish observed in progressive feed rate machining.
(a) Mean of Ra Vs f at three levels of spindle speed_CFM
(b) Mean of Ra Vs f at three levels of spindle speed_PFM
(c) Mean of Ra Vs f at three levels of depth of cut_CFM
(d) Mean of Ra Vs f at three levels of depth of cut_PFM
Figure 8. Interaction effect plots
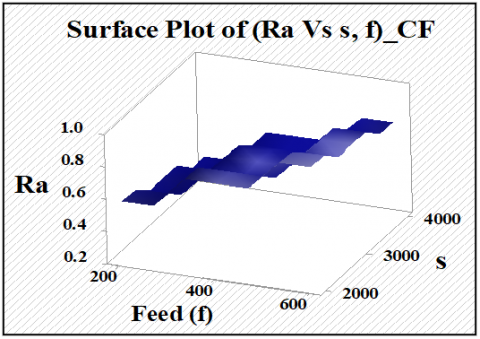
4.3.3 Surface plots
The experimental data is further analyzed with help of 3D- surface plots. Figure 9a and Figure 9b represents the effect of feed rate and spindle speed on surface roughness in constant and progressive feed machining respectively. Whereas Figure 9c and Figure 9d represents the effect of feed rate and depth of cut on average surface roughness in constant feed and progressive feed machining respectively. It is clear from these plots, that progressive feed machining yields relatively better surface finish in comparison with constant feed machining.
(a) Variation of Ra against feed rate and spindle speed_CFM
(b) Variation of Ra against feed rate and Spindle speed_PFM
(c) Variation of Ra against Feed rate and Depth of cut_CFM
(d) Variation of Ra against Feed rate and Depth of cut_PFM
Figure 9. 3D surface plots
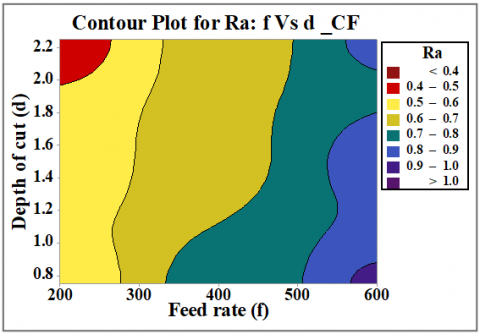
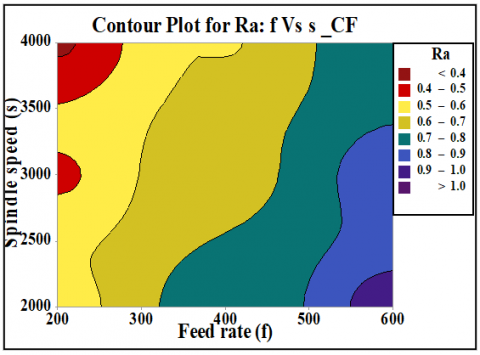
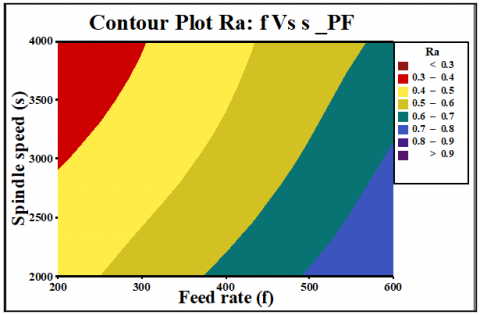
4.3.4 Contour plots
Figure 10a to Figure 10d illustrates the variation of average surface roughness (Ra) against various combinations of input machining parameters: feed rate Vs spindle speed, feed rate Vs depth of cut. It is well understood from main effects plots, interaction plots, 3D surface plots and contour plots that progressive feed machining is a good solution, for machining the aerospace components, which requires fine surface finish and also it avoids additional finishing operations like bench work etc. and save the machining time.
(a) Variation of Ra: Feed rate Vs Depth of cut_CFM
(b) Variation of Ra: Feed rate Vs Depth of cut_PFM
(c) Variation of Ra: Feed rate Vs Spindle speed_CFM
(d) Variation of Ra: Feed rate Vs Spindle speed_PFM
Figure 10. Contour plots
The effect of spindle speed, feed rate, and depth of cut on the aforesaid response while machining of BS L168-T6511 alloy in end milling process has been investigated. Experiments were conducted as per the Taguchi’s L27 factorial method in order to estimate the effect of input factors on average surface roughness (Ra) in both constant feed and progressive feed machining environments. From attained results, subsequent conclusions were derived:
(1) Progressive feed method of machining offered considerable reduction in average surface roughness (Ra) around 19.206% over conventional constant feed machining (Table 4). It is due to reduction in sudden impact of cutting tool with work piece, reduction in cutting tool deflection, minimal tool vibration and less chattering in progressive feed machining contributed to substantial drop in the response (Ra).
(2) The predicted values of Ra from the developed regression mathematical models are in good agreement with the experimental results. Errors, in constant feed and progressive feed machining are only 2.56% and 5.08% respectively. These errors are mainly due to uncontrollable variables like: chip loads, chip formation, tool wear and unexpected variations in power supply., etc.
(3) From the ANOVA analysis, feed rate has a foremost contribution on the considered response (Ra) both in constant feed machining as well as in progressive feed machining.
(4) The plot of residual errors (Figure 6a) was normally distributed, since the model residuals are following the path of straight line. Main effect plots, Interaction plots, and 3D surface plots reveal that considered response (Ra) increases drastically with the increase of feed rate in both the methods of machining.
(5) Better surface finish can be attained by incorporating lower feed rate, with higher spindle speed and higher depth of cut for the aforesaid material. This work also emphasizes that proper selection of cutting parameters along with progressive feed machining eliminates the use of secondary finishing operations and hence saves the manufacturing time and cost.
The authors acknowledge Department of Mechanical Engineering, NITK Surathkal, for all the encouragement and support.
|
Ra |
Average surface roughness |
|
f |
Feed rate, m.sec-1 |
|
s |
Spindle speed / Cutting speed, rpm |
|
d |
Depth of cut, mm |
|
F |
Fitness value |
|
P |
Probability value |
|
PF |
Progressive feed, m.s-1 |
|
CF |
Constant feed, m.s-1 |
|
DF |
Degree of Freedom |
|
DoE |
Design of Experiment |
|
RE |
Residual Error |
|
RSM |
Response Surface Methodology |
|
P |
P-value |
|
x |
% of starting feed rate with PF |
|
Y |
% of improvement in surface finishing |
|
CFM |
Constant feed machining |
|
PFM |
Progressive feed machining |
|
Subscripts |
|
|
a |
Average |
|
z |
Force acting along Z-direction |
|
x |
Force acting along X-direction |
[1] Hashimoto, F., Chaudhari, R.G., Melkote, S.N. (2016). Characteristics and performance of surfaces created by various finishing methods. Procedia CIRP, 45: 1-6. http://dx.doi.org/10.1016/j.procir.2016.02.052
[2] Ghosh, G., Mandal, P., Mondal, S.C. (2019). Modeling and optimization of surface roughness in keyway milling using ANN, genetic algorithm, and particle swarm optimization. The International Journal of Advanced Manufacturing Technology, 100(5): 1223-1242. http://doi.org/10.1007/s00170-017-1417-4
[3] Suresh Kumar Reddy, N., Venkateswara Rao, P. (2005). A genetic algorithmic approach for optimization of surface roughness prediction model in dry milling. Machine Science and Technology, 9(1): 63-84. http://dx.doi.org/10.1081/MST-200051263
[4] Reddy, N., Rao, P.V. (2006). Selection of an optimal parametric combination for achieving a better surface finish in dry milling using genetic algorithms. The International Journal of Advanced Manufacturing Technology, 28(5): 463-473. http://dx.doi.org/10.1007/s00170-004-2381-3
[5] Varghese, V., Ramesh, M.R., Chakradhar, D. (2018). Experimental investigation and optimization of machining parameters for sustainable machining. Materials and Manufacturing Processes, 33(16): 1782-1792. http://doi.org/10.1080/10426914.2018.1476760
[6] Abbas, A.T., Ragab, A.E., Al Bahkali, E.A., El Danaf, E.A. (2016). Optimizing cutting conditions for minimum surface roughness in face milling of high strength steel using carbide inserts. Advances in Materials Science and Engineering, 2016: 7372132. http://dx.doi.org/10.1155/2016/7372132
[7] Mumtaz, J., Li, Z., Imran, M., et al. (2019). Multi-objective optimization for minimum quantity lubrication assisted milling process based on hybrid response surface methodology and multi-objective genetic algorithm. Advances in Mechanical Engineering, 11(4): 1687814019829588. http://dx.doi.org/10.1177/1687814019829588
[8] Kumar, D., Rajamohan, G. (2015). Optimization of surface roughness and flatness in end milling of aluminum alloy AL 6063-T6. International Journal of Advances in Engineering & Technology, 8(6): 937-949. http://dx.doi.org/10.7323/ijaet/v8_iss6
[9] Tseng, T.L., Konada, U., Kwon, Y. (2016). A novel approach to predict surface roughness in machining operations using fuzzy set theory. Journal of Computational Design and Engineering, 3(1): 1-13. http://dx.doi.org/10.1016/j.jcde.2015.04.002
[10] Vakondios, D., Kyratsis, P., Yaldiz, S., Antoniadis, A. (2012). Influence of milling strategy on the surface roughness in ball end milling of the aluminum alloy Al7075-T6. Measurement, 45(6): 1480-1488. http://dx.doi.org/10.1016/j.measurement.2012.03.001
[11] Li, X., Guan, C.M., Zhao, P. (2018). Influences of milling and grinding on machined surface roughness and fatigue behavior of GH4169 super alloy work pieces. Chinese Journal of Aeronautics, 31(6): 1399-1405. http://doi.org/10.1016/j.cja.2017.07.013
[12] Ramanujam, R., Lohithaksha, M.M., Venkatesan, K., Mithun, V. (2014). Multi-response optimization using ANOVA and desirability function analysis: A case study in end milling of Inconel alloy. ARPN Journal of Engineering and Applied Sciences, 9(4): 457-463.
[13] Pang, J.S., Ansari, M.N.M., Zaroog, O.S., Ali, M.H., Sapuan, S.M. (2014). Taguchi design optimization of machining parameters on the CNC end milling process of halloysite nanotube with aluminum reinforced epoxy matrix (HNT/Al/Ep) hybrid composite. HBRC Journal, 10(2): 138-144. http://dx.doi.org/10.1016/j.hbrcj.2013.09.007
[14] Ranganath, M.S., Roshan, K., Desh, R., Mishra, R.S. (2016). Experimental analysis of surface roughness during CNC milling of brass using response surface methodology. International Journal of Modern Engineering Research, 6(5): 4-9.
[15] Yahya, E., Ding, G.F., Qin, S.F. (2015). Optimization of machining parameters based on surface roughness prediction for AA6061 using response surface method. American Journal of Science and Technology, 2(5): 220-231.
[16] Julie, Z.Z., Joseph, C.C., Daniel, K.E. (2007). Surface roughness optimization in an end-milling operation using the Taguchi design method. Journal of Materials Processing Technology, 184: 233-239. http://dx.doi.org/10.1016/j.jmatprotec.2006.11.029
[17] Rashmi, L.M., Karthik, R.M.C., Arun, K.S., Shrikantha, S.R., Mervin, A.H. (2018). Machining Parameters optimization of AA6061 using response surface methodology and particle swarm optimization. International Journal of Precision Engineering and Manufacturing, 19(5): 695-704. http://dx.doi.org/10.1007/s12541-018-0083-2
[18] Rashmi, L.M., Karthik, M.C.R., Arun, K.S., Shrikantha, S.R., Souza, R.J.D. (2018). Effect of process parameters in face milling operation and analysis of cutting force using the indirect method. Materials and Manufacturing Processes, 33(13): 1406-1414. http://doi.org/10.1080/10426914.2017.1388520
[19] Badrinadhan, K.S., Karunamoorthy, L. (2013). Study of the effect of progressive feed rate on the cutting force in CNC end milling of AISI 1045 steel. International Journal Engineering and Technology, 5(6): 4741-4751.
[20] Badrinadhan, K.S., Karunamoorthy, L. (2014). Reducing tool wear in CNC end milling operation using progressive feed rate. Applied Mechanics and Materials, 592-594: 716-723. http://dx.doi.org/10.4028/www.scientific.net/AMM.592-594.716
[21] Vasu, M., Hanumanthappa, S.N. (2018). Turning process on en47 spring steel with different tool nose radii using OFTA approach. Advances in Modelling and Analysis A, 55(2): 43-46. http://iieta.org/Journals/AMA/AMA_A
[22] Joshy, A., Dsouza, R., Muthirulan, V., Sachidananda, K.H. (2019). Experimental analysis on the turning of aluminum alloy 7075 based on Taguchi method and artificial neural network. Journal Européen des Systèmes Automatisés, 52(5): 429-437. https://doi.org/10.18280/jesa.520501
[23] Vasu, M., Nayaka, H.S. (2018). Comparative study of coated and uncoated tool inserts with dry machining of EN47 steel using Taguchi L9 optimization technique. advances in mechanical design, materials and manufacture. AIP Conference Proceedings, 1943: 020063. http://doi.org/10.1063/1.5029639
[24] Tien, D.H., Nhu-Tung, N., Duc, Q.T., Van, T.N. (2019). Cutting forces and surface roughness in face-milling of SKD61 hard steel. Journal of Mechanical Engineering, 65(6): 375-385. http://dx.doi.org/10.5545/sv-jme.2019.6057
[25] Raneen, A.A., Mozammel, M., Aqib, M.K., Wenliang, C., Munish, K.G., Catalin, I.P. (2019). Multi-response optimization of face milling performance considering tool path strategies in machining of Al-2024. Materials, 12: 3-19. http://dx.doi.org/10.3390/ma12071013