Huicheng Hao* | Sixuan Yin | Ziyu Liu | Zemin Liu
© 2022 IIETA. This article is published by IIETA and is licensed under the CC BY 4.0 license (http://creativecommons.org/licenses/by/4.0/).
OPEN ACCESS
As the link between production and consumption, urban and rural areas, industry and agriculture, agricultural logistics plays a vital role in optimizing the rural industrial structure and developing the rural economy. However, the efficiency of agricultural logistics has been less studied. This paper launched a study on the evaluation of agricultural logistics performance based on DEA model, constructed an input-output index system, collected and collated data on relevant indicators of agricultural logistics in 30 provinces and municipalities (excluding Tibet) in 2018 and 2019, and applied DEAP2.1 software to evaluate the efficiency, and the research results showed that 7 provinces and municipalities showed strong agricultural logistics efficiency in 2018, 5 provinces and municipalities have efficiencies between 0.8 and 1, and 18 provinces and municipalities have efficiencies below 0.8. In 2019, 7 provinces and municipalities showed strong agricultural logistics efficiency, 6 provinces and municipalities had efficiency between 0.8 and 1, and 17 provinces and municipalities had efficiency below 0.8. Based on this, a regression analysis study was conducted on the influencing factors affecting agricultural logistics efficiency through the Tobit model, and the study concluded that the level of rural goods turnover, the level of agricultural logistics operation, the level of education of the labor force is the main factor affecting the efficiency of agricultural logistics, while the regional living standard and the level of construction of transport facilities have shown a significant uncorrelated.
agricultural logistics, data envelopment analysis, technical efficiency, Tobit model
As a large agricultural country, China has always taken developing rural economy as a basic state policy. With the advent of the "Internet +" era, the e-commerce of agricultural products develops rapidly and expands the market scale continuously [1]. At the same time, with the improvement of people's living standards, the consumption concept has gradually changed from the traditional single mode to the modern diversified and convenient mode [2], and consumers' demand for agricultural products has also increased, injecting fresh vitality into the development of agricultural logistics [3]. As an important force to promote industrial integration, agricultural logistics plays an important role in accelerating rural modernization and promoting rural revitalization. Many studies have shown that the efficiency of agricultural logistics in a country or region has a significant impact on the economic development of the region [4]. According to statistics, by 2020, China's rural population had reached 540,823,000, accounting for 38.6% of the total population. The improvement of farmers' living standards is of great significance to rural revitalization and common prosperity. Agricultural logistics is an important link in the development of urban-rural integration. In 2020, the national express service volume reaches 83 billion pieces, with over 30 billion pieces collected and delivered in rural areas, and more than one-third of the express volume is related to the three rural areas, which shows that China's agricultural logistics has great potential for development, and agricultural logistics has become one of the important factors affecting the development of the rural economy, providing support for the development of China's rural economy [5]. Agricultural logistics refers to the physical flow of a series of articles from the supply place to the receiving place with agricultural production as the core and related technical, organizational and management activities, so as to realize the organic combination of transportation, storage, processing, loading and unloading, packaging, circulation and information processing and other basic functions [6]. Agricultural logistics has a profound impact on the status and level of agricultural production and circulation. The coordinated development of agricultural logistics and rural economy is conducive to the realization of China's rural poverty alleviation and rural revitalization goals. However, how to integrate agricultural resources and develop agricultural logistics so that it can play its proper role to the maximum is a problem that has yet to be solved. Due to the uneven development of the agricultural logistics system in various provinces, the large volume of agricultural goods and services in China, and the wide regional nature of its natural distribution, how to base on the current situation of agricultural logistics, on the basis of existing research results, and from the characteristics of agricultural logistics itself, to make a qualitative analysis of agricultural logistics as well as rural. Based on the current situation of agricultural logistics, how to make a qualitative analysis of the characteristics of agricultural logistics and the rural economy, construct a scientific and reasonable DEA efficiency evaluation index system, evaluate the efficiency of agricultural logistics, and dig deeper into the key factors affecting agricultural logistics is worth studying, which is conducive to establishing a modern agricultural logistics system, promoting the restructuring of China's rural economy, promoting the construction of rural urbanization, and is of great value to achieving agricultural economic growth. At the same time, it provides the decision-making basis for the government to design the overall planning of agricultural logistics and formulate the agricultural logistics facilities construction. The paper takes the agricultural logistics data of 30 provinces and cities in China (except Tibet) from 2018-2019 as the research object, analyses the level of China's agricultural logistics efficiency, studies the impact of agricultural logistics on the development of China's rural economy in each province, and launches an analysis of the reasons for the differences in agricultural logistics efficiency in each province and city, while constructing a Tobit regression model to analyze the degree of influence of various factors on agricultural logistics efficiency, so as to further improve the Tobit regression model , so as to provide decision support for further improving the overall efficiency of agricultural logistics and the formulation of relevant policies.
2.1 Agricultural logistics
The value potential of agricultural logistics can influence the development of most industries to the certain extent. At present, there are few researches on agricultural logistics by domestic and foreign scholars. Agricultural logistics is mainly an activity of agricultural products from production to delivery to consumers, including the transportation, storage, packaging, processing and information exchange of agricultural products [7]. Gomiero [8] suggests that expanding production allows nearby farmers to supply products directly to the place of demand, largely alleviating transport problems and benefiting producers in nearby rural areas, not only saving time but also expanding marketing. Ahumada and Villalobos [9] has constructed a planning model based on urban distribution in Mexico by studying the traditional and external factors in the logistics of agricultural transport, which provides a basis for agricultural logistics decisions.
2.2 Logistics efficiency
Of all economic activities, agriculture holds the most natural resources, which suggests that the study of agricultural logistics efficiency is of great practical importance [10], with Zhou et al. [11] stating that Efficiency is doing things right and getting the most out of the least available resources [12]. While some domestic and international scholars have conducted many studies on efficiency, there are relatively few studies on efficiency in agricultural logistics. Chien and Chi [13] measuring and ranking the performance of twenty meat auction companies in Taiwan using the DEA method and recommending management strategies for each group to improve operational efficiency. Latruffe et al. [14] found through research that for crop production, the larger the land area, the higher the technical efficiency of the farm. Moutinho et al. [15] used a DEA model to estimate eco-efficiency in 26 EU countries, comparing labor, capital productivity, renewable energy and fossil energy as input indicators with the efficiency of the farm. Shah and Wu [16] argue that the efficiency of agricultural production systems can be enhanced through a combination of efforts such as reducing pesticides, fertilizers and improving crop yield efficiency. Rudinskaya et al. [17] found through their research that farm size has a positive effect on technical efficiency. Kostlivý and Fuksová [18] also found that the type of agriculture and the economic size of the farm influence the profitability, economic performance and comparability of the farm with conventional farms. The analysis of the effect of farm specialization on technical efficiency confirms that farms specializing in livestock production are more efficient. Technical efficiency can be used to find out what can be done to eliminate waste without adding any input or output, for example, if the minimum input such as labor, capital, technology, etc. can produce the maximum desired output, then the organization is considered technically efficient [19]. Huang et al. [20] used a newly developed DEA model to study the dynamics of regional eco-efficiency in China from 2000-2010. Yang et al. [21] measured the eco-efficiency of 30 Chinese provinces using GDP as output and energy consumption, fixed capital and sulfur emissions as inputs, and found different patterns of eco-efficiency across Chinese regions, with the eastern region being more eco-efficient. Yu et al. [22] used the Malmquist index to analyze the change in production efficiency across administrative regions from 2018 to 2019, and concluded that each administrative region inter-period changes in production efficiency. Liu et al. [23] evaluated the efficiency of public infrastructure investment in 290 cities in China from 2005-2014, and the empirical results showed that the overall technical efficiency level of Chinese cities was generally low, with an overall decreasing trend.
DEA is an effective non-parametric method for evaluating the relative efficiency of decision units, which does not require a precise functional form between inputs and outputs and overcomes some of the drawbacks of parametric methods [24]. Liu et al. [25] examined the sustainability of logistics in China and measured the unified efficiency of logistics firms under two different production arrangement strategies. The empirical study provides further evidence that logistics sustainability in China is still in its infancy; when faced with sustainability trade-offs, logistics companies still prefer operational performance. In recent years, DEA methods have been continuously applied to the agricultural sector [26, 27]. Wang and Zhang [28] selected output variables and input variables of the sugarcane production and factors of production models, respectively, to analyze the sugarcane production efficiency of eight cities in Guangdong Province from 2014 to 2018. Wang et al. [29] propose a hybrid data envelopment analysis (DEA) model that combines the DEA Malmquist approach and epsilon-based measurement (EBM) for the first time to address port terminal operator performance assessment. Mokhtar [30] applied the DEA methodology to study the changes in terminal efficiency and container movement at six major container terminals in Peninsular Malaysia to measure the efficiency of container terminals that contribute significantly to the country's economic development. Chen et al. [31] constructed an integrated principal component analysis-data envelopment analysis (PCA-DEA) model to evaluate the operational efficiency of iron ore logistics in Bohai Bay ports. However, DEA models have discrete efficiency evaluation results between 0 and 1 and can be supplemented with models using regression analysis [32]. Using the Tobit model, Lozano and Adenso-Diaz [33] identified that an increase in the total number of farms increases farm efficiency.
3.1 DEA model construction and selection of input/output
DEA, or data envelopment analysis, is a non-parametric model, a quantitative analysis based on multiple input-output indicators and the relative effectiveness of homogeneous comparable units in linear programming, and has significant advantages in dealing with multiple indicator inputs and multiple indicator outputs [34]. The DEA model has no weight restrictions on the inputs and outputs of the DMUS [35], and it has a good ability to identify the optimal production frontier. due to these advantages, DEA has been widely used for efficiency evaluation in agriculture and other fields [36]. The CCR focuses on input-oriented minimization, and the model aims to minimize the amount of inputs [37]. The paper focuses on the use of this model to study the efficiency of agricultural logistics. For different decision units, both input and output indicators have different efficiency values, and efficiency values are important criteria by which we can judge the efficiency of scale and technical efficiency [38, 39]. There are n decision making units (DMUS), each with m types of "inputs" and s types of "outputs", and for the k-th DMU the i-th input indicator and the j-th output indicator are denoted as (i=1,2,...m) and (j=1,2,...s), where k$\in$k={1,2,...,n}.At this point, the technical efficiency of the decision unit can be determined by the following mathematical model of planning:
$\min \left[ \theta -\varepsilon \left( \sum\limits_{j=1}^{s}{{{s}_{j}}^{+}\sum\limits_{i=1}^{m}{s{{i}^{-}}}} \right) \right]$ (1)
$s.t.\left\{ \begin{align} & \sum\limits_{k=1}^{n}{{{\lambda }_{kxik}}+{{s}_{i}}^{-}={{\theta }_{xik0}}} \\ & \sum\limits_{k=1}^{n}{{{\lambda }_{kyjk}}-{{s}_{j}}^{+}={{\theta }_{yjk0}}} \\ & \sum\limits_{k=1}^{n}{{{\lambda }_{k}}=1,}{{\lambda }_{k}}\ge 0 \\ & {{s}_{i}}^{-}\ge 0,{{s}_{j}}^{+}\ge 0 \\\end{align} \right.$ (2)
In the above equation, θ is the relative efficiency value, is the agricultural logistics efficiency value, λk is the coefficient, si- and sj+ are the slack variables for input indicator xi and output indicator yj respectively, when θ*=1 and si-*=sj+*=0, the decision unit is DEA effective [40], when = 1, and si-* and sj+* are not all 0, then the DMU is DEA weakly effective; Otherwise, DEA is not effective. Technically efficient means that the output has been maximized relative to the input, and scale efficient means that the input indicator is neither too large nor too small, and lies between increasing and decreasing returns to scale, that is a state of constant returns to scale [41]. When using the DEA model for efficiency evaluation, the decision units selected must be homogeneous, and the number of indicators must be less than or equal to half the number of decision units in order to accurately measure the results [42], and make the analysis results more reasonable.
Based on the existing research and the actual situation in China, and considering the availability, accuracy and timeliness of index data, this paper puts forward the following five input and output indicators.
I. Input indicators.
(1) Area of crop cultivation. It refers to the actual sown or transplanted area of crops, mainly including grain, cotton, oil, sugar, hemp, tobacco, vegetables and melons, medicinal materials and other crops in a total of nine categories.
(2) Investment in agricultural fixed assets. This indicator is expressed in terms of investment in fixed assets by rural farming households, including investment in fixed assets such as road construction, machinery and equipment used for cultivation, etc. The statistical standard is 1,000 yuan or more, and the usage period is 2 years or more.
(3) Number of people employed in agricultural logistics. This indicator is a specific quantification of the labor force, and as there are no specific statistics on this indicator in the actual statistical yearbooks, this paper draws on Wang Renxiang's [43] approach to this part of the data to make it as accurate a reflection as possible of the number of people employed in agricultural logistics. This part of the data is expressed in the form of the number of people employed in agriculture by putting the number of rural people × 0.8 (taking into account the existence of some rural people working outside the home, etc.).
II. Output indicators.
(1) Gross agricultural output. It is the total amount of all agricultural, forestry, livestock and fishery products in monetary terms over a certain period of time (usually one year). The total agricultural output value reflects the total size and overall level of agricultural production in a country or region and is the result of agricultural production activities. China has a long history as a large agricultural country, and agricultural income has always been a major component of household income in mountainous areas where transportation is difficult [44]. This paper uses the total agricultural output value of each province and city to measure changes in agricultural production.
(2) Value added of agricultural logistics. This indicator mainly reflects the output level of regional agricultural logistics operations. As the actual yearbook does not contain specific statistics on this indicator, the value added of agricultural logistics is expressed by putting. (The total added value of transportation, storage, postal service, agriculture, forestry, husbandry and fishery industries multiplied by the provincial rural Engel coefficient).
3.2 Efficiency evaluation results and analysis
The data in this paper were obtained from the National Bureau of Statistics (2019-2020), China Statistical Yearbook (2019-2020) China Rural Statistical Yearbook (2019-2020), China Economic Network and China Federation of Logistics and Purchasing, and were collated and excluded from the study in view of the lack of data on key indicators in the Tibet Autonomous Region. The DEAP 2.1 software was used to measure the efficiency of agricultural logistics in 30 provinces and cities across China (except Tibet) in 2018 and 2019, and the results of the analysis are shown in Table 1 below.
Table 1. Relative efficiency of provinces and cities in China
|
DMU |
2018 |
2019 |
|||||||
|
crste |
vrste |
scale |
returns to scale |
crste |
vrste |
scale |
returns to scale |
||
|
Beijing |
1 |
1 |
1 |
- |
1 |
1 |
1 |
- |
|
|
Tianjin |
0.819 |
1 |
0.819 |
irs |
0.825 |
1 |
0.825 |
irs |
|
|
Hebei |
0.67 |
0.693 |
0.967 |
drs |
0.689 |
0.697 |
0.989 |
drs |
|
|
Shanxi |
0.375 |
0.375 |
1 |
- |
0.432 |
0.433 |
0.999 |
- |
|
|
Inner Mongoria |
0.877 |
0.924 |
0.948 |
drs |
0.805 |
0.854 |
0.942 |
drs |
|
|
Liaoning |
0.776 |
0.785 |
0.989 |
drs |
0.766 |
0.774 |
0.99 |
drs |
|
|
Jilin |
0.492 |
0.519 |
0.947 |
irs |
0.523 |
0.537 |
0.973 |
irs |
|
|
Heilongjiang |
1 |
1 |
1 |
- |
1 |
1 |
1 |
- |
|
|
Shanghai |
1 |
1 |
1 |
- |
1 |
1 |
1 |
- |
|
|
Jiangsu |
1 |
1 |
1 |
- |
1 |
1 |
1 |
- |
|
|
Zhejiang |
0.731 |
0.809 |
0.904 |
drs |
0.659 |
0.713 |
0.925 |
drs |
|
|
Anhui |
0.465 |
0.515 |
0.903 |
drs |
0.467 |
0.582 |
0.802 |
drs |
|
|
Fujian |
1 |
1 |
1 |
- |
0.98 |
1 |
0.98 |
drs |
|
|
Jiangxi |
0.471 |
0.471 |
1 |
- |
0.451 |
0.465 |
0.97 |
drs |
|
|
Shandong |
0.652 |
1 |
0.652 |
drs |
0.618 |
1 |
0.618 |
drs |
|
|
Henan |
0.614 |
1 |
0.614 |
drs |
0.696 |
1 |
0.696 |
drs |
|
|
Hubei |
0.72 |
0.815 |
0.884 |
drs |
0.729 |
0.84 |
0.868 |
drs |
|
|
Hunan |
0.483 |
0.589 |
0.82 |
drs |
0.528 |
0.659 |
0.802 |
drs |
|
|
Guangdong |
0.848 |
1 |
0.848 |
drs |
0.936 |
1 |
0.936 |
drs |
|
|
Guangxi |
0.622 |
0.776 |
0.801 |
drs |
0.624 |
0.865 |
0.721 |
drs |
|
|
Hainan |
1 |
1 |
1 |
- |
1 |
1 |
1 |
- |
|
|
Chongqing |
0.907 |
0.908 |
0.999 |
irs |
0.926 |
0.928 |
0.998 |
drs |
|
|
Sichuan |
0.665 |
0.941 |
0.707 |
drs |
0.666 |
0.93 |
0.716 |
drs |
|
|
Guizhou |
1 |
1 |
1 |
- |
0.838 |
0.838 |
1 |
- |
|
|
Yunnan |
0.533 |
0.575 |
0.927 |
drs |
0.573 |
0.671 |
0.854 |
drs |
|
|
Shaanxi |
0.783 |
0.927 |
0.844 |
drs |
0.789 |
0.977 |
0.808 |
irs |
|
|
Gansu |
0.616 |
0.631 |
0.976 |
irs |
0.635 |
0.649 |
0.979 |
irs |
|
|
Qinghai |
0.378 |
0.955 |
0.396 |
irs |
0.328 |
0.949 |
0.345 |
irs |
|
|
Ningxia |
0.595 |
1 |
0.595 |
irs |
0.548 |
1 |
0.548 |
drs |
|
|
Xinjiang |
0.996 |
1 |
0.996 |
drs |
0.941 |
1 |
0.941 |
drs |
|
|
Mean |
0.736 |
0.84 |
0.884 |
|
0.732 |
0.845 |
0.874 |
|
|
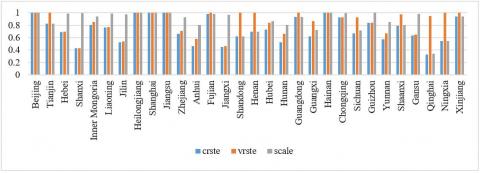
Table 1 shows the value of agricultural logistics efficiency in each region of the country in 2018 and 2019. According to the above data outputs, it can be seen that the agricultural logistics efficiency in China was generally high in 2018, with an average efficiency of 0.736, and 7 provinces and cities reached an efficiency of 1 in DEA effective state, this means that the minimum consumption and maximum output makes the best use of resources. Namely: Beijing, Heilongjiang, Shanghai, Jiangsu, Fujian, Hainan and Guizhou, which indirectly reflects that these 7 provinces and cities have a more efficient agricultural logistics system, which can better serve the regional agriculture. The remaining 23 provinces and cities did not reach DEA effective status and there were significant differences in the overall efficiency of each province and city (refer to Figure 1, Figure 2). 8 provinces and cities showed increasing returns to scale, which can be used to increase marginal returns by expanding scale as a way to improve efficiency, and 15 provinces and cities showed decreasing returns to scale. In 2019, China's agricultural logistics efficiency was generally high, with an average efficiency of 0.732, almost the same as the level of overall efficiency in 2018, which indicates that improving the efficiency of agricultural logistics is a long process that requires a long period of construction and operation. 7 provinces and municipalities reached an efficiency of 1 in 2019 and were in a DEA effective state: Beijing, Heilongjiang, Shanghai, Jiangsu, Hainan, Ningxia and Xinjiang, while 17 provinces and municipalities experienced diminishing returns to scale.
In the past two years, the overall efficiency has been around 0.73, of which, the five regions of Beijing, Heilongjiang, Shanghai, Jiangsu and Hainan have always been in DEA effective state, indicating a reasonable allocation of resources. The overall efficiency of Shanxi, Jilin and Jiangxi is relatively low, and there is still much room for improvement. In the past two years, the efficiency of the developed regions is basically at the ideal level and in line with the norm. Due to the greater degree of national investment in various resources in the developed regions and the leading position of the economy, it naturally drives the rapid development of agricultural logistics, and the corresponding larger output compared to the less developed regions is a normal phenomenon. In addition, a number of regions have high scale efficiency but low overall and technical efficiency, for example, Shanxi, Jilin, Anhui, Jiangxi, Hunan and Yunnan, where scale efficiency is close to 1 but overall and technical efficiency is less than 0.5 on average, which may be due to the redundancy of inputs or insufficient output in the development of the agricultural logistics industry in these regions and the internal management of the industry. It may be that the internal management of the industry is not yet complete, and due to the low technical efficiency of these areas, it is speculated that there may be a lack of advanced technical equipment and intelligent facilities as technical support, while the overall level of the labor force also contributes to this problem.
There are five regions with all efficiencies in DEA effective status in 2018-2019 (refer to Table 2), among which there are two in East China, one in South China, one in North China and one in Northeast China, namely Jiangsu, Shanghai, Hainan, Beijing and Heilongjiang, while there are no provinces and cities in Central and Western China that have reached DEA effective status. Thus, it seems that there are large geographical differences in the efficiency of agricultural logistics across regions in the last two years. In addition, this paper also studies the efficiency of agricultural logistics from the perspective of each region. The efficiency value is shown in Table 3, and the comprehensive efficiency varies greatly among different regions in China. Among them, the eastern region has the highest efficiency with an average of 0.86, while the central region has the lowest efficiency with only about 0.6. The technical efficiency of the eastern region is at the highest level among the three regions, close to 1, while that of the central region is only about 0.7, indicating that technology plays a key role in improving the comprehensive efficiency. Therefore, the areas with low efficiency should actively learn from the experience of advantageous areas and strengthen the construction of weak links, so as to promote the development of agricultural logistics to a better direction. In order to thoroughly solve the existing problems at the present stage, it is necessary for the relevant departments in vulnerable areas to reasonably allocate resources, so as to improve the efficiency of agricultural logistics to achieve the optimization.
Table 2. Areas with all three efficiencies of 1 in 2018-2019
|
Region |
Area |
crste |
vrste |
scale |
returns to scale |
|
Northern |
Beijing |
1.000 |
1.000 |
1.000 |
- |
|
North East |
Heilongjiang |
1.000 |
1.000 |
1.000 |
- |
|
Eastern |
Shanghai |
1.000 |
1.000 |
1.000 |
- |
|
Eastern |
Jiangsu |
1.000 |
1.000 |
1.000 |
- |
|
Southern |
Hainan |
1.000 |
1.000 |
1.000 |
- |
Table 3. Average efficiency of east, middle and west China
|
|
Eastern region mean |
Central region average |
Western region mean |
|||||||
|
crste |
vrste |
scale |
crste |
vrste |
scale |
crste |
vrste |
scale |
||
|
2018 |
0.863 |
0.935 |
0.925 |
0.612 |
0.698 |
0.892 |
0.719 |
0.882 |
0.827 |
|
|
2019 |
0.861 |
0.926 |
0.933 |
0.626 |
0.724 |
0.877 |
0.694 |
0.882 |
0.799 |
|
Figure 1. Efficiencies for 2018
Figure 2. Efficiencies for 2019
3.3 Tobit model construction and empirical hypothesis of influencing factors
Considering that the efficiency value analyzed by DEA ranges from 0 to 1, it has discreteness. In order to further explore the influencing factors of agricultural logistics efficiency, this paper adopts Tobit model (also known as maximum likelihood method intercept regression model) constructed by J. Tobin to carry out regression analysis and carry out quantitative research on the influencing factors. The DEA analysis of 2018, and 2019 national agricultural logistics comprehensive efficiency value of 30 provinces and cities are explained variable, on the basis of previous studies and combined with China's actual situation, this article put forward the index system of influence the efficiency of agricultural logistics, analysis the influence factors of agricultural logistics comprehensive technical efficiency, study the influence of various factors on the efficiency of agricultural logistics. The expression of Tobit regression model is:
$\begin{align} & {{Y}_{i}}={{\beta }_{0}}+{{\beta }_{1}}{{x}_{1i}}+{{\beta }_{2}}{{x}_{2i}} \\ & +{{\beta }_{k}}{{x}_{ki}}+{{\mu }_{i}}(i=1,2,3\ldots \text{n}) \\\end{align}$ (3)
where, k is the number of independent variables, β0 is a constant term, βj is the regression coefficient (j=1,2,3...n), i is the province, x1i is the level of transport infrastructure development, x2i is the regional standard of living, x3i is the level of agricultural logistics operations, x4i is the level of rural goods turnover, and x5i is the level of education of the workforce.
(1) The level of construction of transport infrastructure. The construction of agricultural logistics system is closely related to the construction level of transportation infrastructure in rural areas. The better the transportation system in rural areas, the lower the input cost of agricultural logistics distribution system construction, the higher the logistics output, and the higher the overall efficiency of agricultural logistics. Therefore, hypothesis 1 is proposed: the level of construction of transport infrastructure is positively related to the efficiency of agricultural logistics. The level of transportation infrastructure construction is expressed as the proportion of rural road mileage to the total mileage.
(2) Regional living standards. With the introduction of national policies to help farmers, the income of farmers is increasing, and the increase in the income of rural residents can boost their consumption, thus promoting the efficiency of agricultural logistics. Therefore, hypothesis 2 is proposed: regional living standards are positively related to agricultural logistics efficiency. The regional living standards is expressed in terms of disposable income per rural resident as a proportion of the total income of rural residents.
(3) The level of agricultural logistics operations. The level of agricultural logistics operations can, to the certain extent, reflect the level of development of the agricultural logistics industry. Agricultural products cannot be produced, transported and delivered to consumers without a transport carrier, therefore, the transport carrier is crucial to the efficiency of agricultural logistics. Therefore, hypothesis 3 is proposed: the level of agricultural logistics operation is positively related to the efficiency of agricultural logistics. The level of agricultural logistics operations is expressed in terms of the value added of agriculture, forestry, animal husbandry and fisheries and the value added of transport as a proportion of the value added of primary, secondary and tertiary industries.
(4) The level of rural goods turnover. It represents the product of the actual tonnage of goods transported by the transport sector and the distance it travels in a certain period of time. The level of rural cargo turnover can help the transport sector to make plans and provide economic assessments. Therefore, hypothesis 4 is proposed: the level of rural freight turnover is positively correlated with the logistics efficiency of the industry. The level of rural freight turnover is expressed as the proportion of rural road freight turnover to total freight traffic.
(5) Level of education of the workforce. The professional quality of agricultural logistics personnel and managers. Agricultural logistics includes many logistics links such as picking, packing, loading and unloading, transportation, storage and distribution, etc. It is a complex system consisting of logistics facilities, logistics equipment and labor force, in which logistics personnel and managers are the dominant factors and determine the efficiency of logistics. Therefore, hypothesis 5 is proposed: the education level of the workforce is positively related to the efficiency of agricultural logistics. The level of education of the workforce is expressed as a proportion of the total workforce in terms of the number of regional undergraduate graduates from general higher education institutions.
3.4 Tobit linear regression analysis results
In this paper, the comprehensive efficiency values of agricultural logistics in 30 provinces and municipalities nationwide in 2018 and 2019 derived from DEA analysis were taken as the explanatory variables, and five indicators in 30 provinces and municipalities in 2018 and 2019 were selected as explanatory variables, and the degree of influence of each factor on the efficiency of agricultural logistics was calculated by applying SPSS 26.0. The results of the statistical analysis are shown in Table 4.
Based on the above results, the final Tobit regression model can be obtained as follows:
$\begin{align} & {{Y}_{i}}=0.892-0.723{{x}_{1i}}-0.665{{x}_{2i}} \\ & +0.655{{x}_{3i}}+5.592{{x}_{4i}}+0.350{{x}_{5i}} \\\end{align}$ (4)
The regression results show that the values of VIF are less than 2, indicating that there is no multicollinearity between the variables. The goodness-of-fit test yielded R2=0.895, indicating that the Tobit regression model fits well, the positive or negative of the coefficient reflects the positive or negative of the correlation between the independent variable and the dependent variable, and the size of the coefficient represents the correlation between the independent variable and the dependent variable. P value less than 0.1 is significant, and that there is a significant positive relationship between the level of agricultural logistics operations, the level of rural goods turnover and the overall efficiency of the agricultural logistics industry, thus hypothesis 3 and 4 are valid. There is no significant positive relationship between regional living standard, labor force education level and transportation facilities construction level and the overall efficiency of agricultural logistics, thus hypothesis 1, hypothesis 2 and hypothesis 5 are not valid.
Table 4. Tobit model regression analysis results
|
Variables |
Coefficient |
Significance (P) |
VIF |
Standard deviation |
|
Constant term |
0.892 |
0.104 |
|
|
|
Level of construction of transport facilities |
-0.723 |
0.169 |
1.306 |
0.311 |
|
Regional standard of living |
-0.665 |
0.044 |
1.229 |
0.139 |
|
Level of agriculture logistics operations |
0.655 |
0.031 |
1.442 |
0.113 |
|
Level of rural goods turnover |
5.592 |
0.000 |
1.122 |
0.328 |
|
Level of education of the workforce |
0.350 |
0.321 |
1.027 |
0.134 |
|
R2=0.895 |
||||
(1) The coefficient of the level of agricultural logistics operations is 0.655, which is a high level of significance. This indicates that the level of information technology is positively correlated with the efficiency of agricultural logistics, and hypothesis 3 holds. The high correlation coefficient indicates that the level of agricultural logistics operation can improve the overall efficiency of agricultural logistics to a certain extent.
(2) The coefficient of the level of rural goods turnover is 5.592, with a high significant level. This indicates that the level of rural cargo turnover is positively related to the efficiency of agricultural logistics, and hypothesis 4 holds. The level of rural cargo turnover is one of the important factors affecting the overall efficiency of agricultural logistics, that means for every 1 unit increase in the level of rural cargo turnover, the overall efficiency of agricultural logistics will increase by 5.592 units. Therefore, increasing the level of rural cargo turnover can significantly improve the overall efficiency of agricultural logistics.
(3) The level of education of the labor force shows a statistically insignificant positive correlation with a coefficient of 0.350, indicating that the level of education of the labor force will have an enhancing effect on the efficiency of agricultural logistics, but the effect is less significant.
(4) Regional living standards and agricultural logistics efficiency show a significant negative correlation, with a coefficient of -0.665, indicating that after regional living standards reach a certain level, they do not always promote the improvement of agricultural logistics efficiency, and even show a negative correlation, which will inhibit the overall efficiency of agricultural logistics. The level of construction of transport facilities shows a non-significant negative correlation, indicating that after the construction of transport facilities has reached a certain level, continuing to strengthen the construction of this area cannot continue to play a role in promoting the efficiency of agricultural logistics.
In this paper, by using the DEA model, the evaluation study on the efficiency of agricultural logistics in 30 provinces and cities (except Tibet) in 2018 and 2019 was carried out. On the whole, the overall efficiency of agricultural logistics in all regions of the country is high and tends to be stable in two years, the efficiency level of each region is more differentiated, and the average value of scale efficiency is higher than the average value of pure technical efficiency, which indicates that the low pure technical efficiency is the main reason for the low overall efficiency. This reflects that the development of agricultural logistics in China needs to further improve the technology, and the improvement of technical efficiency will strongly promote the improvement of overall efficiency. The development of China's rural economy depends to a large extent on the development of agricultural logistics. The shortcomings of the agricultural logistics system are mainly reflected in the backwardness of the agricultural infrastructure, the difficulty of connecting with urban transport, the low level of specialization and socialization, the basic integration of producers and consumers, and the low circulation rate. Provincial and municipal governments and relevant departments should continue to follow up on the development of agricultural logistics, while paying attention to the input and output of agricultural logistics, with a view to optimizing the allocation of resources.
The Tobit model was used to analyze the factors influencing the efficiency of agricultural logistics, and it was found that the level of agricultural logistics operations, the level of rural goods turnover and the overall efficiency of the agricultural logistics industry had a significant positive relationship and a large degree of influence. There is no significant positive correlation between regional living standards and the level of construction of transport facilities and the overall efficiency of agricultural logistics. Therefore, efforts should be made to improve China's agricultural logistics industry in terms of the level of rural cargo turnover, the level of agricultural logistics operations and the level of education of the workforce, so as to promote the development of the rural economy.
By examining the factors affecting the efficiency of agricultural logistics, the results of this study can be used by Chinese provinces and regions as a reference for input volume adjustment in the following year, and can provide decision-making recommendations for the development of agricultural logistics in provinces and municipalities that have not yet reached optimal efficiency. The analysis of the results using the model saves a lot of time as well as improving agricultural logistics efficiency for quantitative management, and also allows the calculation of the appropriate input amounts for each indicator, improving the relevance and accuracy of the work for improving agricultural logistics.
According to the empirical results, the hypothesis of enhancing the efficiency of agricultural logistics can be strengthened in four aspects: improving the operation level of agricultural logistics, strengthening the level of rural goods turnover, increasing the investment in logistics technology, improving the education level of the workforce and proposing to improve the efficiency of agricultural logistics; at the same time, the government should moreover increase the support for disadvantaged areas, the government should increase the investment of resources in the central and western regions, and bring the advantageous regions' technology into disadvantaged areas, and promote the development of agricultural logistics in disadvantaged areas in an integrated manner in terms of policy, resource allocation and synergy.
This paper uses the DEA model and Tobit model to study the evaluation of agricultural logistics efficiency and its influencing factors. The fact that it is difficult to collect data related to the agricultural logistics industry, and difficult to ensure the accuracy and completeness of the relevant data, has caused a great obstacle to the research related to agricultural logistics. The next research continues to focus on the factors influencing the efficiency of agricultural logistics on the rural economy, and continues to improve the in-depth excavation, as the times and environment are different, the influencing factors will slowly change.
This study was funded by the Natural Science Foundation of China (Grant No:71671034 and 72071038) and Academic backbone project of Northeast Agricultural University. We would like to thank editorial team support. And we are also very grateful to the reviewers for their valuable comments on this paper.
[1] Zhang, S., Guo, K., Sun, Y. (2017). Study on integrated optimization model of inventory and routing problem and its application in China's online agricultural products logistics. Custos E Agronegocio on Line, 13(2): 73-87.
[2] Zhou, L., Wu, J., Mu, D., Wu, Y., Gu, Z. (2016). Construction innovation of urban green logistics centers for agricultural products. Open House International, 41(3): 26-31. https://doi.org/10.1108/OHI-03-2016-B0004
[3] Ni, S., Lin, Y., Li, Y., Shao, H., Wang, S. (2019). An evaluation method for green logistics system design of agricultural products: A case study in Shandong province, China. Advances in Mechanical Engineering, 11(1): 1-9. https://doi.org/10.1177/1687814018816878
[4] Park, H.H., Cho, S.J. (2021). An analysis of the effect of logistics efficiency on the export of Korean agricultural products to new southern countries. Journal of Korea Trade, 25(1): 169-183. https://doi.org/10.35611/jkt.2021.25.1.169
[5] Chen, W., Hao, Y., Jin, N. (2019). Product collaborative innovation of project-based supply chain under the influence of knowledge input. Journal Européen des Systèmes Automatisés, 2(3): 243-251. https://doi.org/10.18280/jesa.520304
[6] Etemadnia, H., Goetz, S.J., Canning, P., Tavallali, M.S. (2015). Optimal wholesale facilities location within the fruit and vegetables supply chain with bimodal transportation options: An LP-MIP heuristic approach. European Journal of Operational Research, 244(2): 648-661. https://doi.org/10.1016/j.ejor.2015.01.044
[7] Tra, C.I., Towe, C.A. (2016). The implications of the US renewable fuel standard programme for farm structure. Applied Economics, 48(8): 712-722. https://doi.org/10.1080/00036846.2015.1085644
[8] Gomiero, T. (2018). Food quality assessment in organic vs. conventional agricultural produce: Findings and issues. Applied Soil Ecology, 123: 714-728. https://doi.org/10.1016/j.apsoil.2017.10.014
[9] Ahumada, O., Villalobos, J.R. (2011). A tactical model for planning the production and distribution of fresh produce. Annals of Operations Research, 190(1): 339-358. https://doi.org/10.1007/s10479-009-0614-4
[10] Pang, J., Chen, X., Zhang, Z., Li, H. (2016). Measuring eco-efficiency of agriculture in China. Sustainability, 8(4): 398. https://doi.org/10.3390/su8040398
[11] Zhou, H., Yang, Y., Chen, Y., Zhu, J. (2018). Data envelopment analysis application in sustainability: The origins, development and future directions. European Journal of Operational Research, 264(1): 1-16. https://doi.org/10.1016/j.ejor.2017.06.023
[12] Wu, T.J., Hsiao, H.F. (2019). A study of performance evaluation on the introduction of enterprise resource planning into agriculture. Universidade Federal Rural de Pernambuco, 15(3): 385-396.
[13] Chien, L., Chi, S. (2019). An integrated data envelopment approach for evaluating the meat companies efficiency. Agricultural Economics, 65(10): 470-480. https://doi.org/10.17221/91/2019-AGRICECON
[14] Latruffe, L., Davidova, S., Balcombe, K. (2008). Application of a double bootstrap to investigation of determinants of technical efficiency of farms in Central Europe. Journal of Productivity Analysis, 29(2): 183-191. https://doi.org/10.1007/s11123-007-0074-2
[15] Moutinho, V., Madaleno, M., Robaina, M. (2017). The economic and environmental efficiency assessment in EU cross-country: Evidence from DEA and quantile regression approach. Ecological Indicators, 78: 85-97. https://doi.org/10.1016/j.ecolind.2017.02.042
[16] Shah, F., Wu, W. (2019). Soil and crop management strategies to ensure higher crop productivity within sustainable environments. Sustainability, 11(5): 1485. https://doi.org/10.3390/su11051485
[17] Rudinskaya, T., Hlavsa, T., Hruska, M. (2019). Estimation of technical efficiency of Czech farms operating in less favored areas. Agricultural Economics, 65(10): 445-453. https://doi.org/10.17221/52/2019-AGRICECON
[18] Kostlivý, V., Fuksová, Z. (2019). Technical efficiency and its determinants for Czech livestock farms. Agricultural Economics, 65(4): 175-184. https://doi.org/10.17221/162/2018-AGRICECON
[19] Zhang, L., Zeng, Y., Fang, Y. (2019). Evaluating the technical efficiency of care among long-term care facilities in Xiamen, China: Based on data envelopment analysis and Tobit model. BMC Public Health, 19(1): 1-9.
[20] Huang, J., Yang, X., Cheng, G., Wang, S. (2014). A comprehensive eco-efficiency model and dynamics of regional eco-efficiency in China. Journal of Cleaner Production, 67: 228-238. http://dx.doi.org/10.1016/j.jclepro.2013.12.003
[21] Yang, L., Ouyang, H., Fang, K., Ye, L., Zhang, J. (2015). Evaluation of regional environmental efficiencies in China based on super-efficiency-DEA. Ecological Indicators, 51: 13-19.
[22] Yu, K., Ying, J., Gong, R., Chang, Z. (2021). Preliminary discussion of agricultural cost effectiveness evaluation with drip irrigation. Ecological Indicators, 17(1): 251-263. http://dx.doi.org/10.1016/j.ecolind.2014.08.040
[23] Liu, J., Zhang, J., Fu, Z. (2017). Tourism eco-efficiency of Chinese coastal cities–Analysis based on the DEA-Tobit model. Ocean & Coastal Management, 148: 164-170. https://doi.org/10.1016/j.ocecoaman.2017.08.003
[24] Lu, T. (2021). A fuzzy network DEA approach to the selection of advanced manufacturing technology. Sustainability, 13(8): 4236. https://doi.org/10.3390/su13084236
[25] Liu, J., Yuan, C., Li, X. (2019). The environmental assessment on Chinese logistics enterprises based on non-radial DEA. Energies, 12(24): 4760. https://doi:10.3390/en12244760
[26] Theodoridis, A., Hasanov, S., Abruev, A. (2014). Efficiency and productivity change analysis of cotton production in Uzbekistan. Outlook on Agriculture, 43(4): 259-263. http://dx.doi.org/10.5367/oa.2014.0186
[27] Zhong, S. (2019). Empirical analysis on function mechanism of factors affecting the efficiency of China’s agricultural products logistics. Journal Européen des Systèmes Automatisés, 52(2): 129-135. http://dx.doi.org/10.18280/jesa.520203
[28] Wang, X., Zhang, X., Katina, P. (2021). Study on sugarcane production efficiency based on DEA-Malmquist index: A case study of 8 cities in Guangdong Province. Discrete Dynamics in Nature and Society. http://dx.doi.org/10.1155/2021/7957040
[29] Wang, C.N., Nguyen, N.A.T., Fu, H.P., Hsu, H.P., Dang, T.T. (2021). Efficiency assessment of seaport terminal operators using DEA Malmquist and Epsilon-Based Measure Models. Axioms, 10(2): 48. https://doi.org/10.3390/axioms10020048
[30] Mokhtar, K. (2013). Technical efficiency of container terminal operations: A DEA approach. Journal of Operations and Supply Chain Management (JOSCM), 6(2): 1-19.
[31] Chen, J., Wan, Z., Zhang, F., Park, N.K., He, X., Yin, W. (2016). Operational efficiency evaluation of iron ore logistics at the ports of Bohai Bay in China: Based on the PCA-DEA Model. Mathematical Problems in Engineering, 2016. https://doi.org/10.1155/2016/9604819
[32] Yan, J. (2019). Spatiotemporal analysis for investment efficiency of China’s rural water conservancy based on DEA model and Malmquist productivity index model. Sustainable Computing: Informatics and Systems, 21: 56-71. https://doi.org/10.1016/j.suscom.2018.11.004
[33] Lozano, S., Adenso-Diaz, B. (2021). A DEA approach for merging dairy farms. Agricultural Economics, 67(6): 209-219. https://doi.org/10.17221/418/2020-AGRICECON
[34] Marzec, J., Pisulewski, A. (2021). Measurement of technical efficiency in the case of heterogeneity of technologies used between firms–based on evidence from Polish crop farms. Agricultural Economics, 67(4): 152-161. https://doi.org/10.17221/347/2020-AGRICECON
[35] Li, Y., Lei, X., Dai, Q., Liang, L. (2015). Performance evaluation of participating nations at the 2012 London Summer Olympics by a two-stage data envelopment analysis. European Journal of Operational Research, 243(3): 964-973. http://dx.doi.org/10.1016/j.ejor.2014.12.032
[36] Wu, J., Chu, J., Sun, J., Zhu, Q. (2016). DEA cross-efficiency evaluation based on Pareto improvement. European Journal of Operational Research, 248(2): 571-579. http://dx.doi.org/10.1016/j.ejor.2015.07.042
[37] Khoshroo, A., Izadikhah, M., Emrouznejad, A. (2018). Improving energy efficiency considering reduction of CO2 emission of turnip production: A novel data envelopment analysis model with undesirable output approach. Journal of Cleaner Production, 187: 605-615. http://dx.doi.org/10.1016/j.jclepro.2018.03.232
[38] Nassiri, S.M., Singh, S. (2009). Study on energy use efficiency for paddy crop using data envelopment analysis (DEA) technique. Applied Energy, 86(7-8): 1320-1325. http://dx.doi.org/10.1016/j.apenergy.2008.10.007
[39] Zhou, Z., Chen, S., Xu, F., Jiang, H., Xiao, Y. (2014). Study on TFP of grain in Poyang lake ecological economic zone on DEA. Mathematical Modelling of Engineering Problems, 1(2): 1-6. http://dx.doi.org/10.18280/mmep.010201
[40] Pagotto, M., Halog, A. (2016). Towards a circular economy in Australian agri-food industry an application of input-output oriented approaches for analyzing resource efficiency and competitiveness potential. Journal of Industrial Ecology, 20(5): 1176-1186. http://dx.doi.org/10.1111/jiec.12373
[41] Omid, M., Ghojabeige, F., Delshad, M., Ahmadi, H. (2011). Energy use pattern and benchmarking of selected greenhouses in Iran using data envelopment analysis. Energy Conversion and Management, 52(1): 153-162. http://dx.doi.org/10.1016/j.enconman.2010.06.054
[42] Yang, Z., Wang, D., Du, T., Zhang, A., Zhou, Y. (2018). Total-Factor energy efficiency in China’s agricultural sector: Trends, disparities and potentials. Energies, 11(4): 853. http://dx.doi.org/10.3390/en11040853
[43] Wang, R., Kong, D. (2014). Construction of an evaluation model for the efficiency of agricultural products distribution in China and its application. Journal of Liaoning University. Philosophy and Social Science Edition, 42: 64-73.
[44] Xu, D., Zhang, J., Rasul, G., Liu, S., Xie, F., Cao, M., Liu, E. (2015). Household livelihood strategies and dependence on agriculture in the mountainous settlements in the three gorges reservoir area, China. Sustainability, 7(5): 4850-4869. http://dx.doi.org/10.3390/su7054850