Alexis Cordovés García* | Carlos A. Pérez Alban | Jorge R. Terán Benalcázar | Alexis Cordovés Rodríguez | Leandro L. Lorente-Leyva | Arlys M. Lastre Aleaga
© 2021 IIETA. This article is published by IIETA and is licensed under the CC BY 4.0 license (http://creativecommons.org/licenses/by/4.0/).
OPEN ACCESS
The goal of this paper is to obtain an automated system for the control of the quality of the combustion gases of a boiler. The concentration of oxygen present in the combustion gases is detected by means of a lambda sensor, and a proportional PID controller automatically regulates, through an actuator, the air inlet to the boiler, thus ensuring the emission of CO2 and other polluting gases into the atmosphere within the parameters established by the current environmental regulations. The control system has an HMI display and a modular PLC. The results achieved also ensure the reduction of fuel consumption of the boiler.
steam boiler, lambda sensor, HMI display, programmable logic control
Environmental pollution is a matter of great concern to governments and environmental organizations. Many countries do not have the technology to monitor pollution from different sources. The most frequent pollutants are: CO, SO2, NOX, CO2 and PM2.5 [1-5].
The World Health Organization (WHO) places the PM2.5 particle health threshold at an annual average of 25 μg/mᵌ, according to the WHO (Global Ambient Air Quality Database, update 2018), 97% of cities in low-income areas and Middle-income countries with more than 100,000 inhabitants do not meet WHO air quality guidelines. In high-income countries, that percentage drops to 49% (World Health Organization 2020). The WHO estimates that about 7 million people die each year from strokes, heart disease and chronic obstructive lung diseases and respiratory infections, including pneumonia and lung cancer, from exposure to fine particles in polluted air [6]. Cities such as New Delhi, Pakistan, and Beijing have average annual PM 2.5 values greater than 100 μg/m [7].
According to Shan, Liu and Guan [7], China is the world's leading consumer of energy and a CO2 emitter, accounting for approximately 30% of global emissions [8-10]. In the USA and Europe, coal burning was responsible for 40% of fossil fuel emissions in 2018, followed by oil (34%) and natural gas (20%) [5, 11]. Specifically, the oil emissions have increased in the last decade at a rate of 1.4% per year [12], within this group, are emissions from diesel fuel boilers.
There are three main sources of air pollution from human activities: stationary, mobile, and indoor. Stationary sources are industries and power plants, motor vehicles are mobile sources, and interior sources are homes or houses. For the purposes of this investigation, stationary industrial-type sources, specifically steam boilers, are of interest.
Nowadays it is particularly important to increase the combustion efficiency in steam boilers, to reduce fuel consumption and emissions of harmful substances, which is generally associated with actions to achieve an efficient operation of the boiler, which allows combustion full of fuel [13]. By achieving the required quality of the fuel-air mixture in the boilers (stoichiometric mixture), the negative impact of the combustion gases is reduced [14-16].
The combustion quality control methods differ in the actuation of the regulation of the air-fuel inlet and in the form of capture of the information on the composition of the mixture. According to Zaporozhets [13], Kaya and Eyidogan [17] one of the most used is the measurement correction of the chosen parameter (O2, CO2, CO). In the present investigation, the measurement of the parameter O2, frequently used at the industrial level.
The use of Man-Machine Interface (HMI) systems coupled with a Programmable Logic Control (PLC) is increasing, and they play a fundamental role in truly slender automation solutions [18-20]. Thanks to their potential, they are used in control systems of various variables in boilers such as pressure, temperature and, of course, the concentration of gaseous pollutants from combustion.
The basic structure of an HMI-PLC control system includes sensors, actuators, operator interface and logic control devices [21]. The sensors measure the physical variables, such as temperature, flow and pressure and convert the information into electrical signal. The actuator transfers the information to the HMI. The general machine operation is controlled by the logic device, which examines the inputs made by the operator and the sensor and sends signals to the actuator device. This model applies to discrete and continuous processes.
The aim of the present article is to obtain a combustion gases quality control system in boilers, with HMI / PLC interface, to ensure adequate air-fuel ratio during preparation of the mixture and rational use of fuel.
To create an automated system that controls the quality of polluting gases in boilers, the following procedure is suggested:
Procedure for the creation of the control system:
The following main elements of combustion control were used, a DELTA brand HMI display, touch screen with graphic display, a Twido TWLMDA20DRT modular PLC which will be in charge of actuating the actuator to control the oxygen input depending on the value of the reading made by the lambda probe.
The content of each stage of the procedure will be explained below.
2.1 Determination of the process variable according to the chosen control method
Of the existing methods for the control of the combustion gases quality, in the present investigation the method by measurement correction was applied, selecting the concentration of O2 as a process variable. The fuel used was diesel.
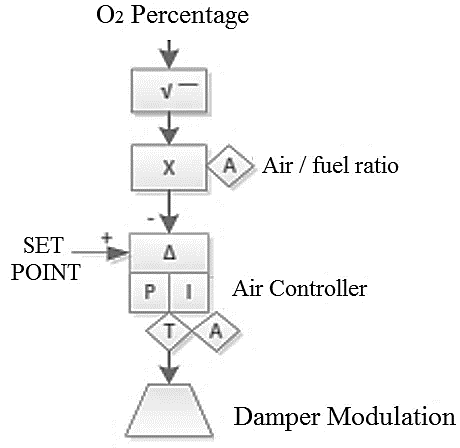
The proposed system operates based on the control loop shown in Figure 1, whereby the measurement of O2 present in the combustion gases is performed to determine whether stoichiometry in the air / fuel mixture is met. To do this, the "SET POINT" value of the O2 percentage is adjusted to the recommended range (3.7-5) for diesel. If the stoichiometric ratio is not met, the controller modulates the air inlet to obtain the value "FIXED".
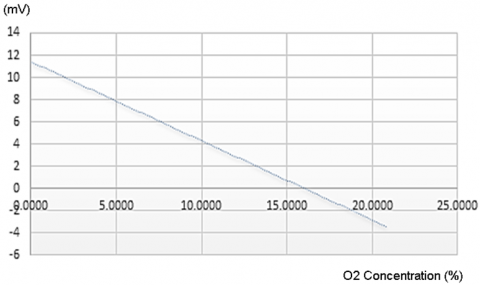
To measure the O2 concentration a lambda sensor was used, it was necessary to find the function that relates the voltage emitted by the sensor from the measured O2 percentage. To do this, the percentage of O2 under conditions (TPN) was varied in a closed environment, which was recorded on a Brain-Bee brand gas analyzer and tabulated the average voltage emitted by the lambda sensor as a function of the value of O2 concentration when applying the comparative calibration method.
Figure 1. Basic structure of the control loop for the system
Figure 2. Voltage (mV) curve vs. O2 concentration (%)
Thus, it was determined that the lambda sensor emits a value of -3.4mV at a concentration of 20.8% O2 (diatomic oxygen) and varies, up to a value of 10 mV which equates to a concentration of 2% O2 (see Figure 2).
The Figure 2 shows that the lambda sensor voltage values versus oxygen concentration correspond to the equation of the straight line.
2.2 Signal conditioning
The lambda sensor emits a small voltage signal and needs to condition the signal with a gain of at least 100 times its initial value. A signal with wide voltage ranges, allows a higher measurement resolution. The output voltage of the amplifier is determined by Eq. (1).
Vout $=\operatorname{Vin}\left(1+\frac{R 2}{R 1}\right)$ (1)
where, the gain is:
$1+\frac{R 2}{R 1}$ and is represented by the letter A.
The resistance value R2 for a gain A = 100 and a value of $\mathrm{R}_{1}=1 \mathrm{k} \Omega$ is:
$100=1+\frac{R 2}{R 1}$
$R 2=90 k \Omega$
The amplified signal 100 times shows values from -340mV to 1000mV. These values cannot yet be read by any instrumentation indicator and a circuit must be designed to standardize or condition the signal and obtain values ranging from 0 to 10 volts. The equation of the amplified signal is naturally that of a straight line also and corresponds to Eq. (2).
$y=m x+b$ (2)
The slope of the straight line is determined as follows, Eq. (3):
$y-b=m x$
$y-y 1=m(x-x 1)$ (3)
To condition the signal, a standardization curve must be plotted to convert the voltage value or current from a wide range to standard values, which can be, for this case, a current of 4-20mA or a voltage 0-10V. Figure 3 shows the standardization curve of an electrical voltage signal.
Figure 3. Standardization of a voltage (mV) signal
Developing Eq. (3) gives the equation of standardization of the signal.
$\frac{y-y 1}{x-x 1}=m$
$\frac{y-y 1}{x-x 1}=\frac{y 2-y 1}{x 2-x 1}$ (4)
Eq. (4) is an equality of the sensor straight line slope, which determines the value of the normalized voltage as a function of that emitted by the sensor lambda. The values of x1 and x2 correspond to -340mV and 1000mV respectively and the values of y1 and y2 are the standard values of 0V to 10V. Substituting these values into Eq. (4) has:
$y=7.462 x+2.54$ (5)
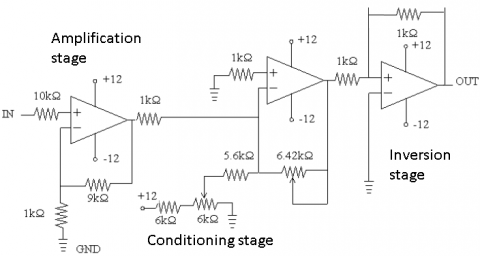
The equation defining the signal conditioner corresponds to Eq. (5) and is structured with a non-inverting gain amplifier A = 7.462 and an adder that is adjusted with a potentiometer to add a value of 2.54 V. The complete conditioning circuit is shown in Figure 4 with its three stages: Amplification, Conditioning and signal Inversion.
Figure 4. Full signal conditioner
The result obtained with the use of amplifiers for the signal conditioner, is of negative sign and to correct it and to take it to positive, the inverting amplifier of A = 1 is used.
$7.462=1+\frac{R 2}{R 1}$
For R1=1k Ω the value of R2 will be:
$R 2=6.462 \mathrm{k} \Omega$
2.3 Programming the PLC to obtain the value of the process variable
From Figure 2 we have that the voltage values oscillate from (y1 = -3.4mV to y2 = 11.4mV) and the value of O2 from (x1 = 0 to x2 = 20.8%), which is the concentration of diatomic oxygen. The slope of the curve for this case is decreasing and its value is determined as follows:
$m=\frac{y 2-y 1}{x 2-x 1}$
$m=\frac{11.4-(-3.4)}{20.8-0}$
$m=-0.711$
To determine the percentage of O2, in the equation of the straight line the variable x is cleared. The value of b is the intersection on the axis of the ordinates, equal to 11.4 V.
$x=\frac{y-b}{m}$
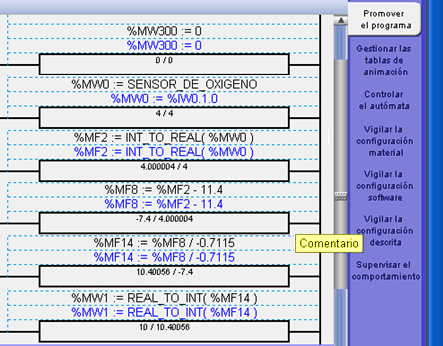
The Figure 5 shows the percentage of oxygen as a function of the lambda sensor voltage by operating blocks in Twido Suite.
To determine the value of O2 as a function of the lambda sensor voltage and to enter it into the PLC operating blocks, the voltage value (y) and the intersection (b) are subtracted, and divided by the slope (m).
Figure 5. Percentage of oxygen according to voltage of lambda sensor in operation blocks in Twido Suite
2.4 Determination of the percentage of the polluting gases from the value of the process variable
According to Jecht [22], the percentage of CO2 from O2 is determined by the expression:
$C O_{2}=\frac{\operatorname{CO} 2 \max \times(21-02)}{21}$ (6)
where,
CO2 max: Maximum specific value of CO2 (15.4%).
The value 21: Percentage of oxygen in air.
O2: Percentage of oxygen measured.
Guzmán determined [23], the relationship between % O2 and % CO2 is shown, (see Table 1).
Table 1. Relationship between % O2 and % CO2
|
Gases |
Percentages |
|||||||
|
O2 |
1 |
2 |
3 |
4 |
5 |
6 |
7 |
8 |
|
CO2 |
14.7 |
14.0 |
13.3 |
12.5 |
12.0 |
11.5 |
10.4 |
9.6 |
|
O2 |
9 |
10 |
11 |
12 |
13 |
14 |
15 |
|
|
CO2 |
8.8 |
8.1 |
7.4 |
6.6 |
5.9 |
5.2 |
4.4 |
|
2.5 Implementation of PID proportional control
A servomotor adapted to the damper controls the entrance of air to the combustion chamber. The PID loop calculates the difference between the actual variable and the desired variable, as shown in Figure 6.
Figure 6. Block diagram of a process with a feedback controller
The system of Figure 6 has two main components, the process and the controller. The process has an input that is the manipulated variable called control variable and is denoted by the letter u. The control variable influences the process via actuator, which is usually a valve or motor. The output of the process is called the process variable (PV) and is represented by the letter y. This variable is measured with a lambda sensor. The actuator and sensor are considered part of the block labeled "Process". The desired value of the process variable is called the setpoint (SP) or reference value. It is denoted by Ysp. The control error e is the difference between the setpoint and the process variable (see Eq. (7)).
$e=Y s p-y$ (7)
For the application developed:
Ysp = Setpoint 4.35% oxygen (Mean value in the range 3.7 - 5).
U = Control variable (0 - 5 V servomotor).
Y = Process variable (Percentage of oxygen in combustion gases).
The implementation of a PID control, allows the automatic regulation of the air intake according to the percentage of O2 measured. If the O2 concentration exceeds the value of Ysp, the servomotor will decrease the air intake until the measured value stabilizes, otherwise the oxygen concentration is low, the servomotor will open the air passage.
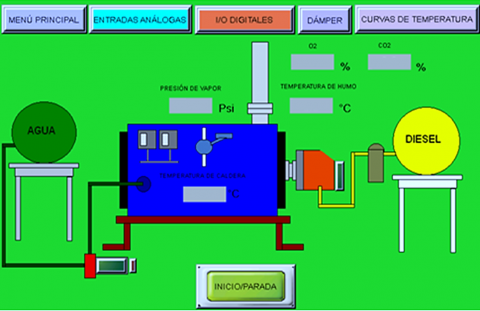
Figure 7. Monitoring submenu
The Figure 7 shows the monitoring submenu of the main parameters of the boiler when it is in operation. From it you can directly access the other screens that are part of this control system such as: main menu, analog inputs, digital I/O, damper and behavior curves of different parameters.
3.1 Case study of the control of the quality of the combustion gases of a boiler of 5 BHP
The developed combustion control system was implemented in a boiler of 5 BHP with a diameter of the chimney of 10 cm. The results of the readings were compared with those obtained using a Testo gas analyzer, model 350XL, from the company CORPLAB, certified for studies of composition of combustion gases.
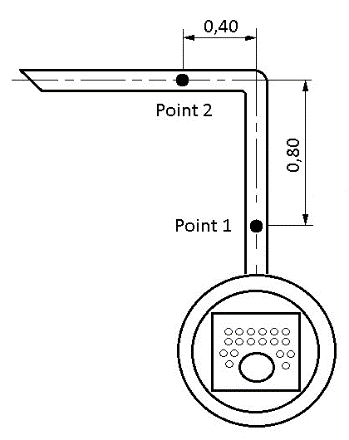
According to the Unified Text of the Secondary Environmental Legislation (TULAS) [24], two sample points are used for boilers with a diameter of less than 3 m, which are located at a distance of at least eight downstream chimney diameters and two Chimney diameters upstream of a disturbance in the direction of the normal flow of combustion gases. Thus, point 1 was located 0.80 m from the Elbow of 90° (see Figure 8) in the counter flow direction and point 2 0.40 m upstream of the disturbance in the direction of normal flow of combustion gases, in which the existence of a laminar flow of the fluid is assumed and in a position far enough from the end of the chimney to avoid the influence, in the readings, of the oxygen present in the atmosphere.
Figure 8. Location of the lambda sensor in the chimney
The protocol of the analysis of gases in fixed sources applied by the company CORPLAB, establishes the taking of three measurements in each point of interest in conditions of operation of the boiler, the value average of the measurements made at each point is shown in Table 2. The value of the O2 percentage at both points was similarly slightly higher at point 2, for this reason finally the value of 10.8% O2 corresponding to point 2 was taken to be compared later with the developed control system.
Table 2. Concentration of O2 measured in two points with the Testo gas analyzer
|
Point |
Partial Value 1 |
Partial Value 2 |
Partial Value 3 |
Average value O2 TESTO |
|
1 |
10.4 |
10.8 |
10.5 |
10.6 |
|
2 |
10.6 |
11.1 |
10.7 |
10.8 |
Table 3. Percentage of O2 measured both systems
|
Point |
Measured value % O2 |
Measured value TESTO % O2 |
Difference % |
Observation |
|
2 |
10.48 |
10.8 |
0,32 |
* |
* Tolerable range 1.3% (included between the recommended values of 3.7 and 5% of O2)
For the same conditions in which measurements were made with the Testo model 350XL, from the company CORPLAB at point 2, the average value of the readings was determined with the control system developed. The results are shown in Table 3.
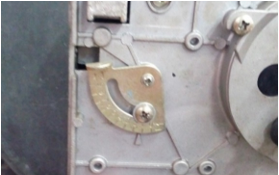
With the boiler in full operation, the air supply damper was adjusted to the position in which it was verified that the boiler was operating within the range of 3.7 to 5% of the oxygen concentration. Damper adjustment is shown in Figure 9.
The values obtained in the measurements made in point 2 for the new position of the damper with the system in full operation are shown in Table 4.
Figure 9. Adjusted position of the air supply damper
If there is a decompensation in the oxygen concentration measured by the control system, caused by the deregulation of the damper, that is to say that the captured values are outside the established limits 3.7% - 5%, the system by proportional control PID, compensates for the missing or excess oxygen value within the combustion chamber by opening or closing the air intake damper as appropriate, so that the control system is always measuring within the allowable range.
Table 4. Percentage of O2 measured at sampling point 2 with the control system implemented
|
Point |
Partial Value 1 |
Partial Value 2 |
Partial Value 3 |
Average Value O2 |
Observation |
|
2 |
4.6 |
5.1 |
4.7 |
4.8 |
Normal values |
Considering, as a reference value, the readings made with the Testo 350XL gas analyzer in the present investigation. The difference in the percentage readings of O2 at point 2, measured with the lambda probe with respect to its reference value, does not exceed 0.32% (see Table 3), less than the magnitude of the tolerable value 1.3% corresponding to the range of 3.7 and 5% O2 in diesel fuel to achieve a stoichiometric mixture composition. This result corroborates the ability of the developed control system to read the percentage of O2 present in the combustion gases during the operation of the boiler.
The percentage of O2 recorded in point 2 was slightly higher than the value measured in point 1. This behavior responds to the increase in oxygen concentration in the combustion gases as they approach the end of the chimney and come into contact with environment.
The values obtained for the O2 concentration initially at point 2, close to 10%, both with the Testo equipment and with the implemented control system (see Table 3), corroborate the decalibration of the boiler five years after commissioning. However, to establish the parallelism between the measurements made by CORPLAB and those made with the implemented control system, it was necessary to maintain the same air inlet conditions (gate graduation), despite knowing that the values obtained were outside the allowable range for diesel fuel combustion.
The average value of the O2 measurements made in point 2, using the developed control system (See Table 4), is within the recommended O2 concentration range for diesel combustion gases. This ensures the required quality of the mixture with a better use of the heat capacity of the fuel, the reduction of the boiler operating time and a lower fuel consumption.
The automatic control of the air / fuel ratio during the operation of the boiler contributes to ensuring the required quality of the combustion gases in an unattended way, with a favorable implication in the protection of the environment and a better use of labor.
The developed control system can be applied not only to stationary combustion sources, it can also be coupled to other systems that use combustion to produce calorific value. The procedure followed and the results obtained in the present investigation can serve as a methodological guide for the installation of combustion gas control systems using HMI and PLC screens in similar processes.
As conclusions of the present investigation, the following stand out:
[1] Ministry of the Environment. (2007). Standard for air emissions from fixed sources of combustion. Quito: Pub. Min. Amb. http://www.cip.org.ec/attachments/article/1357/NORMA%20EMISIONES.pdf.
[2] Hong, R.K., Shen, Y.L., Zhao, Z.F. (2012). Emission characteristics of CO and NOx from opposed firing boiler in a 600 MW supercritical unit. Journal of Chinese Society of Power Engineering, 32(12): 922-927.
[3] Yang, Z., Dong, W., Xiu, J., Dai, R., Chou, J. (2015). Structural path analysis of fossil fuel based CO2 emissions: A case study for China. PloS One, 10: 1-25. https://doi.org/10.1371/journal.pone.0135727
[4] Krzywanski, J., Nowak, W. (2016). Artificial intelligence treatment of SO2 emissions from CFBC in air and oxygen-enriched conditions. Journal of Energy Engineering, 142(1): 04015017. https://doi.org/10.1061/(ASCE)EY.1943-7897.0000280
[5] Sheng, L.Y., Cao, Y., Hou, J.J., Zhang, J.T., Yang, Y.O., Liu, L.C. (2020). Identifying common paths of CO2 and air pollutants emissions in China. Journal of Cleaner Production, 256: 120599. https://doi.org/10.1016/j.jclepro.2020.120599
[6] World Health Organization. (2020). Recovered in O2 February 2020. https://www.who.int/airpollution/data/cities/en/.
[7] García, J.M. (2015). Most Polluted Countries and Cities in the World. Recovered in December 2019 from: http://www.lavanguardia.com/vangdata/20151203/30568527096/ciudades-contaminadas-mundo.html.
[8] Shan, Y., Liu, Z., Guan, D. (2016). CO2 emissions from China’s lime industry. Applied Energy, 166: 245-252. https://doi.org/10.1016/j.apenergy.2015.04.091
[9] Li, Z., Wang, Y., Hu, Y., Chen, L., Zhu, H. (2019). Emissions of NOx, PM, SO2, and VOCs from coal-fired boilers related to coal washing, iron-steel production, and lime and gypsum making in Shanxi, China. Aerosol and Air Quality Research, 19(9): 2056-2069. https://doi.org/10.4209/aaqr.2019.07.0363
[10] Shan, Y., Huang, Q., Guan, D., Hubacek, K. (2020). China CO2 emission accounts 2016–2017. Scientific Data, 7(1): 1-9. https://doi.org/10.1038/s41597-020-0393-y
[11] EIA. (2019). Independent statistics and Analiysis U.S. Energy Information Administration. https://www.eia.gov/.
[12] Cerrillo, A. (2019). Las emisiones mundiales de los combustibles fósiles son un 60% superiores a las de 1990. La Vanguardia. Last updated: 04/12/2019. Recovered in january 2020 from: https://www.lavanguardia.com/natural/cambio-climatico/20191204/472038796221/cumbre-del-clima-cop25-carbon-proyect.html.
[13] Zaporozhets, A. (2019). Analysis of control system of fuel combustion in boilers with oxygen sensor. Periódica Polytechnica Mechanical Engineering, 63(4): 241-248. https://doi.org/10.3311/PPme.12572
[14] Kojan, A. L. (2000). Boiler Operator's Guide. Mc Graw-Hill, ISBN-13: 978-0070365742.
[15] Zaporozhets, A.O. (2020). Methods and means for the control of the fuel combustion process. In Control of Fuel Combustion in Boilers, pp. 1-33. https://doi.org/10.1007/978-3-030-46299-4_1
[16] Lukáč, L., Kizek, J., Jablonský, G., Karakash, Y. (2019). Defining the mathematical dependencies of NOx and CO emission generation after biomass combustion in low-power boiler. Civil and Environmental Engineering Reports, 29(3): 153-163. https://doi.org/10.2478/ceer-2019-0031
[17] Kaya, D., Eyidogan, M. (2010). Energy conservation opportunities in an industrial boiler system. Journal Energy Engineering, 136: 18-25. https://doi.org/10.1061/(ASCE)0733-9402(2010)136:1(18)
[18] Chanamé Torres, C.A. (2018). Diseño de la Reingeniería para Automatizar el Proceso de Generación de Vapor de la Caldera APIN en la Empresa Agroindustrial Pomalca SAA. https://repositorio.unprg.edu.pe/handle/20.500.12893/2041.
[19] Motta, L.A., González, J.D., Bernal, E. (2019). Implementación de un sistema de comunicación por líneas de potencia (PLC) para su uso en redes inteligentes de distribución. Universidad de Lasalle. https://ciencia.lasalle.edu.co/ing_electrica/275.
[20] Siriwardena, M.B.D.K., Subasinghe, N.T.S., Sankalpa, V. (2020). Boiler operation and process control in sri Lankan industries. Journal of Research Technology and Engineering, 1(3): 109-114.
[21] Pulley Muñoz, I.A., Flores Heras, J.E. (2019). Automatización del proceso de generación de vapor mediante un plc y una hmi para el departamento de esterilización del hospital León Becerra de Guayaquil (Bachelor's thesis). https://dspace.ups.edu.ec/handle/123456789/17918
[22] Testo, A.G. (2003). Análisis de gases de combustión en la industria: guía práctica para medir emisiones y procesos. Testo. https://www.testo.com/es-ES/promociones/testo-350-chp-registro-guia.
[23] Guzmán, J.M. (2015). Control of the combustion and determination of the efficiency of boilers by practical methods. Recovered 30 Jul 2015 http://www.cubasolar.cu/biblioteca/Ecosolar/Ecosolar30/HTML/articulo06.htm.
[24] Ministery of the Environment. (2012). Unified Text of Secondary Environmental Legislation (TULAS). Ecuador.