Fethi Boussadia* | Saad Belkhiat
© 2021 IIETA. This article is published by IIETA and is licensed under the CC BY 4.0 license (http://creativecommons.org/licenses/by/4.0/).
OPEN ACCESS
This paper proposes a new adaptive underfrequency load shedding scheme (UFLS) to avoid frequency instability in electrical power system during abnormal wide area disturbances. The developed scheme is based on online monitoring of the distance relay zone 3 decisions of some tie lines using (WAMS) and SCADA/EMS systems, to check rapidly and reliably the uncontrolled islanding conditions and, permit an automatic load shedding action to maintain frequency stability of power system. Simulation results on 400 kV Turkish transmission systems demonstrated the effectiveness of the proposed scheme compared to current frequency load shedding schemes which they cannot consider all possible circumstances because of their limited access to the power network data. Simulation results clearly indicate that large disturbances in power systems can be avoided and their propagation can also be stopped using the proposed scheme.
frequency control, load shedding scheme, real time measurement, generation shedding, emergency conditions
During later decades, many major blackouts have been experienced in different countries of the world. On July 31, 2012, the most severe blackout in history of the word was occurred in Indian Electricity Grids. This blackout affected more than 620 million people and about 1.4 GW power was lost. During the system disturbance the Indian power system was separated into three areas (Northern-Eastern, Eastern and Western areas). The enormous unbalance between load and supply in each area caused a significant frequency deviate. This situation led to a total power system blackout in around 20s [1]. On September, 28th, 2003, the tripping of some heavily loaded 400 kV transmission lines at the corridor between Italy and its neighboring systems, led to the disconnection of the Italian power system from the UCTE power system. This separation caused a loss of 6651 MW power import and the frequency rapidly dropped. The operation of the primary frequency control and UFLS scheme could not stop the frequency decrease. Finally, the frequency dropped further and caused a total blackout [2, 3]. Also, In Turkey on March 31, 2015 a cascading failure of some tie lines caused interruption of all customers connected to the network of the country with a total of 33450 MW lost [4]. During the system disturbance the Eastern and Western Turkish subsystems were separated. The huge imbalance of about 4700 MW that have experienced the Eastern and Western subsystem caused the collapse of the Network in around 10 sec. Indeed, the causes of the instability incidents mentioned above are multiple and one of them is directly related to the inability of load shedding scheme to bring the frequency back to a safer level in the formed islands after the system split [5]. In fact, UFLS scheme being used to mitigate a rapid decrease in frequency due to unbalance between production and consumption in power system [6]. However, current UFLS schemes used by most energy utilities around the world are based on static models in which the thresholds and the load to be shed are based only on frequency measurements [7]. So, the amounts of load that be shed by these schemes are fixe irrespective of the magnitude of disturbance [8]. This may lead to under-shedding and over shedding problems and can further deteriorate the frequency stability of the electrical network [9-11].
In order to improve the operation of these conventional UFLS schemes during instability conditions, different techniques are proposed in the literature. UFLS Schemes based on the measurement of the rate of the frequency change (df / dt) have been designed to avoid the drawbacks of UFLS scheme which was based only on frequency amplitude measurements [12, 13]. Thus, the power deficit is calculated immediately after the disturbance and the load to be shed will be optimized according to variations of electrical system parameters as well as the dynamics of the disturbance. However, during various transient events the measurements of the frequency and its derivative can present large errors due to rapid variation of the conditions of the electrical network. In this case, the UFLS could not shed accurate amount of load and the power deficit estimation will be affected [14, 15]. The use of a hybrid load shedding scheme which takes into account both frequency and voltage variations has been studied in reference [16]. So, this scheme allowed shedding appropriate amount of load using both voltage and frequency load shedding relays. Different artificial intelligence-based schemes have been also employed to accurately estimate the power deficit during frequency instability conditions [17-21]. Centralized load shedding schemes have been suggested to execute a global load shedding decision using modern communication devices as reported in the references [22-24]. However, in practice, the lack of information about the amount of load that has been shed by frequency load shedding relays would greatly affect the reliability of these schemes. The mentioned weakness can be overcome by the use of new schemes that based on Wide Area Measurement System (WAMS). Thus, the power imbalance is measured in real time using phasor measurement units (PMUs) [25-29]. This allows also shedding the correct amount of load and hence stabilizes the balance between generation and load in power system. Another new adaptive load shedding scheme based wide area measurements is carried out in Duong et al. [30]. In this work the load to be shed is evaluated based on three parameters, network structure, location and the amount of the power deficit in each under frequency area of power system.
It should be noted that all the techniques used by the load shedding schemes mentioned above have the same common principle which consists in shedding a certain load in order to restore the frequency to an acceptable level during instability conditions. However, under some frequency instability conditions such as observed during the aforementioned incidents, the application of underfrequency load shedding schemes was unable to improve frequency stability of the electric power system. Despite the total amount of charge, which was shed by the UFLS scheme during these incidents, was greater than the initial power deficit, but this could not arrest the rapid frequency drop and the frequency instability could not be avoided. In order to improve the operation of load shedding schemes in such situations, a new adaptive UFLS scheme based real time measurements from WAMS and SCADA/EMS system is proposed. Effectiveness of proposed scheme is validated by dynamic simulation on applied 400 kV Turkish electrical network. Details of the proposed scheme are given in the ensuing sections.
2.1 Basic principle of automatic underfrequency load shedding
Automatic underfrequency load shedding scheme is used as tool to mitigate the frequency drop caused by particular system disturbances. The load-shedding is carried out by an under-frequency relay, which sends trip commands to disconnect part of the load in distribution stations (Figure 1) [31]. The tripping actions are performed in several stages and each stage has its own setting frequency and the load to be shed. The values of the frequency setting and the load to be shed for each stage are determined off line, basing on the experiences and the simulations [32].
Figure 1. Under frequency load shedding scheme
The total amount of load to be shed (LD) can be calculated by Eq. (1) [3].
$L D=\frac{\frac{L}{L+1}-d\left(1-\frac{f_{\min }}{f_{n}}\right)}{1-d\left(1-\frac{f_{\min }}{f_{n}}\right)}$ (1)
where, d is the load reduction factor, fmin and fn are respectively the minimum and nominal frequencies allowed. L is the amount of anticipated load (L).4.
The anticipated load L is expressed by Eq. (2) [9].
$L=\frac{Tota{{l}^{{}}}loa{{d}_{{}}}{{-}_{{}}}Tota{{l}_{{}}}generation}{Tota{{l}_{{}}}generation}$ (2)
2.2 Settings of load shedding scheme in Turkish power system
Table 1. Total amount of load shed by UFLS scheme in Turkish power system [4]
|
Region |
Total design Value in (MW) |
Total design value in (%) |
|
|
West Island
|
Thrace |
1706.6 |
5.2% |
|
Northwest Anatolia |
2027.9 |
6.2 |
|
|
West Anatolia |
1891.3 |
5.8 |
|
|
Southwest Mediterranean |
666.5 |
2.0 |
|
|
Middle Anatolia |
1427.6 |
4.4 |
|
|
Total |
7719.9 |
23.5 |
|
|
East Island |
Middle Anatolia |
336.6 |
1.0 |
|
Northeast Anatolia |
234.2 |
0.7 |
|
|
East Anatolia |
176.7 |
0.5 |
|
|
Southeast Anatolia |
1337.4 |
4.1 |
|
|
Southeast Mediterranean |
1846.3 |
5.6 |
|
|
Total |
3931.2 |
12 |
|
|
Total |
11651.1 |
35.5 |
|
Table 2. Settings of Load Shedding Scheme in Turkish power system
|
Stage |
Settings (Hz) |
Time (Sec) |
The amount of load shed (MW) |
|
|
East Area |
West Area |
|||
|
Stage 1 |
49 |
0.15 |
510.4 |
1430.8 |
|
Stage 2 |
48.8 |
0.15 |
1692.3 |
1514.3 |
|
Stage 3 |
48.6 |
0.15 |
1026.7 |
2270 |
|
Stage 4 |
48.4 |
0.15 |
1212.2 |
2319.8 |
In Turkish power system, the current UFLS scheme is adjusted to arrest the frequency before 48.4 Hz by disconnecting a maximum of 35% of the total amount of load, thus avoiding the activation of the under-frequency protection of the generating units, which are set below 47 Hz. Noting that, the total amount of load shed is divided between the two areas East and West (Table 1).
Typically, the frequency thresholds are in the interval from 49 to 48.4 Hz, the time delay is adjusted to 0.15 s and the number of stages is four (Table 2) [4]. The number of load shedding stages selected is usually related to the maximum load to be shed. The values of the frequency setting and the amount of load to be shed for each stage are determined off line, which are based on the experiences and the simulations. The amount of load shed on the initial stage is usually related to the size of the largest generator or the pick-up capacity of the interconnecting tie-lines. If the amount of load shed in the first stage is insufficient and the frequency continues to decay, the system frequency will reach the next set point and additional load shedding will be initiated. So, there is a minimum time delay required for each load shedding stage. This time delay is necessary to prevent unnecessary shedding of load during the frequency oscillations which can occur on the load bus.
Distance relays are widely used to protect high-voltage AC transmission lines against both phase fault and ground fault. The basic principle is based on local calculation of transmission line apparent impedance using the current and potential transformer. The apparent impedance so calculated is compared with the reach point impedance. If the measured impedance is less than impedance of the reach point, it is assumed that a fault exists on the line between the relay and the fault point.
Transmission lines may usually protect by three zones of protection (Figure 2). The setting of each zone varies according to the philosophy and criteria of each utility [33, 34]. For the Turkish power system [35], Zone 1 is defined to cover 80% of the line length AB and the relay functions without intentional time delay. Zone 2 covers the remaining 20% of the line length AB, as well as at least 20% of the shortest adjacent line BC. The time delay of zone 2 is set to t2 = 0.5 S. Zone 3 provides back up protection for faults in adjacent transmission lines in the case of the failure of the lines AB and BC protections at the remote substations. This zone is set to protect 100% of both lines AB and BC as well as 25% to 80% of the third CD line. This zone operates with a time delay of t3=1.5 s.
Figure 2. Schematic principle of distance relay protection
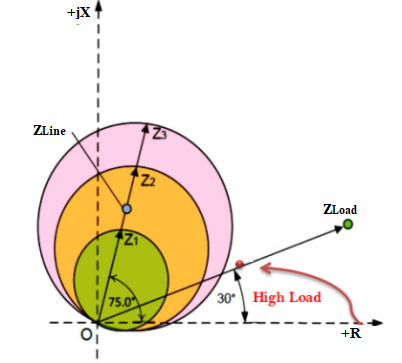
The calculated apparent impedance of the protected line and the impedance-reach of distance relay can be represented in a complex plane having resistance and reactance as coordinate axes known as distance relay tripping characteristic [33]. The tripping characteristics such as Mho, offset Mho, quadrilateral, and lenticular [36] are then used in order to compare impedance of the protected line and the set impedance. In Figure 3 is shown a plot of Mho tripping characteristic for three zones of distance relay.
Figure 3. Distance relay Mho tripping characteristic
4.1 Review of blackout in Turkey in March 2015
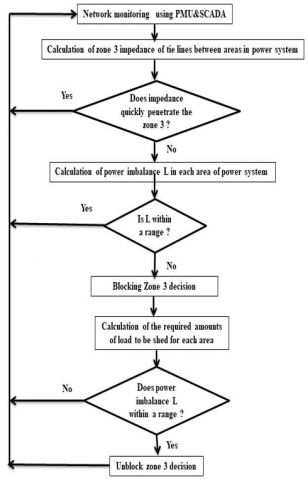
In this section, the recent blackout occurred in Turkey on March 31, 2015 is presented. Technical information about origin, evolution and consequences of this blackout are described in the ref. [4]. Here, only the relevant events related to the UFLS scheme are presented. The lessons deduced from this blackout constitute the basic of the proposed adaptive UFLS scheme. Initial event was the tripping of Osmanca-Kursunlu tie line by distance protection relay. The loss of this line has driven to the fast cascade tripping of all parallel tie lines (marked by numbers in Figure 4). As a result, the Eastern and Western subsystems have been completely disconnected. The power deficit in the western area increased rapidly and reached a rate of 23% compared to the pre-disturbance load. As consequence, the frequency decreased to 48.02 Hz. Thus, 10 sec were enough for the collapse of this subsystem. In the Eastern subsystem the power deficit reached a rate of 42% compared to the pre-disturbance load (11080 MW) and the frequency rose to 52.5 Hz. This subsystem also collapsed within a few seconds. This situation leads to widespread power system blackout. During this event, the total amount of load shed by UFLS scheme is given in Table 3.
Figure 4. Turkish transmission system map with sequence of the events
Table 3. Total amount of load shed
|
Region |
Real shed load in MW |
Real shed load in % |
|
|
West Island
|
Thrace |
1641 |
5.0% |
|
Northwest Anatolia |
1018 |
3.1 |
|
|
West Anatolia |
1059 |
3.2 |
|
|
Southwest Mediterranean |
516 |
1.6 |
|
|
Middle Anatolia |
583 |
1.8 |
|
|
Total |
4817 |
14.7 |
|
|
East Island |
Middle Anatolia |
204 |
0.6 |
|
Northeast Anatolia |
242.2 |
0.7 |
|
|
East Anatolia |
0 |
0 |
|
|
Southeast Anatolia |
683 |
2.1 |
|
|
Southeast Mediterranean |
1148.1 |
2.1 |
|
|
Total |
2277.3 |
6.9 |
|
|
Total |
7094.3 |
21.6 |
|
The current underfrequency load shedding scheme is designed to shed the amount of load of around 11651.1MW in order to keep the frequency stable with frequency ranges from 48.4 to 49 Hz. Indeed, as can be seen in Table 3 the UFLS scheme did not work properly during this blackout since the total amount of load that shed for both two areas were 7094.3 MW. This amount of load represents only a rate of 21.6% compared to the total reference load of UFLS scheme. The reason is that current UFLS scheme is designed to protect the system against small power deficiencies such as a generating unit outage or a sudden increase of load. But, during this event the resulting imbalances between the generation and the load of the formed islands after a system split reached exceptional values. As result, each island of the power system experienced severe frequency transients that induced the tripping of several generators across the power system. So, the available countermeasures could not stop the system frequency deviation in both two areas and the power system experienced a total blackout.
4.2 A new adaptive underfrequency load shedding scheme
To overcome the weaknesses of current UFLS schemes and improve their reliability, a new adaptive scheme based real time measurements from Wide Area Measurement System (WAMS) and SCADA/EMS system is proposed [37]. The amounts of load to be shed by proposed scheme are determined on the basis of the real-time measurements of the imbalance between load and generation in each area before uncontrolled system split. Usually, the maximum allowable imbalance in each area formed after the system split is in accordance with the appropriate actions used by the electric utility. In this work, an imbalance rate of 20% for each area was chosen as the maximum admissible imbalance [38].
Figure 5. Illustration of the new algorithm principle
Figure 5 illustrates the transmission system and application of the new algorithm.
The application of this new scheme requires:
-i) First the supervision of distance relay zone 3 decision of all tie lines between areas, to quickly check the uncontrolled islanding conditions. In accordance with time‐synchronized phasor measurements, zone 3 secondary impedance is calculated using the following equations [39]:
$Z_{seen}^{{}}=\frac{{{V}_{\operatorname{Re}lay}}}{{{I}_{\operatorname{Re}lay}}}={{K}_{Z}}.{{Z}_{3}}=\left( \frac{{{K}_{VT}}}{{{K}_{CT}}} \right).{{Z}_{3}}$ (3)
where:
${{K}_{VT}}=\frac{{{V}_{PRIMARY}}}{{{V}_{SECONDARY}}}$ (4)
${{K}_{CT}}=\frac{{{I}_{PRIMARY}}}{{{I}_{SECONDARY}}}$ (5)
KVT and KCT are respectively the ratios of the voltage and current transformers.
-ii) Then, the value of the balance between power generation and consumption for each area is measured from SCADA system. The measurements are obtained every 1-2 seconds. The calculations of these values are obtained from following equations [1]:
${{L}_{1}}=\frac{\sum{({{P}_{G1}}+{{P}_{G2}}+{{P}_{G3}})-\sum{({{P}_{L1}}+{{P}_{L2}}+P{{P}_{L3}})}}}{\sum{({{P}_{G1}}+{{P}_{G2}}+{{P}_{G3}})}}.$ (6)
${{L}_{2}}=\frac{\sum{({{P}_{G4}})-\sum{({{P}_{L4}}+{{P}_{L5}}+{{P}_{L6}}+{{P}_{L7}})}}}{\sum{({{P}_{G4}})}}.$ (7)
-The required amount of load to be shed for each area by proposed scheme is determined based on the following formulas:
${{L}_{Shed1}}={{L}_{Cal1}}-{{L}_{Critical}}$ (8)
${{L}_{Shed2}}={{L}_{Cal2}}-{{L}_{Critical}}$ (9)
where:
-LCritical is the maximum allowable imbalance in each area formed after the system split.
- LCal1 and LCal2 represent the balance between power generation and consumption for area 1 and area 2 respectively.
A flexible communication Network is used to send measured data to a central computer where secondary impedance, the balance generation/consumption and load to be shed are calculated.
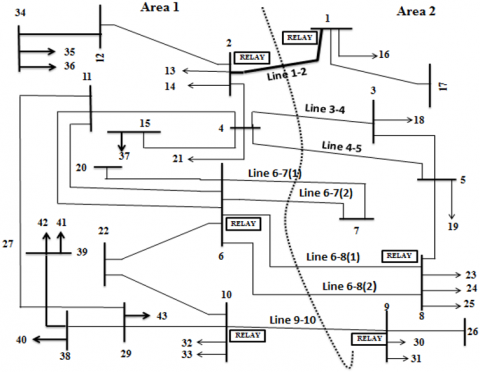
Figure 6 shows flowchart of proposed UFLS scheme.
Figure 6. Flowchart of proposed UFLS scheme
The principle of proposed scheme will now be described.
Once the measured impedance encroaches on the zone 3 tripping characteristic of any tie line, the algorithm must check the impedance locus to distinguish between a fault and stress condition by measuring the rate of change of voltage magnitude index dv/dt. So, if the trajectory speed of the impedance locus moves into the zone 3 tripping characteristic quickly (high ratio of dv/dt), this one is treated to be a fault, and the corresponding action is taken. However, if the progression of the impedance is slow (low ratio of dv/dt), the Network state is considered as to be a stress condition and the zone 3 distance relay decision must be blocked. In this case, the proposed scheme proceeds to the calculation of the imbalance between load and generation Lcal in each area of the Network. If the measured value Lcal in each area is within range (less than 20%), the activation of load shedding actions is not required. Otherwise, in the case if the power/load balance in areas is violated (Lcal greater than 20%), the required load to be shed will be calculated in real time by the proposed UFLS scheme and the trip commands will immediately send to shed loads at different substations. It is worth noting that by shedding some pretermitted amount of load, the reactive and active power flows transmitted from the exporting to importing area through tie lines will be reduced. Consequently, the trajectory of impedance will leave zone 3 tripping characteristic, and cascade tripping of tie lines by false operating of distance relay protection can be prevented. So, the uncontrolled system split scenario that led to total collapse or blackout can be avoided.
In order to verify the effectiveness of the proposed scheme, a real 400 kV, 50 Hz Turkish electrical transmission system is simulated in SICRE software package. SICRE is an integrated software tool for static and dynamic analyses of large power systems. SICRE package was developed by Centro Elettrotecnico Sperimentale Italiano company (CESI) in order to comply with a large variety of application domains [40-42]. Turkish electrical transmission system contains two main voltage levels 400 and 220 kV. During the simulation we use the same data that of Turkish power system on March 31, 2015. So, the total load of the system was about 33450. The Turkish power system had total generation of 32995 MW and import from Bulgaria of around 500 MW. The Western and Eastern subsystems have a load of 21870 MW and 11080 MW respectively. Before the disturbance, the power flow was about 4800 MW from Area 2 to Area 1. The exporting corridor is divided into eight 400 kV transmission lines and each end of transmission line is equipped by PMU unit. These lines are protected by distance relays [7, 43-45]. These latter are located at both ends of the tie lines. The parameters of these transmission lines and distance relays impedance zones are summarized in the appendix [39]. Mho characteristics were also considered in the simulation.
Figure 7. Single diagram of test system
The simulation procedures have been conducted for the two cases: current scheme UFLS and, that one of the proposed schemes.
5.1 Simulations using current UFLS scheme
Impact of the current UFLS scheme on the frequency stability during the blackout is investigated in this section. This scheme includes 4 stages whose actions are performed according to the settings in the Table 2. Figure 8 shows development of the system frequency during the blackout.
As can be seen from the results, despite the tripping of several transmission lines at the beginning of the incident, the synchronism between the both areas were not lost and the frequency remains stable. On the other hand, the complete disconnection of both two areas is registered after 10 seconds from the first event and the imbalance between generation and consumption in each area tends to increase. As a consequence, the frequency of area 1 dropped to 48.02 Hz and the frequency of area 2 roses to 52.5 Hz. Although the operation of the UFLS scheme in zone 1 temporarily stabilized the fall in frequency, but this was not enough to bring the frequency back to a safer level. The reason is that after the loss of a 4800 MW electricity import from area 2, the frequency dropped suddenly which led to the untimely tripping of several generators in this area. This situation led to a further decrease in frequency and finally led to a total blackout of area 1. On the contrary, the second area faced a surplus of generation power of around 4700 MW, which induced a rapid increase in frequency. Thus, several generation units sensitive to the high frequency value suddenly tripped and the amount of approximately 11 GW of power generation was disconnected. However, this also could not restore the frequency at normal value and the power system of this area collapsed within a few seconds. This situation leads to full power system blackout. The results obtained demonstrate that the operation of the current UFLS scheme applied in the Turkish network was not sufficient to arrest the frequency drop during the blackout. Indeed, additional emergency control measures must be necessary to avoid frequency instability during such events.
Figure 8. Power system frequencies during complete blackout sequence
5.2 Simulations using proposed scheme
The proposed scheme to avoid frequency instability during Turkish wide-area blackout, is examined in this section. The first tie line 1-2 initially tripped by the protection relay during the blackout, was considered as critical tie line. The loss of this line was initiating the fast tripping of all tie lines located between area 1 and area 2. This uncontrolled split of the power system has led to a significant underfrequency conditions in area 1 and over-frequency conditions in area 2. This situation widens the fault area and lead to total blackout. So, the first step in the application of proposed methodology is the use of Phasor measurement units (PMU) located in each side of the lines between two areas to supervision the impedance trajectory, seen by the distance relays. This strategy allows the direct measurements of real-time phasor of voltages and currents. Signals from the global positioning system are used to achieve synchronization by same time sampling of voltage and current wave forms. Figure 7, of the previous work [39], depicts trajectory of the impedance seen by the distance relay located at substation 1. We can see that the load is increased up to the maximum power value available (1625 MVA). The results are analyzed in the reference [39].
Nevertheless, blocking the relay operation during these conditions is not enough to prevent a cascaded tripping of the power system. The proposed scheme will begin to check the load - generation levels L for each power system area.
The simulation results show that the measured value of the unbalance between generation and load in each area is greater than 20%. According to proposed scheme this situation automatically activated adaptive UFLS scheme in the area 1. The operation of proposed UFLS scheme was implemented in a single stage and the amount of load shed in area 1 is illustrated in Table 4.
Table 4. Total amount of load shed by proposed scheme in west area
|
Region |
Station |
Real shed load (MW) |
|
Thrace |
Hamitabat |
22 |
|
Kaptançelic |
18 |
|
|
Ambarli A |
17 |
|
|
Ambarli B |
20 |
|
|
Yenibosna |
22 |
|
|
Habeler |
23 |
|
|
Içdas |
21 |
|
|
Bekirli |
19 |
|
|
Northwest Anatolia |
Adapazan |
14 |
|
Beykoz |
28 |
|
|
Paşakoy |
24 |
|
|
Omranlye |
22 |
|
|
Yédiztepe |
25 |
|
|
Makine |
12 |
|
|
Golakoğlu |
19 |
|
|
West Anatolia |
Morsan |
28 |
|
Soma Res |
18 |
|
|
Bakkeşir |
22 |
|
|
Bekirli |
15 |
|
|
Izdemir |
19 |
|
|
Allaga |
24 |
|
|
Soma |
12 |
|
|
Southwest Mediterranean |
Kemerkoy |
12 |
|
Yenikoy |
16 |
|
|
Varsak |
08 |
|
|
Yatagan |
10 |
|
|
Germençik |
14 |
|
|
Middle Anatolia |
Afyon |
18 |
|
Konya |
15 |
|
|
Temelli |
19 |
|
|
Sincan |
20 |
|
|
Akşa |
12 |
|
|
Eşkisehir |
21 |
|
|
Total |
|
626 |
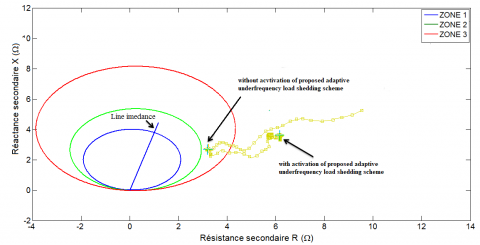
From the results presented in Figure 9 we can see that the amount of shed load by proposed scheme directly impacts on the measured impedance. It is seen that the impedance is increasing out of the zone 3 of the tripping characteristic. The distance relay could correctly operate, and cascaded tripping of other tie lines will be prevented.
Therefore, the simulation results show that by implementation of proposed UFLS scheme, the power system was secured against unpredictable and uncontrolled islanding conditions.
Figure 9. Impedance trajectory seen by distance relay after activation of proposed adaptive UFLS scheme in area 1
In this paper, a new adaptive underfrequency load shedding scheme based wide area measurements from WAMS and SCADA/EMS systems is proposed to improve frequency instability in electrical power system during abnormal conditions.
This scheme is based on the supervision of the distance relay zone 3 decisions of all tie lines between areas using PMU units to initiate underfrequency load shedding actions in order to avoid severe split conditions which could lead to a total collapse or blackout. So, the amount of the load to be shed can be calculated fast and accurately using real time information of the ratio between power generation and load in each area of power system. Thus, the amount of the load to be shed by proposed scheme is basing on the location and amount of the power deficit in the area where the load is connected. The simulation results clearly indicate that the frequency stability problem in the power system was effectively improved by implementing proposed adaptive underfrequency load shedding scheme comparatively with the existing under-frequency load shedding schemes that based only on qualitative off-line analyses for severe contingency scenarios.
This work is the result of my research activities at the Smart Grid Laboratory of Gazi University, where I spent almost eleven months. I thank Prof. Ibrahim Sefa for allowing me to work at his laboratory. I would like to express my sincere thanks to all of members of the laboratory for their support, guidance and helps.
|
UFLS |
Underfrequency load shedding scheme |
|
PMU |
Phasor measurement unit |
|
WAMS |
Wide area measurement system |
|
SCADA |
Supervision control and data acquisition |
|
EMS |
Energy management system |
Transmissions lines parameters and Impedance zone settings:
-Line1-2: Length=206.9 km; positive sequence X= 55.1W; R=4.8 W; zero sequence: X0= 206.8 W; R0= 63.1 W. Zone 1: X1= 46.83 W, R1= 4.08 W; Zone 2: X2= 82.65 W, R2= 7.2 W; Zone 3: X3= 110.2 W, R3= 9.6 W.
- Line 6-8(1): Length=216.5 km; positive sequence X1= 57.2 W; R1= 5 W; zero sequence: X0= 216.3 W; R0= 66.4 W. Zone 1: X1= 48.62 W, R1=4.25W; Zone 2: X2= 85.8W, R2=7.5W; Zone 3: X3= 114.4 W, R3= 10W.
- Line 9-10: Length=175 km; positive sequence X1= 52.8 W; R1= 5.2 W; zero sequence: X0= 180.4W; R0= 50.9W. Zone 1: X1= 44.8W, R1=4.42W ; Zone 2: X2= 79.2 W, R2=7.8 W; Zone 3: X3= 105.6W, R3= 10.4 W.
[1] Shuran, L., Hui, D., Su, G. (2013). Analyses and discussions of the blackout in Indian power grid. Energy Science and Technology, 6(1): 61-66. https://doi.org/10.3968/j.est.1923847920130601.2627
[2] Veloza, O.P., Santamaria, F. (2016). Analysis of major blackouts from 2003 to 2015: classification of incidents and review of main causes. The Electricity Journal, 29: 42-49. https://doi.org/10.1016/j.tej.2016.08.006
[3] Corsi, S., Sabelli, C. (2004). General blackout in Italy Sunday September 28, 2003, h. 03: 28: 00. In IEEE Power Engineering Society General Meeting, pp. 1691-1702. https://doi.org/10.1109/PES.2004.1373162
[4] Entso, E. (2015). Report on Blackout in Turkey on 31st March 2015. Project Group Turkey.
[5] Shahgholian, G., Salary, M.E. (2012). Effect of load shedding strategy on interconnected power systems stability when a blackout occurs. International Journal of Computer and Electrical Engineering, 4: 212-217. https://doi.org/10.7763/IJCEE.2012.V4.481
[6] Galih, J., Muda, K., (2007). IEEE guide for the application of protective relays used for abnormal frequency load shedding and restoration. In IEEE Power Engineering Society, pp. 1-55. https://doi.org/10.1109/IEEESTD.2007.4299516
[7] Mohdzin, A.A., Mohedhafiz, H., Aziz, M.S. (2004). A review of under-frequency load shedding scheme on TNB system. In National Power and Energy Conference, Kuala Lumpur, Malaysia, pp. 170-174. https://doi.org/10.1109/PECON.2004.1461637
[8] Bevrani, H. (2010). Power system load shedding: key issues and new perspectives. World Academy of Science, Engineering and Technology, 4(4): 161-166. https://doi.org/doi.org/10.5281/zenodo.1334313
[9] Maram, M.D., Amjady, N. (2014). Event-based remedial action scheme against super-component contingencies to avert frequency and voltage instabilities. Generation, Transmission & Distribution Journal, 8: 1591-1603. https://doi.org/10.1049/iet-gtd.2013.0780
[10] Dai, Y., Xu, Y., Dong, Z.Y., Wong, K.P., Zhuang, L. (2012). Real-time prediction of event-driven load shedding for frequency stability enhancement of power systems. Generation, Transmission & Distribution IET, 6: 914-921. https://doi.org/10.1049/iet-gtd.2011.0810
[11] Arulampalam, A., Saha, T.K. (2010). Fast and adaptive under frequency load shedding and restoration technique using rate of change of frequency to prevent blackouts, In PES General Meeting IEEE, 1: 1-8. https://doi.org/10.1109/PES.2010.5589415
[12] Terzija, V.V. (2006). Adaptive underfrequency load shedding based on the magnitude of the disturbance estimation. IEEE Transactions on Power Systems, 21: 1260-1266. https://doi.org/10.1109/TPWRS.2006.879315
[13] Amraee, T., Darebaghi, M.G., Soroudi., Keane, A. (2018). Probabilistic under frequency load shedding considering RoCoF relays of distributed generators. IEEE Transactions on Power Systems, 33: 3587-3598. https://doi.org/10.1109/TPWRS.2017.2787861
[14] Rudez, U., Mihalic, R. (2011). Analysis of underfrequency load shedding using a frequency gradient. Power Delivery IEEE Transactions, 26: 565-575. https://doi.org/10.1109/TPWRD.2009.2036356
[15] Laghari, J.A., Mokhlis, H., Bakar, A.H.A., Mohamad, H. (2013). Application of computational intelligence techniques for load shedding in power systems: A review. Energy Conversion and Management, 75: 130-140. https://doi.org/10.1016/j.enconman.2013.06.010
[16] Tang, J., Liu, J., Ponci, F., Monti, A. (2003). Adaptive load shedding based on combined frequency and voltage stability assessment using synchro phasor measurements. IEEE Transactions on Power Systems, 28: 2035-2047. https://doi.org/10.1109/TPWRS.2013.2241794
[17] Luan, W., Irving, M.R., Daniel, J.S. (2002). Genetic algorithm for supply restoration and optimal load shedding in power system distribution networks. In Generation, Transmission & Distribution Conference, 149: 145-151. https://doi.org/10.1049/ip-gtd:20020095
[18] Isazadeh, G.H., Hooshmand, R., Khodabakhshian, A. (2012). Desıgn of an adaptıve dynamıc load sheddıng algorıthm usıng neural network ın the steelmakıng cogeneratıon facılıty. Transactions of Electrical Engineering IJST, 36: 67-82.
[19] Hong, Y.Y., Wei, S.F. (2010). Multiobjective underfrequency load shedding in an autonomous system using hierarchical genetic algorithms. IEEE Transactions on Power Delivery, 25(3): 1355-1362. https://doi.org/10.1109/TPWRD.2010.2046679
[20] Thalassinakis, E.J., Dialynas, E.N., Agoris, D. (2006). Method Combining ANNs and monte Carlo simulation for the selection of the load shedding protection strategies in autonomous power systems. IEEE Transactions on Power Systems, 21: 1574-1582. https://doi.org/10.1109/TPWRS.2006.879293
[21] Seyedi, H., Pasand, M.S. (2009). New centralised adaptive load-shedding algorithms to mitigate power system blackouts. Generation, Transmission & Distribution IET, 3: 99-114. https://doi.org/10.1049/iet-gtd:20080210
[22] Pasand, M.S., Seyedi, H. (2007). New centralized adaptive under frequency load shedding algorithms. In Large Engineering Systems Conference on Power Engineering, Canada. https://doi.org/10.1109/LESCPE.2007.4437350
[23] Chuvychin, V., Petrichenko, R. (2013). Development of smart underfrequency load shedding system. Journal of Electrical Engineering, 64: 123-127. https://doi.org/10.2478/jee-2013-0018
[24] Bentarzi, H., Quadi, A., Ghout, N., Maamri, F., Mastorakis, N.E. (2009). A new approach applied to adaptive centralized load shedding scheme. In WSEAS International Conference on Circuits, Systems, Electronics, Control & Signal Processing, pp. 28-33.
[25] Alhelou, H.H., Hamedani-Golshan, M.E., Njenda, T.C., Siano, P. (2019). Wide-area measurement system-based optimal multi-stage under-frequency load-shedding. Applied Sciences, 9: 1-23. https://doi.org/10.3390/app9030508
[26] Njenda, T.C., Hamedani-Golshan, M.E., Alhelou, H.H. (2018). WAMS based intelligent under frequency load shedding considering online disturbance estimation. In Smart Grid Conference (SGC), Sanandaj, pp. 1-5. https://doi.org/10.1109/SGC.2018.8777779
[27] Jain, S., Gupta, M. (2015). Adaptive under frequency load shedding using synchrophasor measurement. International Journal of Research (IJR), 2: 726-730. https://doi.org/10.1016/S1007-0214(08)72207-7
[28] Derviškadić, A., Zuo, Y., Frigo, G., Paolone, M. (2018). Under frequency load shedding based on pmu estimates of frequency and ROCOF. In IEEE PES Innovative Smart Grid Technologies Conference Europe (ISGT-Europe), Sarajevo, Bosnia-Herzegovina. https://doi.org/10.1109/ISGTEurope.2018.8571481
[29] Han, S., Kwon, Y., Song, J., Lee, B., KO, J., Nam, S., Kim, T., Ahn, Y., Shin, J. (2014). PMU applications in the Korean power system wide-area monitoring and control (WAMAC) system. In 45th International Conference on Large High Voltage Electric Systems CIGRE, Paris, France.
[30] Duong, T.D., Hlen, K. (2017). A topology-based scheme for adaptive underfrequency load shedding. In IEEE Manchester Power Tech, Manchester. https://doi.org/10.1109/PTC.2017.7980854
[31] Jethewa, U.K., BansaL, R.K., Date, N., Vaishnav, R. (2010). Comprehensive load-shedding system. IEEE Transactions on Industry Applications, 46: 740-749. https://doi.org/10.1109/TIA.2010.2041078
[32] Sigrist, L., Egido, I., Eugenio, F., Úbeda, S., Rouco, L. (2010). Representative operating and contingency scenariosfor the design of UFLS schemes. IEEE Transactions on Power Systems, 25: 906-915. https://doi.org/10.1109/TPWRS.2009.2031839
[33] Blackburn, J.L., Domin, T.J. (2014). Protective Relaying: Principles and Applications. Fourth Edition, CRC Press, Taylor&Francis Group, London.
[34] Boussadia, F., Belkhiat, S. (2018). A new algorithm to prevent maloperation of distance protection zone 3 during wide-area disturbances. International Transactions on Electrical Energy System, 28(7): 1-13. https://doi.org/10.1002/etep.2670
[35] Bayliss, C.R., Bayliss, C., Hardy, B. (2012). Transmission and Distribution Electrical Engineering. Elsevier, pp. 287-359. ISBN: 9780080969138
[36] Elmore, W.A. (2007). Protective Relaying Theory and Applications. Second Edition. ISBN-10: 0824756576.
[37] Paula, S.C.V., Barbosa, F.P.M, Ferreira, I.M. (2011). Combined use of SCADA and PMU measurements for power system state estimator performance enhancement. In International Youth Conference on Energetics (IYCE), Leiria, Portugal, pp. 7-9. https://repositorio.inesctec.pt/bitstream/123456789/2321/1/PS-07408.pdf
[38] ENTSO, E. (2016). Frequency stability evaluation criteria for the synchronous zone of Continental Europe-requirements and impacting factors. https://docstore.entsoe.eu/Documents/SOC%20documents/ RGCE_SPD_frequency_stability_criteria_v10.pdf.
[39] Boussadia, F., Belkhiat, S. (2019). A new algorithm to prevent maloperation of distance protection zone 3 during wide area disturbances. International Transactions on Electrical Energy Systems, 29(1): 1-13. https://doi.org/https://doi.org/10.1002/etep.2670.
[40] Franchi, L., Gambelunghe, A., Salvati, R., Sforna, M. (2003). Online dynamic security assessment at the Italian independent system operator. In IEEE Power Tech Conference Proceedings, 3: 8. https://doi.org/10.1109/PTC.2003.1304420.
[41] Bihain, A., Fiorina, M., Wehenkel, L., Cirio, D., Lopez, R., Lucarella, D., Massucco, S., Vega, D.R., Vournas, C., Van Cutsem, T. (2003). A dynamic security assessment tool for the new market environment. IEEE Power Tech Conference Proceedings, Bologna, 3: 8. https://doi.org/10.1109/PTC.2003.1304418
[42] Baratella, P., Casamatta, F., Zacheo, R. (2001). SPIRA-SICRE: an integrated software tool for static and dynamic analyses of large power systems. Transactions on Engineering Sciences, 31: 97-106.
[43] Bagriyanik, M., Ozdemir, A., Kaypmaz, A. (2009). Assessment of protection relay coordination in Turkish national power transmission system to prevent cascading events. In International Conference on Advanced Power System Automation and Protection, 1-5.
[44] Tur, M.R., Shobole, A., Baysal, M., Wadi, M. (2017). Protection coordination in electrical substation part-2 unit protections. Gazi University Journal of Science, 30: 163-178.
[45] Godron, P., Cebeci, M.E., Tör, O.B., Saygın, D. (2018). Increasing the share of renewables in Turkey’s power system: options for transmission expansion and flexibility. SHURA Energy Transition Center. https://www.shura.org.tr/wp-content/uploads/2018/05/Grid-Study-eng.pdf.