Arjun Joshy | Royson Dsouza | Veerakumar Muthirulan | Krishnamurthy H. Sachidananda*
OPEN ACCESS
This paper mainly aims to disclose the effects of cutting conditions on the turning of aluminum alloy 7075 (AA7075). First, the artificial neural network (ANN) was programmed to investigate how cutting parameters, namely cutting speed, feed rate and depth of cut, affect the surface roughness of AA7075. Then, the taguchi method was introduced to design an L27 orthogonal array, in which each cutting parameter is considered on three levels. The results of orthogonal analysis were used to train the ANN called backpropagation neural network (BPNN) on MATLAB. The trained network was applied to predict the surface roughness of AA7075 through MATLAB simulation. Meanwhile, an experiment was conducted under the same conditions. The experimental results were found consistent with the simulation data, indicating that the BPNN is suitable for simulation the turning of AA7075. It is also learned that the cutting speed has the greatest impact on surface roughness; the surface roughness is negeatively correlated with feed rate; the negative correlation is positively mediated by the cutting speed.
turning, feed rate, cutting speed, depth of cut, surface roughness, artificial neural network (ANN), taguchi method, machining
Metal cutting is one of the most widely used manufacturing process, and its advancement in technology continues to advance in line with the progress in material science development. The increase in productivity and efficiency of the metal removal processes depends on machining parameters such as cutting conditions, cutting tool geometry as well as the work piece and tool material. The optimization of the various parameters of the cutting during the turning process is very important as it is directly related to the surface roughness and power consumed by the machine. The main significance of this research is to predict the surface roughess using ANN method during turning of AA7075 by optimizing the various parameters in order to achieve good surface rougness.
Many researchers have analyzed the various parameters in turing of different materials to optimize the cutting conditions. So based on these research work some of the literature reviews have been presented. According to Siddhpura and Paurobally [1] an important aspect in turning process in manufacturing is to obtain the expected final dimensions and better surface finish [2]. Machinability (ease with which material can be removed) is generally expressed in terms of process responses such as life of the tool, surface finish and power consumed. Out of the above process responses the life of tool is considered to be one of the most important aspects in metal cutting and machinability. Also, with the development of advanced materials it is required to search for new reliable and cost effective metal cutting process to increase the life of cutting tool.
Somashekara and Lakshmana [3] have studied the machining control factors considering cutting speed, feed rate and depth of cut in order to optimize surface roughness while machining aluminum alloy Al 6351-T6 using uncoated carbide tool. The optimization was carried out using Taguchi techniques and they concluded that speed has a major influence on the surface roughness of aluminum alloy. Vaibav and Sachin [4] have studied boring of aluminum material on CNC machining considering cutting speed, feed and depth of cut in order to obtain optimal material removal rate and minimum surface roughness using Taguchi method. They concluded that spindle speed and depth of cut are the most affecting parameters on the surface roughness. Das et al. [5] has studied the surface roughness in CNC turning operation considering spindle speed, feed rate and depth of cut using utility based Taguchi method. The validation and confirmatory test of these parameters was justified using utility based Taguchi method. Sonali et al. [6] have studied optimal machining parameters on aluminum 6061 considering surface roughness. They concluded that spindle speed, feed rate, depth of cut and nose radius have major impact on surface roughness. Wang and Feng [7] have studied surface roughness in turning operation considering workpiece hardness, speed, feed rate, depth of cut, cutting tool point angle and cutting time. They concluded that the metal cutting experiments and corresponding statistical tests developed has produced smaller errors as compared to many other existing models. Nalbant et al. [8] have studied surface roughness prediction considering cutting parameters in CNC turning operation. They used neural network models along with regression models in order to estimate the surface roughness. They concluded that surface roughness prediction using neural network were in line with regression models. Gokkaya and Nalbant [9] have studied the coating type, feed and cutting speed on surface roughness with five different cutting speed. They concluded that surface roughness is inversely proportional to the cutting speed. Dave et al. [10] have studied surface roughness in turned machine parts in order to analyze optimum cutting condition using Taguchi method. They concluded that roughness of the surface plays an important role in machining processes. Kumar et al. [11] have studied the effect of cutting speed, feed rate and depth on cut on surface roughness in CNC turning using Taguchi approach. They concluded that the spindle speed is the most important factor in surface roughness during machining processes. Gupta and Kumar [12] have studied surface roughness and MRR in turning operation using Taguchi method considering nose radius of the tool, rake angle of the tool, cutting speed, feed rate, cutting environment and depth of cut. They concluded that surface roughness increases as feed rate increases. Jafari et al. [13] have studied surface roughness in micro-wire electric discharge machining using Taguchi and ANN method. They concluded that micro-weld parameters have great influence on surface roughness. Palanikumar and Karthikeyan [14] has studied the effects of machining parameters on surface finish in turning composite materials using Taguchi experimental design techniques. They concluded that the analyzed method can be used to study the effect of surface roughness in Al/SiC-MMC composites with 95 % confidence level. Uday et al. [15] have studied four composites in order to analyze the size and volume fraction on machining forces and surface roughness. They concluded that surface roughness values were in line with experimental results when nose radius of the tool is less than the depth of cut. Based on the above literature it is found that many researchers have studied the different aspects of machining parameters such as process kinematics, cooling fluid during machining, step over, depth of cut, angle of the tool, feed rate and cutting speed on surface roughness considering different materials [16]. Karkalos and Angelos [17] have studied the determination of tool life in turning operation considering Taguchi and ANN method. They concluded that in order to get the accurate results the experimental designs and various performance function can be used along with ANN. Sreenivasaulu [18] have studied CNC drilling on Al 6061 considering various cutting parameters using Taguchi and ANN method. They concluded that the comparison of predictive model and the experimental value shows good agreement. Gupta et al. [19] have studied surface parameters considering multi-objective optimization considering Taguchi and grey relation method. They studied concavity, straightness and surface roughness in milling process and they concluded that the optimization of different parameters can be performed using Taguchi and grey relational method. Dahbi et al. [20] have studied turning of 2017A aluminum alloy for measuring various cutting parameters using a CNC lathe machine. They studied the machining parameters and its effect on surface roughness using ANN. They concluded from the developed ANN network that the experimental value was close agreement with the estimated values. Das et al. [21] have studied machining process parameters using ANOVA in turning Al 7075 metal matri composite under heat treated condition. They concluded that the most significant parameters were cutting speed followed by depth.
From the above literature it is observed that many research work using ANN method to optimize surface roughness has been studied for various materials. In this experimental work an alloy of Aluminum Al 7075 which is most commonly used in aeronautical and manufacturing industries has been taken as a material for investigation and the effect of cutting speed, feed and depth of cut on surface roughness [22] using Taguchi and ANN method is considered. The experiments have been performed on Al 7075 material using a CNC turning machine considering speed, feed and depth of cut and its effect on surface roughness has been measured. These experimental results have been analyzed using Taguchi and ANN method. This finding shed new light in optimizing surface roughness by considering various parameters in turing of Al 7075 material using ANN method. The results of the surface roughness optimization clearly show that the experimental values were in good agreement when tested using Taguchi and ANN methods.
In this research work analysis of variance (ANOVA) using Taguchi method have been used for optimization of speed, feed rate and depth of cut and to study its effects on surface roughness. Then the testing, training and validation of the experimental results with predicted values have been performed using ANN. The material used for the study is aluminum alloy Al 7075. The machining tests were conducted on CNC lathe machine and the technical specifications of the machine is as shown in Table 1.
Table 1. Technical specifications of the MTAB flex CNC machine
|
Chuck size |
100 |
|
Maximum Turning diameter |
80 mm |
|
Maximum turning length |
195 mm |
|
No. of axis |
2 |
|
Positioning |
0.010mm |
|
Repeatability |
0.005mm |
|
Spindle Speed Range |
150 – 4000rpm |
|
Spindle Motor |
AC Servo |
|
Control |
Siemens/ Fanuc/ Mitsubishi |
|
Feed Rate |
0-5000 mm/min |
|
Dimensions (LxWxH) |
1700mm x 1100mm x 1650mm |
|
Lubrication |
Automatic Lubrication System |
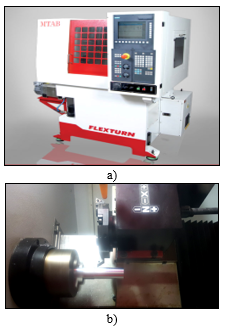
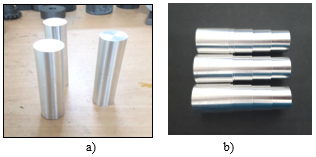
The experiments were performed on CNC turning machine (MTAB Flex) and the experimental setup is as shown in Figure 1. The experiments were conducted as per Taguchi’s L27 orthogonal array. The corresponding dimension of the aluminum workpiece considered for experimentation was having a diameter of 25 mm and length of 100 mm. The specimen was clamped onto the chuck of the machine. The surface roughness measurement was done using surface roughness tester (TR110) which is pocket sized surface roughness measuring instrument suited for on the spot surface measurement quickly. The specifications of the surface roughness instrument is as shown in Table 2. The specimen before machining and after machining is as shown in Figure 2.
The optimization of the control factors after performing turning operation were done using Minitab 18 software. The corresponding experimental plan is as shown in Table 3. The corresponding values of the surface roughness is as shown in Table 4. The signal to noise ratio (S/N) is a measure in engineering to compare desired signal to background noise. The signal to noise ratio (S/N) for surface roughness values were calculated using smaller-the-better characteristics as per the Taguchi’s L27 orthogonal array. The corresponding S/N ratio shown as delta is as shown in Table 5. From this table it is analyzed that the spindle speed is the most effective variable on surface roughness as compared to feed rate and depth of cut.
Figure 1. Experimental machine and experimental set up
Figure 2. a) Before machining b) After machining
Table 2. Technical specifications of the surface roughness tester
|
Display |
Dynamic Display during testing |
|
Measuring range |
Ra – 0.05um-15.0um |
|
Tracing length |
6mm |
|
Tracing Speed |
1mm/sec |
|
Temperature Range |
40 Degree C |
|
Power Supply |
3.0V/Li-Ion batteries |
|
Dimensions |
102mm x 70mm x 22mm |
|
Weight |
180gms |
Table 3. Control factors for experimental setup
|
Parameters |
Level 1 |
Level 2 |
Level 3 |
|
Spindle speed, v (rpm) |
1000 |
1200 |
1400 |
|
Feed rate, f (mm/rev) |
40 |
60 |
80 |
|
Depth of cut (mm) |
0.2 |
0.3 |
0.4 |
Table 4. Surface roughness values for L27 Orthogonal array
|
Exp. No. |
Spindle Speed. (rpm) |
Feed rate (mm/rev) |
Depth of Cut. (mm) |
Surface Roughness. (Ra) |
|
1 |
1000 |
40 |
0.2 |
1.82 |
|
2 |
1000 |
40 |
0.3 |
0.39 |
|
3 |
1000 |
40 |
0.4 |
0.81 |
|
4 |
1000 |
60 |
0.2 |
0.53 |
|
5 |
1000 |
60 |
0.3 |
0.61 |
|
6 |
1000 |
60 |
0.4 |
0.73 |
|
7 |
1000 |
80 |
0.2 |
1.30 |
|
8 |
1000 |
80 |
0.3 |
1.45 |
|
9 |
1000 |
80 |
0.4 |
1.38 |
|
10 |
1200 |
40 |
0.2 |
0.69 |
|
11 |
1200 |
40 |
0.3 |
0.86 |
|
12 |
1200 |
40 |
0.4 |
1.15 |
|
13 |
1200 |
60 |
0.2 |
0.83 |
|
14 |
1200 |
60 |
0.3 |
0.93 |
|
15 |
1200 |
60 |
0.4 |
1.08 |
|
16 |
1200 |
80 |
0.2 |
0.75 |
|
17 |
1200 |
80 |
0.3 |
0.70 |
|
18 |
1200 |
80 |
0.4 |
1.22 |
|
19 |
1400 |
40 |
0.2 |
0.89 |
|
20 |
1400 |
40 |
0.3 |
1.39 |
|
21 |
1400 |
40 |
0.4 |
0.88 |
|
22 |
1400 |
60 |
0.2 |
1.74 |
|
23 |
1400 |
60 |
0.3 |
1.96 |
|
24 |
1400 |
60 |
0.4 |
2.02 |
|
25 |
1400 |
80 |
0.2 |
1.07 |
|
26 |
1400 |
80 |
0.3 |
2.76 |
|
27 |
1400 |
80 |
0.4 |
3.64 |
Table 5. Response table for signal to noise ratio
|
Level |
Spindle speed (rpm) |
Feed(mm/rev) |
Depth of cut(mm) |
|
1 |
-0.04428 |
-0.44006 |
-2.09328 |
|
2 |
0.62417 |
-0.38894 |
-1.29957 |
|
3 |
-4.98197 |
-3.57308 |
-1.00923 |
|
Delta |
5.60613 |
3.18413 |
1.0840 |
|
Rank |
1 |
2 |
3 |
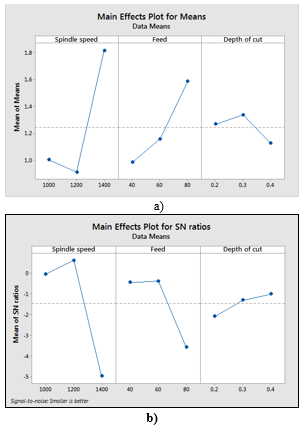
Figure 3 (a) and 3(b) shows the main effect plots for S/N ratios and data means. The main objective of S/N ratios is to measure the performance measurement to develop product and processes which are insensitive to variance factors. The signal to noise ratio indicates the degree of the predictable performance parameter of a process in the presence of noise factors. The process parameters with the least signal to noise ratio yield the optimum quality with minimum variance.
Figure 4 (a) and 4(b) shows the surface plots drawn using Minitab 18 software to find the relation between response variable and cutting parameters. These plots show a response variable and its relation with respect to other two factors. The surface roughness can be classified into coarse, rough, medium and fine and if the cutting tool is having greater radius, causes smaller surface roughness values. From Figure 4 it is observed that as the depth of cut and feed increases, surface roughness increases. The lower value of surface roughness can be achieved by maintaining higher level of spindle speed and low levels of feed rate and depth of cut. This increase in surface quality occurs due to high temperature causing easy deformation at the cutting side and around the radius of the cutting tool tip [23].
Figure 3. Main effect plot for S/N ratios (Ra)
Figure 4. Surface plot for surface roughness vs depth of cut, feed
Table 6 shows the analysis of variance (ANOVA) for S/N ratios. From this table it is observed that the values of P less than 0.005 indicates the most significant parameter and in this case spindle speed is the significant parameter as compared to depth of cut and feed rate. From the results of Minitab software it is observed that for turning of aluminum alloy 7075, the spindle speed contributed 54.65% and feed rate and depth of cut contributed 34.67% and 10.47% considering significant interaction effect between spindle speed and depth of cut. The optimum value of surface finish obtained for machining aluminum alloy 7075 are spindle speed of 1200 rpm, feed rate of 60 mm/min and depth of cut 0.4 mm.
Table 6. ANOVA for SN ratios
|
Source |
DOF |
Adj SS |
Adj MS |
F |
P |
|
Spindle Speed |
2 |
4.4683 |
2.2342 |
6.29 |
0.008 |
|
Feed |
2 |
1.7111 |
0.8556 |
2.41 |
0.116 |
|
Depth of cut |
2 |
0.2105 |
0.1052 |
0.30 |
0.747 |
|
Residual Error |
20 |
7.1095 |
0.3555 |
||
|
Total |
26 |
13.4994 |
Artificial neural networks (ANN) are used to develop models similar to the human brain processes information. A large amount of uncertain and noisy data can be efficiently processed in human brain through neural network. These neural networks attempt to mimic the functioning of biological neurons and hence generate intelligent decisions. These decisions are fundamental processed in a neural network through neurons, which possess a memory which is local for carrying out localized information processing operations. These neurons are interconnected using uni-directional channels of signal called connection into multi-level networks. Each neuron is having a single output, which then branches into as many number of collateral connections as required. Each neuron carries the same original signal as the neuron output signal. These neuron signals can be of mathematical coded type apart from electrical and chemical signals. The signal processing under each neuron should be completely local and it depends on the current values of the arriving input signal through impinging connections and compare the values which is stored within the neuron’s local memory. There are many kinds of architectures based on neural network which includes Adaptive resonance (ART) models, Back-propagation models, Hopfield models, Kohonen’s models etc. have been designed and developed and signals are broadcasted uni-directional from the neuron input layer through the neuron hidden layers to the outside layers [24]. The attainment of the neural network is strongly influenced by the selection of network structure [25], algorithm, training, testing, transfer, learning and performance characteristics function. In this research paper feed-forward back-propagation neural network model has been adopted (refer Figure 5).
Figure 5. Architecture of the proposed artificial neural network structure
5.1 Normalization of input data
Before inputting the data in multilayer feed forward back propagation neural network, it is required to perform the normalization of the input and output data [26]. Normalization is a process of transformation which is performed on the data in order to distribute and range it into an acceptable scale for further analysis. In this research work, the normalization of the data sets is in the range of 0.1-1 [27] and was performed using the Eq. (1) as shown below [28].
$N=0.1+0.9\left(\frac{x-X_{\min }}{X_{\max }-X_{\min }}\right)$ (1)
where, X = actual value, Xmin = minimum value, Xmax = maximum value and N = normalized value corresponding to X.
An increase in the amount of data during training will always increase the chance of getting more exact model. In case of machining the corresponding data for training is taken from the experimental trails. There are so many constraints for the researcher such as cost of experiments and time consumed in conducting the actual experiment in order to get more data for the modelling. But from several studies it is observed that using lesser amount of modelling samples it is possible to get good models during testing and training. Cus et al. [29] have obtained good results for predicting surface roughness with very less amount of training and testing data. They took a sample of 27 in order to predict surface roughness using ANN model during their experimentation. When the testing data used by programmers is smaller than the training data, then it is needed to isolate the available experimental samples into separate training and testing. In these cases it is recommended to use guidelines given by Zhong et al. [30] and they have recommended that the ratio of training and testing samples could be 90% : 10%, 85% : 15% and 80% : 20%. In this research, the experimental sample considered was 27 and hence 80% : 20% preferred ratio was selected.
5.2 Training of developed ANN
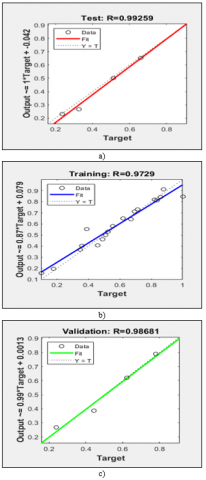
From Figure 6 (a) it is observed one dashed line and one blue line. The dashed line shows perfect fit whereas blue line shows a linear fit. The best agreement between the experimental and predicted values during the ANN training model is specified by the equation as predicted value = 0.87 * experimental value + 0.079 which clearly represents excellent association between experimental and predicted values of surface roughness.
Figure 6. Comparison between experimental and predicted surface roughness during a) training, b) testing and c) validation
5.3 Testing of ANN developed model
Figure 6(b) shows the comparison of predicted surface roughness and the experimental model during testing of ANN model. From this figure it is observed dotted line and the other red line. The dotted line shows perfect fit while red line shows the linear fit. The best agreement between the experimental values and predicted values during testing of the ANN model is given as predicted value = 1 * experimental value +0.042 which clearly represents interrelationship between experimental and predicted surface roughness values.
Figure 6 (c) shows the correlation between experimental and predicted values of surface roughness during validation. From this figure it is observed one dashed lines and the other a solid green line. The dashed line shows perfect fit whereas green line shows a linear fit. The best agreement between the experimental values and predicted values during validation of the ANN model is given as predicted value = 0.99 * experimental value +0.0013 which clearly shows excellent correlation between experimental surface roughness values with the predicted surface roughness values.
The artificial neural network that was developed is trained for the input as well as for the output values. The benchmark for stopping the training depends upon the number of epochs and is considered in this research work as 1000 epochs. The simulation of the network is conducted for both input values and the target values during experiments. The input values for the network is trained during the test readings and then the target obtained is compared with the actual output. The predicted surface roughness (Ra) values are compared with the experimental (Ra) surface roughness values and the comparison show minimal variations.
The predicted value of surface roughness (Ra) is compared with the measured average values of surface roughness (Ra) and the absolute percentage error is computed, as per the Eq. 2 given below [30]:
$\%$ Absolute error $=\left|\frac{R_{\text {aActual}}-R_{\text {aPredicted}}}{R_{\text {aActual}}}\right| \times 100$ (2)
where, Ra,Actual = measured value and Ra,Predicted = ANN predicted value.
Table 7. Predicted value by ANN
|
Experiment No. |
Spindle speed (rpm) |
Feed rate (mm/rev) |
Depth of cut (mm) |
Surface roughness (Ra) |
Normalized Ra |
Average Ra |
|
1 |
1000 |
40 |
0.2 |
1.82 |
0.496 |
0.497 |
|
2 |
1000 |
40 |
0.3 |
0.39 |
0.1 |
0.132667 |
|
3 |
1000 |
40 |
0.4 |
0.81 |
0.216 |
0.239333 |
|
4 |
1000 |
60 |
0.2 |
0.53 |
0.138 |
0.167667 |
|
5 |
1000 |
60 |
0.3 |
0.61 |
0.16 |
0.187667 |
|
6 |
1000 |
60 |
0.4 |
0.73 |
0.194 |
0.219 |
|
7 |
1000 |
80 |
0.2 |
1.3 |
0.352 |
0.364667 |
|
8 |
1000 |
80 |
0.3 |
1.45 |
0.393 |
0.402 |
|
9 |
1000 |
80 |
0.4 |
1.38 |
0.374 |
0.384667 |
|
10 |
1200 |
40 |
0.2 |
0.69 |
0.183 |
0.209 |
|
11 |
1200 |
40 |
0.3 |
0.86 |
0.23 |
0.252 |
|
12 |
1200 |
40 |
0.4 |
1.15 |
0.31 |
0.325667 |
|
13 |
1200 |
60 |
0.2 |
0.83 |
0.221 |
0.244 |
|
14 |
1200 |
60 |
0.3 |
0.93 |
0.249 |
0.269667 |
|
15 |
1200 |
60 |
0.4 |
1.08 |
0.291 |
0.308333 |
|
16 |
1200 |
80 |
0.2 |
0.75 |
0.199 |
0.223667 |
|
17 |
1200 |
80 |
0.3 |
0.7 |
0.185 |
0.210667 |
|
18 |
1200 |
80 |
0.4 |
1.22 |
0.329 |
0.343333 |
|
19 |
1400 |
40 |
0.2 |
0.89 |
0.238 |
0.259733 |
|
20 |
1400 |
40 |
0.3 |
1.39 |
0.376 |
0.386667 |
|
21 |
1400 |
40 |
0.4 |
0.88 |
0.235 |
0.256667 |
|
22 |
1400 |
60 |
0.2 |
1.74 |
0.473 |
0.475667 |
|
23 |
1400 |
60 |
0.3 |
1.96 |
0.534 |
0.532 |
|
24 |
1400 |
60 |
0.4 |
2.02 |
0.551 |
0.547667 |
|
25 |
1400 |
80 |
0.2 |
1.07 |
0.288 |
0.305667 |
|
26 |
1400 |
80 |
0.3 |
2.76 |
0.756 |
0.736 |
|
27 |
1400 |
80 |
0.4 |
3.64 |
1 |
0.960667 |
Figure 7. Correlation between experimental and predicted surface roughness
Table 8. Predicted values of Absolute error
|
Experiment No. |
Spindle speed(rpm) |
Feed rate(mm/rev) |
Depth of cut(mm) |
Surface roughness (Ra) |
Difference (Actual-Predicted) |
Absolute Error |
|
1 |
1000 |
40 |
0.2 |
1.82 |
0.001 |
0.201612903 |
|
2 |
1000 |
40 |
0.3 |
0.39 |
0.032666667 |
32.66666667 |
|
3 |
1000 |
40 |
0.4 |
0.81 |
0.023333333 |
10.80246914 |
|
4 |
1000 |
60 |
0.2 |
0.53 |
0.029666667 |
21.49758454 |
|
5 |
1000 |
60 |
0.3 |
0.61 |
0.027666667 |
17.29166667 |
|
6 |
1000 |
60 |
0.4 |
0.73 |
0.025 |
12.88659794 |
|
7 |
1000 |
80 |
0.2 |
1.3 |
0.012666667 |
3.598484848 |
|
8 |
1000 |
80 |
0.3 |
1.45 |
0.009 |
2.290076336 |
|
9 |
1000 |
80 |
0.4 |
1.38 |
0.010666667 |
2.852049911 |
|
10 |
1200 |
40 |
0.2 |
0.69 |
0.026 |
14.20765027 |
|
11 |
1200 |
40 |
0.3 |
0.86 |
0.022 |
9.565217391 |
|
12 |
1200 |
40 |
0.4 |
1.15 |
0.015666667 |
5.053763441 |
|
13 |
1200 |
60 |
0.2 |
0.83 |
0.023 |
10.40723982 |
|
14 |
1200 |
60 |
0.3 |
0.93 |
0.020666667 |
8.299866131 |
|
15 |
1200 |
60 |
0.4 |
1.08 |
0.017333333 |
5.956471936 |
|
16 |
1200 |
80 |
0.2 |
0.75 |
0.024666667 |
12.39530988 |
|
17 |
1200 |
80 |
0.3 |
0.7 |
0.025666667 |
13.87387387 |
|
18 |
1200 |
80 |
0.4 |
1.22 |
0.014333333 |
4.356636272 |
|
19 |
1400 |
40 |
0.2 |
0.89 |
0.021733333 |
9.131652661 |
|
20 |
1400 |
40 |
0.3 |
1.39 |
0.010666667 |
2.836879433 |
|
21 |
1400 |
40 |
0.4 |
0.88 |
0.021666667 |
9.219858156 |
|
22 |
1400 |
60 |
0.2 |
1.74 |
0.002666667 |
0.563777308 |
|
23 |
1400 |
60 |
0.3 |
1.96 |
0.002 |
0.374531835 |
|
24 |
1400 |
60 |
0.4 |
2.02 |
0.003333333 |
0.604960678 |
|
25 |
1400 |
80 |
0.2 |
1.07 |
0.017666667 |
6.134259259 |
|
26 |
1400 |
80 |
0.3 |
2.76 |
0.02 |
2.645502646 |
|
27 |
1400 |
80 |
0.4 |
3.64 |
0.039333333 |
3.933333333 |
|
|
|
|
|
|
Avg |
8.283259 |
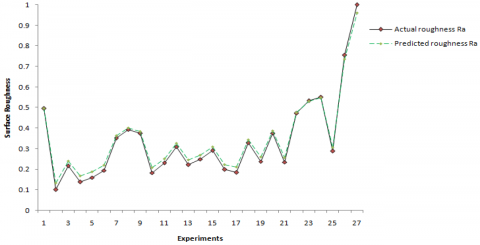
The experimental roughness values thus obtained have been estimated for each set of values and the same is measured with predicted roughness values as shown in Table 7 and Table 8. The performance of surface roughness with respect to other parameters is analyzed and its influence on surface roughness is carried out and identified from the experiments. The percentage difference between actual surface roughness values and predicted surface roughness values is as shown in Table 7 and from this the average percentage of error is 8.28%.
Figure 7 shows the graph of error profile of experimental and the predicted roughness for 27 input trials. The maximum absolute percentage error during training patterns was found to be around 1 and 0.96 for actual and predicted values respectively. From this it is evident that ANN can be used to predict the surface roughness and the performance of the trained network can be further estimated by using a regression analysis between the network and the corresponding targets.
In this research work CNC turning operation have been performed on aluminum alloy 7075 material and the surface roughness have been measured by considering machining parameters such as spindle speed, feed rate and depth of cut. The optimization of the process has been performed using analysis of variance (ANOVA). By using ANN model the prediction of surface roughness has been performed using feed-forward back-propagation method. The model has been evaluated based on the percentage deviation between the predicted surface roughness (Ra) vales and the actual surface roughness (Ra) values. Based on this research work, the following conclusions have been drawn.
[1] Siddhpura, A., Paurobally, R. (2013). A review of flank wear prediction methods for tool condition monitoring in a turning process. The International Journal of Advanced Manufacturing Technology, 65(1-4): 371-393.
[2] Dan, Li., Mathew, J. (1990). Tool wear and failure monitoring techniques for turning-a review. International Journal of Machine Tools and Manufacture, 30(4): 579-598. https://doi.org/10.1016/0890-6955(90)90009-8
[3] Somashekara, H.M., Lakshmana swamy, N. (2012). Optimizing surface roughness in turning operation using Taguchi techniques and ANOVA. International Journal of Engineering Science and Technology, 4(5): 1967-1973.
[4] Vaibhav, J., Sachin, B. (2015). Process parameter optimization of CNC turning for titanium wrought iron. International Journal of Modern Trends in Engineering and Research, 2(11): 141-146.
[5] Das, B., Rai, R.N., Saha, S.C. (2015). Surface quality optimization of Al-5Cu alloy using utility theory coupled with Taguchi method. Advances in Applied Physical and Chemical Sciences-A Sustainable Approach, 2015: 40-45.
[6] Sonali, P., Mohanty, A.M. (2016). Performance analysis of surface roughness in al alloy using different cutting parameters. International Journal of Multidisciplinary Research and Development, 3(4): 1-4.
[7] Wang, X., Feng, C.X. (2002). Development of empirical models for surface roughness prediction in surface turning. International Journal of Advanced Manufacturing Technology, 20(5): 348-356.
[8] Nalbant, M., Gokkaya, H., Toktas, I. (2007). Comparison of regression and artificial neural network models for surface roughness prediction with the cutting parameters in CNC turning. Modelling and Simulation in Engineering, 2007: 1-14. https://doi.org/10.1155/2007/92717
[9] Gokkaya, H., Nalbant, M. (2006). The effects of cutting tool coating on the surface roughness of AISI 1015 steel depending on cutting parameters. Turkish Journal of Engineering and Environmental sciences, 30(5): 307-316.
[10] Dave, H., Patel, L., Raval, H. (2012). Effect of machining conditions on MRR and surface roughness during CNC turning of different materials using TiN coated cutting tools-A Taguchi approach. International Journal of Industrial Engineering Computations, 3(5): 925-930. https://doi.org/10.5267/j.ijiec.2012.04.005
[11] Kumar, H., Abbas, Mohammad, A., Jafri, H. (2013). Optimization of cutting parameters in CNC turning. International Journal of Engineering Research and Applications (IJERA), 3(3): 331-334.
[12] Gupta, M., Kumar, S. (2015). Investigation of surface roughness and MRR for turning UD-GFRP using PCA and Taguchi method. Engineering Science and Technology, An International Journal, Elsevier, 18(1): 70-81. https://doi.org/10.1016/j.jestch.2014.09.006
[13] Jafari, R., Kahya, M., Oliaei, S.N.B., Ünver, H.O., Ozyurt, T.O. (2017). Modeling and analysis of surface roughness of microchannels produced by μ-WEDM using an ANN and Taguchi method. Journal of Mechanical Science and Technology, 31(11): 5447-5457. https://doi.org/10.1007/s12206-017-1039-7
[14] Palanikumar, K., Karthikeyan, R. (2007). Optimal machining conditions for turning of particulate metal matrix composites using Taguchi and response surface methodologies. Machining Science and Technology: An International Journal, 10(4): 417-433. https://doi.org/10.1080/10910340600996068
[15] Dabade, U.A., Sonawane, H., Joshi, S. (2010). Cutting forces and surface roughness in machining Al/SiCp composites of varying composition. Machining Science and Technology: An International Journal, 14(2): 258-279. https://doi.org/10.1080/10910344.2010.500950
[16] Benardos, P.G., Vosniakos, G.C. (2003). Predicting surface roughness in machining: A review. International Journal of Machine Tool and Manufacture, 43(8): 833-844. https://doi.org/10.1016/S0890-6955(03)00059-2
[17] Karkalos, N.E., Angelos, M.P. (2017). Applicability of ANN models and Taguchi method for the determination of tool life in turning. Matec Web of Conferences, 112(06005): 1-6. https://doi.org/10.1051/matecconf/201711206005
[18] Sreenivasulu, R. (2015). Optimization of Burr size surface roughness and circularity deviation during drilling of Al 6061 using Taguchi design method and artificial neural network. Independent Journal of Management and Production, 6(1): 93-108.
[19] Gupta, A., Shah, R., Dave, H., Khanna, N. (2018). Multi-objective optimization of surface parameters such as concavity, straightness and roughness in milling process. Material Today Proceedings, Elsevier, 5(2): 5296-5302. https://doi.org/10.1016/j.matpr.2017.12.113
[20] Dahbi, S., Ezzine, L., Moussami, H.E.L. (2017). Modeling of cutting performances in turning process using artificial neural networks. International Journal of Engineering Business Management, 9: 1-13. https://doi.org/10.1177%2F1847979017718988
[21] Das, D., Chaubey, A., Nayak, B.B., Mishra, P.C., Samal, C. (2018). Investigation on cutting tool wear in turning AI 7075/SiCp metal matrix composites. International Conference on Mechanical, Materials and Renewable Energy, 377: 1-7. https://doi.org/10.1088/1757-899X/377/1/012110
[22] Qu, J., Shih, A.J. (2003). Analytical surface roughness parameters of a theoretical profile consisting of elliptical arcs. Machining Science and Technology: An International Journal, 7(2): 281-294. https://doi.org/10.1081/MST-120022782
[23] Shaban, Y., Yacout, S., Balazinski, M., Jemielniak, K. (2017). Cutting tool wear detection using multiclass logical analysis of data. Machining Science and Technology, 21(4): 526-541. https://doi.org/10.1080/10910344.2017.1336177
[24] Sheikh-Ahmad, J., Twomey, J., Kalla, D., Lodhia, P. (2007). Multiple regression and committee neural network force prediction models in milling FRP. Machining Science and Technology: An International Journal, 11(3): 391-412.
[25] Pendse, D.M., Joshi, S.S. (2004). Modeling and optimization of machining process in discontinuously reinforced aluminums matrix composites. Machining Science and Technology, 8(1): 85-102. https://doi.org/10.1081/MST-120034242
[26] Khataee, A.R., Kasiri, M.B. (2010). Artificial neural networks modeling of contaminated water treatment processes by homogneous and heterogeneous nanocatalysis. Journal of Molecular Catalysis A: Chemical, 331(2010): 86-100. https://doi.org/10.1016/j.molcata.2010.07.016
[27] Nowruzi, H., Ghassemi, H. (2016). Using artificial neural network to predict velocity of sound in liquid water as a function of ambient temperature, electrical and magnetic fields. Journal of Ocean Engineering and Science, 1(3): 203-211. https://doi.org/10.1016/j.joes.2016.07.001
[28] Munoz-Escalona, P., Maropoulos, P.G. (2014). A geometrical model for surface roughness prediction when face milling Al 7075-T7351 with square insert tools. Journal of Manufacturing Systems, Elsevier, 36: 216-223. https://doi.org/10.1016/j.jmsy.2014.06.011
[29] Cus, F., Zuperl, U., Gecevska, V. (2007). High speed end-milling optimization using particle swarm intelligence. Journals of Achievements in Materials and Manufacturing Engineering, 2(22): 75-78.
[30] Wang, Z.R., Zou, Y.F., Zhang, F. (2011). A machine vision approach to tool wear monitoring based on the image of workpiece surface texture. Advanced Materials Research, (154-155): 412-416. https://doi.org/10.4028/www.scientific.net/AMR.154-155.412