Kelvin A. Minor* | Iman H. Kartowisastro
© 2022 IIETA. This article is published by IIETA and is licensed under the CC BY 4.0 license (http://creativecommons.org/licenses/by/4.0/).
OPEN ACCESS
Musical sheet is an important tool for musicians that enables musicians to communicate with each other and help musicians to learn a composition of a song. Sometimes, musicians face an obstacle when they cannot find the musical sheet to learn a new song or it may require payment to get the sheet. The solution for this problem is to learn the song by figuring out the composition of a song using music transcription. Music Transcription is the process of music information retrieval to produce musical notation. Music Transcription using a computational method often called Automatic Music Transcription by upload the audio file as an input and generate musical sheet. The proposed method is solved using Note Value Detection to separate windows by the detected note values and Fourier Transform to recognize the frequency from each window. This study is evaluating the system using three variables; note value, pitch accuracy, and extra notes. The study shows that note value and pitch detection gives a relatively small percentage error. Meanwhile, extra note detection gives a relatively moderate percentage error in every polyphonic file.
musical notation, music transcription, note value detection, Fourier transform
The music industry has become popular and continues to evolve across the world. Even in difficult situations (like Covid-19 Pandemic), the industry implements different approaches using the available technology to interact with the consumers [1]. Prior to digitalization, distribution of music is even boarder [2]. Besides can be enjoyed through the audio, music can be represented in a sheet of a paper. Musical sheet is an important tool for musicians that enables musicians to communicate with each other [3]. With musical sheet, anyone can learn a composition of a song, but not every song has the musical sheet or it may require payment to get the sheet.
Music Transcription is the process of music information retrieval to produce musical sheet. By definition, Music Transcription is listening to the song and write it down in musical notation [4]. To perform Music Transcription manually, a person must have certain knowledge and it requires a lot of time to translate a song into notation. While Music Transcription process done manually, Automatic Music Transcription (AMT) is the Music Transcription process using computational technique.
The proposed method in this study wants to use Fourier Transform to perform pitch detection system by separating audio file into windows systematically using the duration of the notes. The paper will break down the whole step and experiment in a clear and visible state. The system is based on Note Value Detection and Pitch Detection. In this study, Note Value Detection can be obtained from the perceived pulse of the signal to estimate the duration of each note (note value / note length) in the audio file. Note Value Detection algorithm needs to be performed because the result of the algorithm can be used to split the signal into multiple windows, so the system can have windows contained signals ordered by time. Pitch Detection in this research is using Fast Fourier Transform on each window to obtain the frequencies and store it to the data collection. The final step of the method is translating the data collection into musical notation as the presentation.
Evaluation of the system will be performed using the pair of musical sheet and audio file. The musical sheet will act as the ground truth in the array form. The audio file will act as the input of the system that produce the list of note name and note value. The evaluation value will be obtained by comparing the ground truth and the result.
In the academic field, research on Music Transcription has been performed by some researchers using well-known methods like Fourier Transform. Fourier Transform can be used for melody transcription, audio remixing, karaoke, and instrument identification [5]. Seetharman et al. are using Fourier Transform to analyze the audio and using some technique from image processing to extract singing voice from an audio file. Similar research was performed to transform the musical signal from Gamelan into notation as a guide in playing the instrument [6]. Fitria, Suprapto, and Purnomo transform the signal into time-frequency domain using Short Term Fourier Transform and then after that filter the signal to determine range of frequency. Even though their method shows a good result to generate music transcription, but the method shows difficulty to determine the sample of music notation. Another study related to Fourier Transform is performed to obtain Average Energy value as one of the parameters used in the music information retrieval [7]. But the weakness of the research is they are using wav audio file that cannot be more than 30 seconds. Fourier Transform also used for polyphonic signal to break down the content of voice recording using Fourier Transform [8]. In contrast to deep learning, Fourier Transform method breaks down the content of each step in a clear and visible state. The main advantage of the method is the avoidance of corrections of abnormal points, which enhance the efficiency of the method.
Fourier Transform has the drawback of having a fixed window size and it has been solved by Wavelet Transform [9]. But actually, before we perform Fourier Transform, we can split the signal by note values using Beat Detection method. Fourier Transform is also able to have more resistance against the harmonic notes rather than Wavelet Transform [10]. And we can still say that Fourier Transform is important and still relevant for signal analysis nowadays [11]. Fourier Transform is also widely used in the digital signal processing field especially in audio processing, it also makes difficult problems become very simple to analyze [12]. Fourier Transform is a well-known method that is good for extracting the frequency domain behavior of signals [13]. In medical field, Fourier Transform is also used for classify the heartbeat by obtaining a spectrogram of heart [14]. The research was using Fourier Transform because there is no need to perform further analysis to distribute the information, because all the calculation was performed using Fourier Transform itself. On the other hand, However, some researchers prefer using Deep Learning to learn a melody and retrieve the information throughout the piece [15]. Even though, Deep Learning is really good method to implement, but it needs a very large amount of labeled data in order to train the classification models to build a system [16].
3.1 Music frequency
Technically, music consists of pitches at specific frequencies [17]. Music can be created based on vibrations that can be expressed in Hertz (Hz). Frequency de-scribes the number of waves (or vibrations) at a particular time, so 1 Hz means 1 wave per second. The number of waves in second represents how high or low a sound. High tones correspond to high frequencies and low tones correspond to low frequencies as shown in Table 1.
Table 1. Note frequencies for standard tuning notes
|
Note |
Frequency (Hz) |
|
C0 |
16.35 |
|
C#0/Db0 |
17.32 |
|
D0 |
18.35 |
|
D#0/Eb0 |
19.45 |
|
E0 |
20.60 |
|
F0 |
21.83 |
|
F#0/Gb0 |
23.12 |
|
G0 |
24.50 |
|
G#0/Ab0 |
25.96 |
|
A0 |
27.50 |
|
A#0/Bb0 |
29.14 |
|
B0 |
30.87 |
|
C1 |
32.70 |
|
C#1/Db1 |
34.65 |
|
D1 |
36.71 |
|
D#1/Eb1 |
38.89 |
|
E1 |
41.20 |
|
F1 |
43.65 |
|
F#1/Gb1 |
46.25 |
|
G1 |
49.00 |
|
G#1/Ab1 |
51.91 |
|
A1 |
55.00 |
|
A#1/Bb1 |
58.27 |
|
B1 |
61.74 |
|
C2 |
65.41 |
|
C#2/Db2 |
69.30 |
|
D2 |
73.42 |
|
D#2/Eb2 |
77.78 |
|
by E2 |
82.41 |
|
F2 |
87.31 |
|
F#2/Gb2 |
92.50 |
|
G2 |
98.00 |
|
G#2/Ab2 |
103.83 |
|
A2 |
110.00 |
|
A#2/Bb2 |
116.54 |
|
B2 |
123.47 |
|
C3 |
130.81 |
|
C#3/Db3 |
138.59 |
|
D3 |
146.83 |
|
D#3/Eb3 |
155.56 |
|
E3 |
164.81 |
|
F3 |
174.61 |
|
F#3/Gb3 |
185.00 |
|
G3 |
196.00 |
|
G#3/Ab3 |
207.65 |
|
A3 |
220.00 |
|
A#3/Bb3 |
233.08 |
|
B3 |
246.94 |
|
C4 |
261.63 |
|
C#4/Db4 |
277.18 |
|
D4 |
293.66 |
|
D#4/Eb4 |
311.13 |
|
E4 |
329.63 |
|
F4 |
349.23 |
|
F#4/Gb4 |
369.99 |
|
G4 |
392.00 |
|
G#4/Ab4 |
415.30 |
|
A4 |
440.00 |
|
A#4/Bb4 |
466.16 |
|
B4 |
493.88 |
|
C5 |
523.25 |
|
C#5/Db5 |
554.37 |
|
D5 |
587.33 |
|
D#5/Eb5 |
622.25 |
|
E5 |
659.25 |
|
F5 |
698.46 |
|
F#5/Gb5 |
739.99 |
|
G5 |
783.99 |
|
G#5/Ab5 |
830.61 |
|
A5 |
880.00 |
|
A#5/Bb5 |
932.33 |
|
B5 |
987.77 |
|
C6 |
1046.50 |
|
C#6/Db6 |
1108.73 |
|
D6 |
1174.66 |
|
D#6/Eb6 |
1244.51 |
|
E6 |
1318.51 |
|
F6 |
1396.91 |
|
F#6/Gb6 |
1479.98 |
|
G6 |
1567.98 |
|
G#6/Ab6 |
1661.22 |
|
A6 |
1760.00 |
|
A#6/Bb6 |
1864.66 |
|
B6 |
1975.53 |
|
C7 |
2093.00 |
|
C#7/Db7 |
2217.46 |
|
D7 |
2349.32 |
|
D#7/Eb7 |
2489.02 |
|
E7 |
2637.02 |
|
F7 |
2793.83 |
|
F#7/Gb7 |
2959.96 |
|
G7 |
3135.96 |
|
G#7/Ab7 |
3322.44 |
|
A7 |
3520.00 |
|
A#7/Bb7 |
3729.31 |
|
B7 |
3951.07 |
|
C8 |
4186.01 |
|
C#8/Db8 |
4434.92 |
|
D8 |
4698.63 |
|
D#8/Eb8 |
4978.03 |
|
E8 |
5274.04 |
|
F8 |
5587.65 |
|
F#8/Gb8 |
5919.91 |
|
G8 |
6271.93 |
|
G#8/Ab8 |
6644.88 |
|
A8 |
7040.00 |
|
A#8/Bb8 |
7458.62 |
|
B8 |
7902.13 |
The frequencies of the notes are actually mathematically related and are determined around the center note A4 [18]; 440 Hz. The association between these frequencies is strongly related to compound interest. The frequency will double every 12 notes, when the key is the same but in a different octave. Therefore, the relation between the frequencies, can be written in Eq. (1) using the half steps away from A4 denoted by n [17].
Note frequency $(\mathrm{Hz})=440 \times 2^{\frac{n}{12}}$ (1)
3.2 Onset detection
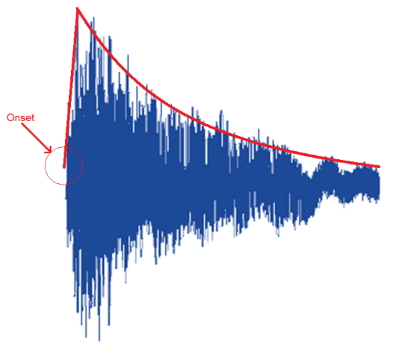
Onset detection is the process of determining the beginning of each musical notes in the audio file [19]. The onset of the note is the time when there is a sudden increase of energy at the beginning of the note as shown in Figure 1. First, this method computes the threshold spectral flow operation on the audio spectrogram and give a list that represents the amount of spectral energy that increases at each frame. The method continuous to select peak positions from the onset strength curve and give a list of onsets location.
Figure 1. Onset of a single note
3.3 Fourier transform
Fourier Transform is a method to decompose or divide the signal into a sinusoidal sum of different frequencies [20]. Fourier transform is able to show the amplitude and frequency of each of the determined sinusoids. The frequency domain of the Fourier Trans-form contains exactly the same information as the original function.
Discrete Fourier Transform offers a potential method of analysis in the digital computer. However, the trans-formation shows that if there are N data in the time function and the amplitude of the N individual sinusoid is calculated, then calculation time is proportional to N2. Even with a high-speed computer, it requires extra machine time to compute Discrete Fourier Trans-form of a large N. Therefore, Discrete Fourier Trans-form cannot be used for audio analysis, because audio contains a very large size of N.
In 1965 Cooley and Tukey published their mathematical algorithm called Fast Fourier Transform. Fast Fourier Transform is the advancement of method using the Discrete Fourier Transform. Fast Fourier Transform re-duces the calculation time to Nlog2N. This increase in calculation speed has completely revolutionized many aspects of scientific analysis.
Brigham explained that Fast Fourier Transform algorithm separates Discrete Fourier Transform into two parts as shown in Eq. (2); Even Part (n=2m) and Odd Part (n=2m+1) [20]. Then, using factorization, the equation can be written in Eq. (3). Later, the Even Part represented by the Eq. (4) and the Odd Part represented by the Eq. (5). Therefore, the Eq. (3) can be written in Eq. (6).
$D(k)=\sum_{m=0}^{m=N / 2-1} d(2 m) e^{-i \frac{2 \pi k(2 m)}{N}}+$$\sum_{m=0}^{m=N / 2-1} d(2 m+1) e^{-i \frac{2 \pi k(2 m+1)}{N}}$ (2)
$D(k)=\sum_{m=0}^{m=N / 2-1} d(2 m) e^{-i \frac{2 \pi k(2 m)}{N}}+$$e^{-i \frac{2 \pi k}{N}} \sum_{m=0}^{m=N / 2-1} d(2 m+1) e^{-i \frac{2 \pi k(2 m)}{N}}$ (3)
$E(k)=\sum_{m=0}^{m=N / 2-1} d(2 m) e^{-i \frac{2 \pi k(2 m)}{N}}$ (4)
$O(k)=\sum_{m=0}^{m=N / 2-1} d(2 m+1) e^{-i \frac{2 \pi k(2 m)}{N}}$ (5)
$D(k)=E(k)+e^{-i \frac{2 \pi k}{N}} O(k)$ (6)
To optimize the algorithm, Brigham explained that for index k+N/2 can be calculated separately using Eq. (7). Using the calculation of Euler exponential, the equation for index k+N/2 can be written in the Eq. (8). In the Eq. (8), we can find the equation of Even Part (Eq. (4)) and Odd Part (Eq. (5)). Therefore, the equation can be written in Eq. (9).
$D\left(k+\frac{N}{2}\right)=\sum_{m=0}^{m=N / 2-1} d(2 m) e^{-i \frac{2 \pi\left(k+\frac{N}{2}\right)(2 m)}{N}}+$$e^{-i \frac{2 \pi\left(k+\frac{N}{2}\right)}{N}} \sum_{m=0}^{m=N / 2-1} d(2 m+1) e^{-i \frac{2 \pi\left(k+\frac{N}{2}\right)(2 m)}{N}}$ (7)
$D\left(k+\frac{N}{2}\right)=\sum_{m=0}^{m=N / 2-1} d(2 m) e^{-i \frac{2 \pi k(2 m)}{N}}-$$e^{-i \frac{2 \pi k}{N}} \sum_{m=0}^{m=N / 2-1} d(2 m+1) e^{-i \frac{2 \pi k(2 m)}{N}}$ (8)
$D\left(k+\frac{N}{2}\right)=E(k)-e^{-i \frac{2 \pi k}{N}} O(k)$ (9)
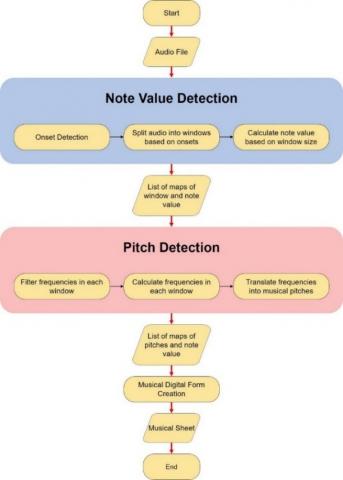
The proposed method in this study is based on Note Value Detection and Pitch Detection. The illustration of the whole system is represented in Figure 2. In general, Note Value Detection will split the audio file into several windows and calculate the note value. After Note Value Detection algorithm is performed, each window will be calculated using Pitch Detection method to obtain note name.
Figure 2. Proposed method
4.1 Note value detection
Note Value Detection can be obtain using Onset Detection that provides the list of time of the beginning of the note in the audio file. After the system provided with the list of onsets, the system will split the audio into several windows based on the onset list. The system will also calculate the note value based on the size of each window. Each note value will be mapped with the respective window.
4.2 Pitch detection
Pitch Detection will calculate the window and generate note name that can be used for musical notation. Pitch Detection in this study is using Fast Fourier Transform (FFT) that can calculate the window so the system can obtain the frequencies of each window. All the frequencies obtained from each window will be transformed to find the closest note name for the frequency. After the note names are obtained, the system will map the note name with the respective note value into a list.
4.3 Digital format creation
After Note Value Detection and Pitch Detection are performed, the final step in the system is to create a digital format. Digital format stores music information and later displays that information as a sheet music. MIDI is one of the digital formats that can store music information. Once the MIDI is created, to convert it into a musical sheet is by opening it using music application (e.g., Sibelius) or using the programming to provide the musical sheet.
5.1 Evaluation metrics
The model of this research will be evaluated using quantitative measurement. The evaluation method will be performed through the experiments with the music file. The evaluation metrics will be performed to calculate the accuracy for each music file using the modification of the evaluation metrics of Nakamura et al. [21]. The purpose of the evaluation is to see how well the system transcribe the audio into the digital format of music. There are three evaluation metrics that can be used to obtain the accuracy of the proposed system by comparing the original musical information with generated musical information in linear manner (window by window). All of the metrics are quantitative measurements that will give a percentage error rate; the smaller the error, the more accurate the system. There are three variables can be used for the accuracy of music transcription; note values, note accuracies, and noises. Note value and note accuracies are important in music transcription, different duration of the notes can change the whole song. Noise detection in music transcription is important too, because the extra note can cause confusion to the listener.
Note value can be evaluated by comparing note values (note lengths) of the original musical information with the generated musical information. The comparation of note values will be evaluated by calculating the number of incorrect note values of the generated musical sheet. Then the result of the number of incorrect note values will be divided the size of original musical sheet. The formula to evaluate note value can be written in Eq. (10).
Note value error rate $=$$\frac{\text { number of incorrect note values }}{\text { size of musical sheet }}\quad \times 100 \%$ (10)
Note accuracy can be evaluated by comparing the window of the original musical sheet with the window of the generated musical sheet one by one. First, the metric will calculate number of undetected pitches in the generated window then divided with total pitches in the original window. The calculation will be performed to each window and will be added up together and then will be divided by the size of original musical sheet. The formula to evaluate note accuracy can be written in Eq. (11).
Pitch error rate $=$$\frac{\sum \frac{\text { number of undetected notes }}{\text { number of original notes }}}{\text { size of musical sheet }}\quad \quad\times 100 \%$ (11)
Noises accuracy can be evaluated by comparing the window of the original musical sheet with the window of the generated musical sheet one by one. First, the metric will calculate number of detected noises in the generated window then divided with total pitches in the generated window. The calculation will be performed to each window and will be added up together and then will be divided by the size of original musical sheet. The formula to evaluate noises can be written in Eq. (12).
Extra note error rate $=$$\frac{\sum \frac{\text { number of extra notes }}{\text { number of detected notes }}}{\text { size of musical sheet }} \quad\quad\times 100 \%$ (12)
5.2 Evaluation file
Evaluation of the system will be performed using 5 pairs of musical sheet and audio file. The list of the songs can be seen in Table 2. These songs are selected for the experiments because all of the songs are common, so the examiners can understand the result better by comparing with the original audio file. All of the songs have two version of file; monophonic and polyphonic. So, in total there will be 10 musical sheets and audio files.
Table 2. Songs for evaluation
|
Title |
Author |
|
London Bridge is Falling Down |
The Wiggles |
|
Happy Birthday to You |
Patty Hill and Mildred Jane Hill |
|
Mary Had a Little Lamb |
Sarah Josepha Hale and John Roulston |
|
Twinkle, Twinkle, Little Star |
Jane Taylor |
|
Ode to the Joy |
Ludwig van Beethoven |
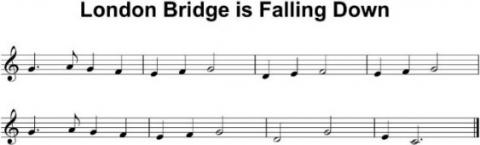
The data that will be stored in the array for evaluation is the conversion of the musical sheet. For the example of monophonic song, the conversion of the musical sheet as shown in Figure 3 can be represented in a list as shown in Table 3. Since monophonic music is only containing one note at a time, the filter variable will be assigned to find the dominant note at a time.
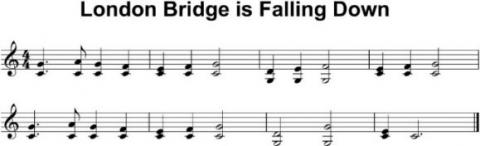
Evaluation of polyphonic music files will be performed using 5 just like the monophonic music, the evaluation is also using the songs in Table 2. but this time the songs will be polyphonic. Like the monophonic music evaluation, the data that will be stored in the array for evaluation is the conversion of the musical sheet. For the example, the conversion of the musical sheet as shown in Figure 4 can be represented in a list as shown in Table 4.
Figure 3. London bridge is falling down monophonic musical sheet
Figure 4. London bridge is falling down polyphonic musical sheet
Table 3. London bridge is falling down monophonic list representation
|
Index |
Pitches |
Note Value |
|
0 |
[G4] |
1.5 |
|
1 |
[A4] |
0.5 |
|
2 |
[G4] |
1 |
|
3 |
[F4] |
1 |
|
4 |
[E4] |
1 |
|
5 |
[F4] |
1 |
|
6 |
[G4] |
2 |
|
7 |
[D4] |
1 |
|
8 |
[E4] |
1 |
|
9 |
[F4] |
2 |
|
10 |
[E4] |
1 |
|
11 |
[F4] |
1 |
|
12 |
[G4] |
2 |
|
13 |
[G4] |
1.5 |
|
14 |
[A4] |
0.5 |
|
15 |
[G4] |
1 |
|
16 |
[F4] |
1 |
|
17 |
[E4] |
1 |
|
18 |
[F4] |
1 |
|
19 |
[G4] |
2 |
|
20 |
[D4] |
2 |
|
21 |
[G4] |
2 |
|
22 |
[E4] |
1 |
|
23 |
[C4] |
3 |
Table 4. London bridge is falling down polyphonic list representation
|
Index |
Pitches |
Note Value |
|
0 |
[C4, G4] |
1.5 |
|
1 |
[C4, A4] |
0.5 |
|
2 |
[C4, G4] |
1 |
|
3 |
[C4, F4] |
1 |
|
4 |
[C4, E4] |
1 |
|
5 |
[C4, F4] |
1 |
|
6 |
[C4, G4] |
2 |
|
7 |
[G3, D4] |
1 |
|
8 |
[G3, E4] |
1 |
|
9 |
[G4, F4] |
2 |
|
10 |
[C4, E4] |
1 |
|
11 |
[C4, F4] |
1 |
|
12 |
[C4, G4] |
2 |
|
13 |
[C4, G4] |
1.5 |
|
14 |
[C4, A4] |
0.5 |
|
15 |
[C4, G4] |
1 |
|
16 |
[C4, F4] |
1 |
|
17 |
[C4, E4] |
1 |
|
18 |
[C4, F4] |
1 |
|
19 |
[C4, G4] |
2 |
|
20 |
[G3, D4] |
2 |
|
21 |
[G3, G4] |
2 |
|
22 |
[C4, E4] |
1 |
|
23 |
[C4] |
3 |
5.3 Evaluation result
Table 5 shows the error rates for the experiments using 10 audio files (monophonic songs and polyphonic songs). Note Value Error Rate evaluates the accuracy of note value. Pitch Error Rate evaluates the accuracy of the pitch, if the error rate equals to 0% then all the pitches are detected and vice versa. Extra Note Error Rate evaluates the accuracy of the pitch too, if the error rate equals to 0% then there are no extra notes detected in the system, but if the error rate is greater than 0% then there are unwanted pitches detected in the system.
Table 5. Evaluation result
|
Song Title |
Note Value Error Rate |
Pitch Error Rate |
Extra Note Error Rate |
|
|
London Bridge is Falling Down |
Monophonic |
4.167% |
0% |
0% |
|
Polyphonic |
4.167% |
0% |
56.25% |
|
|
Happy Birthday to You |
Monophonic |
1.92% |
0% |
0% |
|
Polyphonic |
1.92% |
2.88% |
58.65% |
|
|
Mary Had a Little Lamb |
Monophonic |
3.85% |
0% |
0% |
|
Polyphonic |
3.85% |
0% |
50% |
|
|
Twinkle, Twinkle, Little Star |
Monophonic |
2.38% |
0% |
0% |
|
Polyphonic |
2.38% |
0% |
50% |
|
|
Ode to the Joy |
Monophonic |
1.62% |
0% |
0% |
|
Polyphonic |
1.62% |
0.8% |
50.8% |
|
The result shows that Note Value Error Rates give a relatively small percentage error. The incorrectly detected note value in the songs appears in the end note, because the system can’t determine when the note ended. Pitch Error Rates still occurred in the relatively small percentage error, it could happen because the system failed to detect the lower pitch notes in “Happy Birthday to You” polyphonic audio file, and in “Ode to the Joy” polyphonic audio file happened because the octave error. Extra Note Error Rate occurred in every polyphonic file; the extra notes happened a lot because there is the same note that happened in other octaves.
The problem of Music Transcription can be solved using traditional computational processing. The study is proposing a system for Automatic Music Transcription for both monophonic and polyphonic audio file with a straight forward solution, which involves Note Value Detection using Onset Detection and Pitch Detection using Fast Fourier Transform. The advantage of the method is the improvement of the implementation of Fast Fourier Transform by separating the audio file using Onset Detection. In this way, even there are some mistakes in the detection process, most of the errors are obvious and could be easily corrected. In contrast to the current widely used neural network, the method aims to break down the whole step and experiment in a clear and visible state. The performance of the proposed system can be improved by removing extra notes and increasing the number of notes of the polyphonic file. It may require a high-level technique of smoothing or filtering.
Special thanks to Bina Nusantara University through the scholarship for supporting this research work. This research is the part of the first author’s Thesis at Bina Nusantara University. This research behind it would not have been possible without the exceptional support of the first author’s supervisor, Mr. Kartowisastro as the second author, who provided insight and expertise that assisted the research. His enthusiasm, knowledge, and attention to detail have been an inspiration and kept the work on track. Special gratitude goes to the reviewers at Ingénierie des Systèmes d'Information (ISI) for the insightful comments that improved this study and corrected many errors.
[1] Sahid, S. (2020). What coronavirus has done to music industry and how they overcome it. SSRN. http://dx.doi.org/10.2139/ssrn.3590920
[2] Hviid, M., Izquierdo Sanchez, S., Jacques, S. (2017). Digitalisation and intermediaries in the music industry. SCRIPTed, 15(2). https://doi.org/10.2966/scrip.150218.242
[3] Chen, R., Liu, Y. (2020). Automatic Music Transcription. CS230: Deep Learning, Autumn 2020, Stanford University, CA. http://cs230.stanford.edu/projects_fall_2020/reports/55773193.pdf.
[4] Klapuri, A. (2006). Introduction to Music Transcription. Boston: Springer.
[5] Seetharaman, P., Pishdadian, F., Pardo, B. (2017). Music/voice separation using the 2d fourier transform. In 2017 IEEE Workshop on Applications of Signal Processing to Audio and Acoustics (WASPAA), New Paltz, NY, USA, pp. 36-40. https://doi.org/10.1109/WASPAA.2017.8169990
[6] Fitria, L., Suprapto, Y.K., Purnomo, M.H. (2015). Music transcription of Javanese Gamelan using Short Time Fourier Transform (STFT). In 2015 International Seminar on Intelligent Technology and Its Applications (ISITIA), Surabaya, Indonesia, pp. 279-284. https://doi.org/10.1109/ISITIA.2015.7219992
[7] Kusuma, D.T. (2021). Fast fourier transform (FFT) dalam transformasi sinyal frekuensi suara sebagai upaya perolehan average energy (AE) musik. PETIR, 14(1): 28-35. https://doi.org/10.33322/petir.v14i1.1022
[8] He, Z., Feng, Y. (2021). Singing transcription from polyphonic music using melody contour filtering. Applied Sciences, 11(13): 5913. https://doi.org/10.3390/app11135913
[9] Mateo, C., Talavera, J.A. (2020). Bridging the gap between the short-time Fourier transform (STFT), wavelets, the constant-Q transform and multi-resolution STFT. Signal Image and Video Processing, 14(8). https://doi.org/10.1007/s11760-020-01701-8
[10] Azizi, A., Faez, K., Delui, A.R., Rahati, S. (2009). Automatic music transcription based on wavelet transform. In International Conference on Intelligent Computing, pp. 158-165. https://doi.org/10.1007/978-3-642-04070-2_18
[11] Patil, P.R., Patil, S.A. (2018). Applications of fourier transform in engineer field. International Journal of Innovative Research in Science, Engineer, and Technology, 7(1): 11090-11098. https://doi.org/10.15680/IJIRSET.2018.0711046
[12] Sumarno, L. (2020). Chord recognition using FFT based segment averaging and subsampling feature extraction. In 2020 8th International Conference on Information and Communication Technology (ICoICT), Yogyakarta, Indonesia, pp. 1-5. https://doi.org/10.1109/ICoICT49345.2020.9166355
[13] Elbir, A., İlhan, H. O., Serbes, G., Aydın, N. (2018). Short Time Fourier Transform based music genre classification. In 2018 Electric Electronics, Computer Science, Biomedical Engineerings' Meeting (EBBT), Istanbul, Turkey, pp. 1-4. https://doi.org/10.1109/EBBT.2018.8391437
[14] Rizal, A., Handzah, V.A.P., Kusuma, P.D. (2022). Heart sounds classification using short-time Fourier transform and gray level difference method. Ingénierie des Systèmes d'Information, 27(3): 369-376. https://doi.org/10.18280/isi.270302
[15] Huang, A., Wu, R. (2016). Deep learning for music. arXiv preprint arXiv:1606.04930. https://arxiv.53yu.com/abs/1606.04930.
[16] Zhang, J. (2021). Music feature extraction and classification algorithm based on deep learning. Scientific Programming, 2021: 1651560. https://doi.org/10.1155/2021/1651560
[17] Henderson, T. (2000). Physics Classroom. https://www.physicsclassroom.com/class/sound/Lesson-2/Pitch-and-Frequency, accessed on 17 June 2022.
[18] What are the frequencies of music notes? https://www.intmath.com/trigonometric-graphs/music.php, accessed on 17 June 2022.
[19] McFee, B., Raffel, C., Liang, D., Ellis, D.P.W., Nieto, O., Mcvicar, M. (2015). Librosa: Audio and music signal analysis in python. Proc. of the 14th Python in Science Conf. (SCIPY 2015). http://dx.doi.org/10.25080/Majora-7b98e3ed-003
[20] Brigham, E.O. (1988). The Fast Fourier Transform and Its Application. New Jersey: Pretice-Hall International.
[21] Nakamura, E., Benetos, E., Yoshii, K., Dixon, S. (2018). Towards complete polyphonic music transcription: Integrating multi-pitch detection and rhythm quantization. In 2018 IEEE International Conference on Acoustics, Speech and Signal Processing (ICASSP), Calgary, AB, Canada, pp. 101-105. https://doi.org/10.1109/ICASSP.2018.8461914