Kadiyala Laxminarayanamma* | Ravilla Venkata Krishnaiah | Porika Sammulal
© 2022 IIETA. This article is published by IIETA and is licensed under the CC BY 4.0 license (http://creativecommons.org/licenses/by/4.0/).
OPEN ACCESS
Pancreatic ductal adenocarcinoma (PDAC) is one of the deadliest tumors, with just around nine percent of those diagnosed surviving for more than five years after diagnosis. A significant part of the poor result may be attributed to late detection. However, the illness is identified at an initial phase. While growths remain quite tiny and manageable, five-year existence rates can rise to as high as seventy percent. Because of this, there is a huge clinical demand for the creation of a non-invasive examination targeted at the earliest identification of PDAC, which has the ability to recover the current prospects of patients. Considering the grim future for pancreatic cancer, new strategies for early detection and prevention must be developed as rapidly as feasible. Researchers have revealed that proteomics technology is effective in discovering important biomarkers for early-stage pancreatic cancer, according to recent research. One of the most challenging difficulties is recognizing and collecting physiologically relevant information from the huge quantity of data collected when it comes to proteome profiling. Because of the tremendous complexity of proteomics datasets and the fact that they typically have minuscule sample numbers, it is vital to apply non-classical statistical approaches for data processing. Deep learning models are more effective; few efforts have lately made to identify PDAC, but the models are not developed successfully. This paper used an enhanced Convolution neural network (CNN) model to classify pancreatic decease at different stages accurately to clinical correction. The model has effective results compared to existing models.
pancreatic ductal adenocarcinoma (PDAC), CNN, artificial neural network (ANN), genomic data
In the early stages of the illness, pancreatic ductal adenocarcinoma (PDAC) [1] presents with few symptoms. However, after cancer has progressed, the symptoms become more severe. It is the sixth greatest reason for cancer humanity in both sexes combined, and most patients [2] die within two years of being diagnosed with the disease. The prognosis for individuals with PDAC is inferior, owing to a lack of early detection and appropriate therapy. According to the most recent cancer survival statistics, the overall five-year survival rate of PDAC is nine percent, the bottommost percentage of all malignancies. As a result of the changes in people's dietary habits and lifestyles that have occurred because of fast economic development, the incidence of PDAC has risen significantly in recent years, with the rate of increase increasing year after year. For their part, pathologists continue to struggle with establishing the diagnosis of PDAC, especially in well-differentiated adenocarcinoma [3], which exhibits clinical and histological characteristics like those of chronic pancreatitis. Unfortunately, many symptoms, such as significant weightiness damage, stomach discomfort, and novel start kind two diabetes [4, 5] mellitus, jaundice, and nausea, are vague and manifest themselves dawn in the sequence of the illness, making it difficult to diagnose. Patients with pancreatic cancer eligible for a possibly healing resection account for just 20% of all patients [6]. There are no practical tumor markers for use in population screening currently. Current indications for pancreatic cancer, particularly carcinoembryonic antigen, and cancer antigen, do not have enough sensitivity and specificity, according to the American Cancer Society. A more personalized approach to pancreatic cancer treatment is required, as is the development of biomarkers for therapeutic evaluation, identification of remaining or recurring disease, and even beleaguered treatment. Biomarker discovery in pancreatic cancer is thus critical for improving prognosis and treatment response rates.
Due to the large quantities of disease-specific markers found pancreatic growth matter is the greatest straight cause of proteome biomarkers for tumour diagnosis now accessible. Pancreatic tumour [7-10] muscle is the greatest straight basis of proteomic biomarkers for tumour analysis currently available. There are, however, two main reasons why it is less widely accessible for cancer screening than other methods. The availability of aggressive operation samples aimed at broadcast purposes is not always guaranteed, and percutaneous operations may result in the introduction of cancer cells into the patient's tissue. When pancreatic cancer tissue is obtainable for inspection, pathological examination is the most accurate way of establishing a definite diagnosis and is the most preferable form of treatment. Biomarker [11-15] research is being carried out now on pancreatic cancer tissue, and this study is being carried out not just for analytic determinations, then too for the growth of possible upcoming battered treatments.
The discovery of diagnostic biomarkers for differentiating between pancreatitis and pancreatic cancer has remained the topic of much research. Unfortunately, the efficacy of the diagnostic biomarkers that are now available is limited. Consequently, we need an innovative technique that may quickly and reliably diagnose PDAC [16-20] as an adjuvant diagnosis, thereby allowing for early therapy. Using urine samples, we were able to identify a panel of three protein biomarkers (REG1A, TFF1 and LYVE1) [21-25] that showed potential in identifying significant PDAC. Using many retrospectively collected samples, the urine biomarker panel and associated risk were effectively verified, and the results indicate that this is a viable method for totally non-invasive early diagnosis of prostate cancer.
Once this patient [26-32] stratification method has been tested in a prospective cohort, it may be used in scientific practice, with the possible to enhance the existing analytic route for people with prostate tumor. In current years, the development of proteomic methods has heightened interest in the therapeutic use of biomarkers in the action of pancreatic disease. But there has been little progress in the identification of suitable biomarkers for pancreatic cancer that are both complex and exact sufficient to be used therapeutically. In this research, we explore the possibility of using proteome-based biomarkers to aid in the discovery and treatment of pancreatic disease in the future. But analysis of these proteomic data required large space for storage and analysis. In the last three decades, significant advancements have been achieved in the storage and processing capacities of computers. The evolution of graphics processing units has been very fast. They provide a strong parallel processing capacity, which is particularly useful for research involving many samples. Although there has been some study on automated analysis of pancreatic data, there has been very little done in this area. It is possible that a major contributing factor is the scarcity of publicly accessible datasets including pancreatic genomic data, particularly datasets are enough to be castoff for exercise convolutional neural networks (CNNs).
In this article, we current a novel automated method aimed at identifying PDAC in from genomic data that is based on convolutional neural networks (CNNs). Our understanding to the best of our ability indicates that this is the first CNN architecture for PDAC identification to be trained on genomic dataset. The rest of this work is structured in the following manner: Our deep-learning-based PDAC diagnostic system, as well as the dataset, are introduced under Materials and Methodology. After that, the technique that was used in this research is thoroughly explained. Our experiments and findings are then presented in Experiments and Results, which is the last section of this section. Finally, in the section Debate, the results of the discussion are given.
According to Lian et al. [1], ubiquitin exact peptidase 5 (USP5) increases STAT3 signaling in pancreatic cancer cells, which results in enhanced migration and invasion. UBR5, an E3 ubiquitin ligase, has been found to promote pancreatic disease development then aerobic glycolysis through downregulating FBP1, which is achieved via instability of the C/EBP protein complex, as reported by Chen et al. [2]. Yang et al. [3] originate that USP44 overpowers the growth of pancreatic growth and overwhelms gemcitabine confrontation by deubiquitinating the FBP1 protein, which was previously thought to be toxic. No one can deny that the processes of ubiquitination and deubiquitinating are closely linked to the development of pancreatic disease. It is also needed to study the function of ubiquitination and deubiquitinating connected genetic factor in the growth of pancreatic disease.
Adenocarcinoma is the greatest communal histological subtype of pancreatic disease, owing to the absence of indications in the early stages of the illness and the fast development of the disease [4, 5]. When compared to other histological subtypes, adenocarcinoma has a higher mortality rate. It has been shown that an adenocarcinoma is the supreme shared histological subtype of pancreatic cancer and that it is linked with a high mortality rate [4, 5] because it manifests itself without presenting symptoms in the early stages of the illness and because the disease progresses rapidly. It has been shown that, in addition to the overexpression of KRAS [4, 5], the inactivation of the tumor-suppressor genes, is associated with the development of PDAC. KRAS beginning is believed toward be a contributing role to the growth of PDAC, and many attempts have been undertaken to decrease its activity [11, 12]. While this is going on, it seems to be intractable [12]. In addition to combined genome examines that have confirmed the involvement of KRAS, TP53, SMAD4, and CDKN2A in a fraction of PDAC tumors [14], comprehensive gene and protein investigations of PDAC have also been reported in the literature [13].
Because there are currently no viable treatments available and a poor overall survival rate in PDAC, researchers are continuing to look for novel biomarkers and therapeutic targets [15-17]. There have already been several gene expression alterations associated with pancreatic cancer that have been characterized and presented as biomarkers. Potential biomarkers for cancer in ribosome and spliceosome pathway genes, among other locations, have been identified [18]. The semantic of PDAC microarray data [19] revealed five indicators. Those biomarkers have been classified as either PDAC or regular samples with 94% accuracy and 89.6% specificity.
Greater computer advances like as system biology and AI enable data to be integrated and patterns recognized, leading not only in new understandings of illnesses, but also the identification of new objectives and the creation of future therapy biomarkers [20]. It has been utilized in various kinds of cancer research with promising findings to categories cancer samples based on gene expression, methylation information, and artificial intelligence. If these findings were put into practice, they would help to enhance the categorization of samples used in tumor diagnosis and subtyping [21-23]. A good classification performance has been shown in investigations employing automated techniques to predict risk or diagnosis [24-27], with sensitivity > 90 percent in most cases.
Given the wide range of characteristics generated after microarray genetic factor appearance and the methylation genomic evidence cast-off to sequence AI models for judgment of the cancer [21, 22], excellent sample classes may be achieved, reducing both training and validation samples' rates of false-negative findings. Due to the many characteristics, however, the diagnosis may only be available for selections having thousands of gene expression levels [21] because of the high number of attributes. Several studies have demonstrated that fewer criteria may provide the same or better results than hundreds of variables [28, 29].
The use of AI in pancreatic tumor necessity increases initial diagnosis and improves treatment results and patient existence. Artificial intelligence consumes remained demonstrated to forecast hazards and diagnoses using pancreatic pictures and individual strength data [30]. A logistic deterioration and artificial neural network (ANN) evaluated the forecast of pancreatic disease danger in persons by variety two diabetes, utilizing personal health information again and demonstrating the presence of replicas forecasting disease danger factors [27]. The AI models were also developed using four plasma proteins designated from the bulk ranges for the diagnosis of pancreatic cancer [25], which demonstrate the potential for artificial intelligence for forecasting the rank of an example founded on highly sensitive (90.9%) and specific (91.1%) biological markers [25]. The Lustgarten Foundation stated AI should be included in the PDAC identification using MRI and CT X-rays [32]. New methods to help prevent and diagnose pancreatic cancer must be developed because patients' overall survival would be increased. The variations in gene expression in pancreatic cancer may be used to help diagnose the illness, as well as to build an artificial intelligence computer model to forecast sample status.
Pancreatic cancer is usually not detected until a late stage because early symptoms are difficult to detect. As pancreatic tumors grow larger, they make their presence known by compressing surrounding organs, such as the bile ducts and duodenum [9]. Once the tumors are large enough to cause noticeable symptoms, the cancer has often reached an advanced stage and is virtually uncurable. Earlier symptoms of pancreatic cancer are often vague, including jaundice (a yel-lowing of the skin and eyes caused by excess bile); digestive problems caused by the tumor pressing against the stomach; back pain; unexplained weight loss; abdominal bloating; new-onset diabetes; and depression. Pancreatic cancer may also cause bio-chemical processes such as consumption of LDL (low-density lipoprotein, also known as "bad" cholesterol) by the tumour [10] and protein breakdown [11-13]. Studies suggest that these symptoms may exist years before a patient is formally diagnosed with pancreatic cancer, which gives us hope that machine learning models may be able to detect risk factors for pancreatic cancer from previous medical data [14].
Genetic and genomic processes that underlie pancreatic carcinogenesis and development have been unravelled in detail in recent years because to advancements in sequencing technology. These studies have made significant advances in our knowledge of the essential molecular processes and mechanisms, such as the driver genes that are characteristic of this tumour type and the fundamental signalling pathways to which they relate. We now have a better understanding of the timing of the occurrence of these genetic events in pancreatic cancer development and progression, as well as the significance of this knowledge for targeted treatments in the context of personalised medicine.
The PDAC was predicted in this study using the CNN model. Urine is used as the training input for the CNN. Though historically considered the most reliable source of indicators, urine has emerged as a potential alternative biological fluid [16, 17]. The dynamic range and proteome of plasma are both less than those of blood [18, 19], however when compared to blood, plasma provides a totally non-invasive sample, great capacity gathering, and the simplicity of recurrent capacities. According to the preceding statement, it is also anticipated that the continual ultrafiltration of body fluid by the organ meats would consequence in growth of at least some of the biomarkers in urine, which will result in a greater concentration of those biomarkers in urine [16]. Although this, urine is still understudied in the arena of biomarkers, despite the fact that it contains a large number of them. As a result, there is a possibility that confounding variables such as poor kidney function may have an impact on the amounts of biomarkers present in the urine, which necessitates this precaution. Despite the fact that only a few biomarker discovery studies in PDAC urine samples have been published to date, including ours [20-26], the urine proteome has been shown to have the potential to provide biomarkers for cancers other than urological cancers, such as colon cancer [27], ovarian cancer [28], lung cancer [29], and cholangiocarcinoma [30-32].
Figure 1. PDAC classification using CNN
Figure 1 illustrates the proposed PDAC classification using CNN model working. Takes the input data, and made pre-processing of the data by removing out of bound values and also fill the missing data by averaging method. After pre-processing apply CNN mode and made classification of the pancreatic data.
The urine proteome has been demonstrated to be capable of giving biomarkers for a variety of cancer types, including breast cancer and colon cancer, in addition to urological malignancies. The input to the CNN algorithm is a bio-mark dataset, and the algorithm is trained using various layers of CNN, which are depicted as follows.
3.1 Convolution neural network (CNN)
Convolutions organize the interconnections among neurons into local groups. A fully connected layer, as the name suggests, connects every input neuron to the output neuron. Generally, convolutional neural networks (CNNs) utilize fully connected layers at the end of the architecture. Deep CNNs apply various sets of considerable numbers of filters at every convolutional layer to feed the following layers. CNN layers start learning with general edges, then with the next layer, they apply filters to detect shapes. With every successive convolutional layer, CNN learns to distinguish and learn more specific features to the problem. The network uses these high-level features to make predictions. Convolutional layers usually consist of several CNN building blocks that are part of this section's next part. There are two significant advantages of CNN, local invariance and compositionality. For instance, local invariance enables the CNN classification of objects in the image without considering the object's exact location. CNNs can achieve identification of the region with the usage of pooling layers. Compositionality is the idea of creating high-level features from low-level features. This concept enables people to utilize another significant contributor to deep learning's success -transfer learning. CNN's building blocks are convolutional layer, activation, pooling layer, fully-connected/linear layer, batch normalization, and dropout. At the core of CNN is the convolutional layer, which for obvious reasons, is the most crucial block of CNN. Convolutional layers consist of filters/kernels that are set to specific widths and heights. Convolutional layer shifts or extends these kernels throughout a specified input space and applies convolutions based on specified stride (sliding the kernel window from left to right and top to bottom) and padding. These kernels generate activation maps where activation indicates the presence of filter properties such as shapes. Activation such as ReLU is applied after every convolutional layer and generally outputs a reduced, original input size. The next layer is the pooling layer that reduces parameters further and helps to prevent overfitting. Pooling kernel can reduce the input by either getting the maximum value or getting an average. While max pooling is applied in the middle of the network, average pooling is part of the last layers and sometimes can substitute the fully connected layer. As mentioned above, fully connected layer(s) are the last building in CNN architecture. Batch normalization is used to normalize the convolutional layer's activations before feeding it to the next layer. Overall, batch normalization enables an efficient training process. Dropout is the form of regularization that has the primary purpose of reducing the chances of overfitting a network by dropping the connection with inputs from the previous layer at random.
3.2 PDAC-CNN algorithm
Input: Urine bio-mark data with dimensions of w x h x d, where w denotes the width of the data point, h denotes the height of the, and d is the number of channels in the gene data.
Begin:
The first step is the convolution process.
1. Pass the input as a genomic matrix to the programme (i.e., matrix with genomic data with proteomic value).
2. Calculate the matrix K as a 3x3x1 matrix, where K is the kernel/filter with stride equal to one.
It is common to see the asterisk * symbol used to indicate convolution in mathematical notation. If we have an input data set represented by X and a filter set represented by f, then the equation would be as follows:
Z = X * f
The feature from the original data is then extracted using this method (i.e. called Convolved feature).
(The convolution layer's primary function is to extract features from the source picture.)
Activation function is applied in the second step.
1. Activation of the Rectified Linear Unit (ReLU) is performed.
f(x)=max(0,x)
This is accomplished mostly via the activation function, which converts the input to a result, which then serves as the input for the next layer.
Step 3: Creating a pooling layer
1. Over the convolved feature, a maximum pooling of window size 2x2 is applied.
2. The maximum value is assigned to each window size.
(The primary goal of this layer is to decrease the overall size while still retaining the most essential information.)
Step 4: Fully connected layer
1. Convert the output of the preceding layer (which is in matrix form) into a 1-D feature vector by using the following procedure: (or we can say column vector).
2. The feature vector is used as input for the next layer (i.e., fully connected layer).
Step 5: The last layer of connection
1. The Fed flattens the output as an input to the ANN system (Artificial Neural network).
2. The activation function of SoftMax is utilised to categorise malware families into groups.
End
The final product is the classification of the pictures into their respective families.
Dataset:
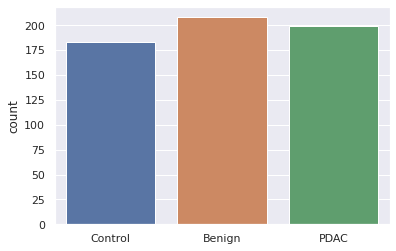
It was decided to analyse the data from 590 urine specimens that were collected retrospectively (183 control, 208 benign, and 199 PDAC). Even though there were statistically significant differences between the experimental groups in terms of the proportion of males versus females and in terms of the age of participants. Since they were differently expressed in the experimental groups in both sexes [21], we selected these urine biomarkers as our study's focus.
Here Figure 2 represents number of samples of the dataset of each label. On x-axis takes different labels like control, benign and PDAC and on y-axis takes count of each label. Control labels are 180, benign labels are 220 and conformed PDAC labels are 200.
Figure 2. Number of samples of each data item
Figure 3. Each attribute distribution of dataset
Here Figure 3 represents each attribute of data set and its distribution. Even though some of the samples were previously reported [23], modifications in the TFF1 and LYVE1 commercially obtained ELISAs (in both instances, different quantification ranges in various kit versions were observed) necessitated the re-assay of all of the samples in the current study. When comparing PDAC urine specimens at all phases to benign and control samples, the analyses revealed a statistically significant increase in the concentrations of all three biomarkers despite these discrepancies. Although biomarker levels were greater in the early stages of PDAC, this difference did not approach statistical significance in our study. This document contains a comprehensive summary of all raw data collected from ELISAs for the three biomarkers studied.
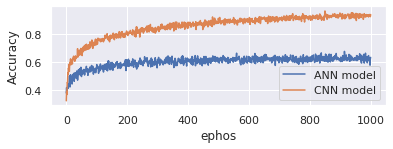
Accuracy measure indicates how well the model performs across all classes and is used to evaluate its accuracy. It is helpful when all the courses are of similar relevance to the student. Heuristics are used to compute this as the ratio of accurate guesses to the total number of forecasts.
Here Figure 4 represents the accuracy of proposed CNN model and existing ANN model. On x-axis takes epochs and y-axis represents accuracy. Evaluate the model with 1000 epochs. Proposed model is good in handling genomic data and produces 95% accuracy. Existing model onlyproduces 70%.
Figure 4. Accuracy
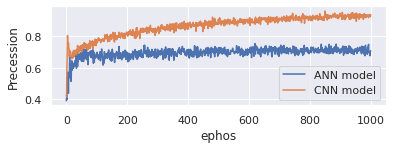
Figure 5. Precession
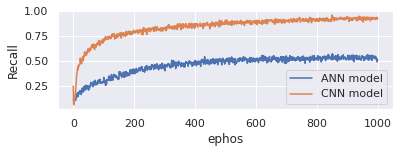
Figure 6. Recall
Presence of positive samples that were correctly classified is defined as the ratio of the number of Positive samples that were correctly classified to the total number of samples that were correctly recognised as Positive (either correctly or incorrectly). In statistics, precision is a measure of a model's ability to accurately categorise a sample as either positive or negative. Here Figure 5 represents the precession of proposed CNN model and existing ANN model. On x-axis takes epochs and y-axis represents precession. Evaluate the model with 1000 epochs. Proposed model is good in handling genomic data and produces 96% precession. Existing model onlyproduces 65%.
When calculating the recall, take the ratio of the number of Positive samples that were properly categorised as Positive to the total number of Positive samples into consideration. When a model is recalled, it indicates how well it can identify positive samples. The greater the recall, the greater the number of positive samples discovered. Here Figure 6 represents the recall comparison between proposed CNN model and existing ANN model. On x-axis takes epochs and y-axis represents recall. Evaluate the model with 1000 epochs. Proposed model is good in handling genomic data and produces 96% recall whereas existing model only produces 65%.
The F1 Score is equal to the product of 2*((precision*recall)/(precision+recall)) and the precision. It is referred to as the F Score or the F Measure in certain circles. For better or worse, the F1 score represents the balance between accuracy and recall in a given situation. Here Figure 7 represents the F1-score comparison between proposed CNN model and existing ANN model. On x-axis takes epochs and y-axis represents F1-score. Evaluate the model with 1000 epochs. Proposed model is good in handling genomic data and produces 96% F1-score whereas existing model only produces 65%.
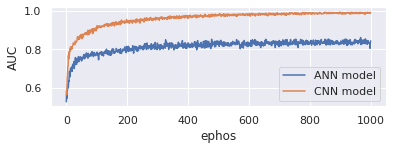
AUC (Area under the ROC Curve) offers a comprehensive performance measurement over all conceivable rating criteria. One method of understanding AUC is the likelihood that a random positive example is higher than a random negative one. Here Figure 8 represents the AUC comparison between proposed CNN model and existing ANN model. On x-axis takes epochs and y-axis represents AUC. Evaluate the model with 1000 epochs. Proposed model is good in handling genomic data and produces 97% AUC whereas existing model only produces 85%.
Figure 7. F1-score
Figure 8. Area under curve
Figure 9. Region of curve
When a classification model performs well at all classification levels, the receiver operating characteristic curve (ROC curve) is a graph that shows this (receiver operating characteristic curve). The two parameters of this curve are the True Positive Rate and the False Positive Rate, respectively. The relationship between TPR and FPR is shown by a ROC curve at different grading levels. The reduction of the grading threshold categorises more objects as positive, raising both false positives and true positives. Here Figure 9 represents the ROC comparison between proposed CNN model and existing ANN model. On x-axis takes epochs and y-axis represents ROC. Evaluate the model with 1000 epochs. Proposed model is good in handling genomic data and produces 98% ROC whereas existing model only produces 82%.
Our approach for identifying PDAC in genomic data is based on convolutional neural networks and can be used to a broad variety of genomic data samples, as shown in this article (CNNs). This is the suitable CNN architecture for PDAC detection which is important in terms of scientific advancements. We were able to successfully validate our deep-learning-based PDAC diagnosis system in many retrospectively collected samples by using a urine biomarker panel and the related detection methods. This is a viable method for totally non-invasive early diagnosis of PDAC. Once this patient stratification method has been tested in a prospective cohort, it may be used in clinical practise, with the potential to enhance the existing diagnostic route for people with prostate cancer. CNN model shows effectiveness in classification of PDAC data when compared to the existing ANN model, the experimental findings indicate that the suggested CNN model outperformed it.
[1] Lian, J., Liu, C., Guan, X., Wang, B., Yao, Y., Su, D. (2020). Ubiquitin specific peptidase 5 enhances STAT3 signaling and promotes migration and invasion in Pancreatic Cancer. Journal of Cancer, 11(23): 6802-6811. https://doi.org/10.7150/jca.48536
[2] Chen, L., Yuan, R., Wen, C., Liu, T., Feng, Q., Deng, X. (2021). E3 ubiquitin ligase UBR5 promotes pancreatic cancer growth and aerobic glycolysis by downregulating FBP1 via destabilization of C/EBPα. Oncogene, 40(2): 262-276. https://doi.org/10.1038/s41388-020-01527-1
[3] Yang, C., Zhu, S., Yang, H., Deng, S., Fan, P., Li, M., Jin, X. (2019). USP44 suppresses pancreatic cancer progression and overcomes gemcitabine resistance by deubiquitinating FBP1. American Journal of Cancer Research, 9(8): 1722-1733.
[4] Siegel, R.L., Miller, K.D., Jemal, A. (2018). Cancer statistics, 2018. CA: A Cancer Journal for Clinicians, 68: 7-30. https://doi.org/10.3322/caac.21442
[5] Hong, S.M., Park, J.Y., Hruban, R.H., Goggins, M. (2011). Molecular signatures of pancreatic cancer. Archives of Pathology & Laboratory Medicine, 135(6): 716-727. https://doi.org/10.1043/2010-0566-RA.1
[6] Collins, M.A., Bednar, F., Zhang, Y., Brisset, J.C., Galbán, S., Galbán, C.J. (2012). Oncogenic Kras is required for both the initiation and maintenance of pancreatic cancer in mice. The Journal of Clinical Investigation, 122(2): 639-653. https://doi.org/10.1172/JCI59227
[7] Wilentz, R.E., Geradts, J., Maynard, R., Offerhaus, G.J.A., Kang, M., Goggins, M. (1998). Inactivation of the p16 (INK4A) tumor-suppressor gene in pancreatic duct lesions: Loss of intranuclear expression. Cancer Research, 58(20): 4740-4744. https://doi.org/10.1002/marc.201500116
[8] Hahn, S.A., Schutte, M., Hoque, A.S., Moskaluk, C.A., Da Costa, L.T., Rozenblum, E. (1996). DPC4, a candidate tumor suppressor gene at human chromosome 18q21.1. Science, 271(5247): 350-353. https://doi.org/10.1126/science.271.5247.350
[9] Rozenblum, E., Schutte, M., Goggins, M., Hahn, S.A., Panzer, S., Zahurak, M. (1997). Tumor-suppressive pathways in pancreatic carcinoma. Cancer Research, 57(9): 1731-1734.
[10] Sahin, I.H., Iacobuzio-Donahue, C.A., O’Reilly, E.M. (2016). Molecular signature of pancreatic adenocarcinoma: an insight from genotype to phenotype and challenges for targeted therapy. Expert Opinion on Therapeutic Targets, 20(3): 341-359.https://doi.org/10.1517/14728222.2016.1094057
[11] McCormick, F. (2015). KRAS as a therapeutic target. Clinical Cancer Research, 21(8): 1797-1801. https://doi.org/10.1158/1078-0432.CCR-14-2662
[12] Zeitouni, D., Pylayeva-Gupta, Y., Der, C.J., Bryant, K.L. (2016). KRAS mutant pancreatic cancer: No lone path to an effective treatment. Cancers, 8(4): 45. https://doi.org/10.3390/cancers8040045
[13] Zhao, L., Zhao, H., Yan, H. (2018). Gene expression profiling of 1200 pancreatic ductal adenocarcinoma reveals novel subtypes. BMC Cancer, 18(1): 1-13. https://doi.org/10.1186/s12885-018-4546-8
[14] Raphael, B.J., Hruban, R.H., Aguirre, A.J., Moffitt, R.A., Yeh, J.J., Stewart, C. (2017). Integrated genomic characterization of pancreatic ductal adenocarcinoma. Cancer Cell, 32(2): 185-203. https://doi.org/10.1016/j.ccell.2017.07.007
[15] Yeo, D., He, H., Patel, O., Lowy, A.M., Baldwin, G.S., Nikfarjam, M. (2016). FRAX597, a PAK1 inhibitor, synergistically reduces pancreatic cancer growth when combined with gemcitabine. BMC Cancer, 16(1): 1-12. https://doi.org/10.1186/s12885-016-2057-z
[16] Janky, R.S., Binda, M.M., Allemeersch, J., Govaere, O., Swinnen, J.V., Roskams, T. (2016). Prognostic relevance of molecular subtypes and master regulators in pancreatic ductal adenocarcinoma. BMC Cancer, 16(1): 1-15. https://doi.org/10.1186/s12885-016-2540-6
[17] Jagadeeshan, S., Venkatraman, G., Rayala, S.K. (2016). Targeting p21 activated kinase 1 (Pak1) to PAKup pancreatic Cancer. Expert Opinion on Therapeutic Targets, 20(11): 1283-1285. https://doi.org/10.1080/14728222.2016.1239719
[18] Shen, Q., Yu, M., Jia, J.K., Li, W.X., Tian, Y.W., Xue, H.Z. (2018). Possible molecular markers for the diagnosis of pancreatic ductal adenocarcinoma. Medical Science Monitor: International Medical Journal of Experimental and Clinical Research, 24: 2368. https://doi.org/10.12659/MSM.906313
[19] Bhasin, M.K., Ndebele, K., Bucur, O., Yee, E.U., Otu, H.H., Plati, J. (2016). Meta-analysis of transcriptome data identifies a novel 5-gene pancreatic adenocarcinoma classifier. Oncotarget, 7(17): 23263-23281. https://doi.org/10.18632/oncotarget.8139
[20] Zhavoronkov, A. (2018). Artificial intelligence for drug discovery, biomarker development, and generation of novel chemistry. Mol Pharm, 15: 4311-4313. https://doi.org/10.1021/acs.molpharmaceut.8b00930
[21] Khan, J., Wei, J.S., Ringner, M., Saal, L.H., Ladanyi, M., Westermann, F. (2001). Classification and diagnostic prediction of cancers using gene expression profiling and artificial neural networks. Nature Medicine, 7(6): 673-679. https://doi.org/10.1038/89044
[22] Kim, S. (2016). Weighted K-means support vector machine for cancer prediction. Springer Plus, 5(1): 1-11. https://doi.org/10.1186/s40064-016-2677-4
[23] Golub, T.R., Slonim, D.K., Tamayo, P., Huard, C., Gaasenbeek, M., Mesirov, J.P. (1999). Molecular classification of cancer: class discovery and class prediction by gene expression monitoring. Science, 286(5439): 1-537. https://doi.org/10.1126/science.286.5439.531
[24] Alkuhlani, A., Nassef, M., Farag, I. (2017). Multistage feature selection approach for high-dimensional cancer data. Soft Computing, 21(22): 895-6906. https://doi.org/10.1007/s00500-016-2439-9
[25] Honda, K., Hayashida, Y., Umaki, T., Okusaka, T., Kosuge, T., Kikuchi, S. (2005). Possible detection of pancreatic cancer by plasma protein profiling. Cancer Research, 65(22): 0613-10622. https://doi.org/10.1158/0008-5472.CAN-05-1851
[26] Sweilam, N.H., Tharwat, A.A., Moniem, N.A. (2010). Support vector machine for diagnosis cancer disease: A comparative study. Egyptian Informatics Journal, 11(2): 81-92. https://doi.org/10.1016/j.eij.2010.10.005
[27] Hsieh, M.H., Sun, L.M., Lin, C.L., Hsieh, M.J., Hsu, C.Y., Kao, C.H. (2018). Development of a prediction model for pancreatic cancer in patients with type 2 diabetes using logistic regression and artificial neural network models. Cancer Management and Research, 10: 6317. https://doi.org/10.2147/CMAR.S180791
[28] Segal, N.H., Pavlidis, P., Antonescu, C.R., Maki, R.G., Noble, W.S., DeSantis, D. (2003). Classification and subtype prediction of adult soft tissue sarcoma by functional genomics. The American Journal of Pathology, 163(2): 691-700. https://doi.org/10.1016/S0002-9440(10)63696-6
[29] Segal, N.H., Pavlidis, P., Noble, W.S., Antonescu, C.R., Viale, A., Wesley, U.V. (2003). Classification of clear-cell sarcoma as a subtype of melanoma by genomic profiling. Journal of Clinical Oncology, 21(9): 1775-1781. https://doi.org/10.1200/JCO.2003.10.108
[30] Muhammad, W., Hart, G.R., Nartowt, B., Farrell, J.J., Johung, K., Liang, Y., Deng, J. (2019). Pancreatic cancer prediction through an artificial neural network. Frontiers in Artificial Intelligence, 2: 2. https://doi.org/10.3389/frai.2019.00002
[31] Narayana, V.L., Gopi, A.P., Chaitanya, K. (2019). Avoiding interoperability and delay in healthcare monitoring system using block chain technology. Rev. d'Intelligence Artif., 33(1): 45-48. https://doi.org/10.18280/ria.330108
[32] Zhang, G., Schetter, A., He, P., Funamizu, N., Gaedcke, J., Ghadimi, B.M. (2012). DPEP1 inhibits tumor cell invasiveness, enhances chemosensitivity and predicts clinical outcome in pancreatic ductal adenocarcinoma. PloS One, 7(2): e31507. https://doi.org/10.1371/journal.pone.0031507