Noorullah R. Mohammed | Moulana Mohammed*
© 2020 IIETA. This article is published by IIETA and is licensed under the CC BY 4.0 license (http://creativecommons.org/licenses/by/4.0/).
OPEN ACCESS
Text data clustering is performed for organizing the set of text documents into the desired number of coherent and meaningful sub-clusters. Modeling the text documents in terms of topics derivations is a vital task in text data clustering. Each tweet is considered as a text document, and various topic models perform modeling of tweets. In existing topic models, the clustering tendency of tweets is assessed initially based on Euclidean dissimilarity features. Cosine metric is more suitable for more informative assessment, especially of text clustering. Thus, this paper develops a novel cosine based external and interval validity assessment of cluster tendency for improving the computational efficiency of tweets data clustering. In the experimental, tweets data clustering results are evaluated using cluster validity indices measures. Experimentally proved that cosine based internal and external validity metrics outperforms the other using benchmarked and Twitter-based datasets.
cluster tendency, cosine based similarity measure, cosine based validity indices, hybrid topic models, twitter data clustering
Text clustering is used in many applications, including web mining, social data classification, fake news detection, etc. The critical challenging issue is to classify the text document without prior knowledge about the pre-cluster estimations [1]. Topics clustering [2] or topics based text document classification are the post clustering techniques. Topic models need prior knowledge about the cluster estimations. Authors of [3-6] presented the techniques for topic modeling of text documents for the clustering problem; however, these are underlying post text clustering techniques. State-of-the-art techniques focused on hybrid topic models [7] for the text clustering problem, which initially attempts to find the number of clusters and then finds the topics clusters of text documents.
Cluster validity measured with internal and external validity indices. The external validity indices [8-11] measure the correspondence between identified clusters and externally provided labels. The Internal validity indices [12-17] evaluate the goodness of cluster structure with partitioned data by considering compactness and separation of obtained partitioned structure. Internal validity indices are preferred in performance measures because, in most cases, prior information on the number of clusters will not be available. In previous literature, a wide variety of internal and external validity indices have been provided, which will help find the number of topics but not choose an appropriate measure, and metric to validate the cluster and not by considering the cluster elements well classified not. The most commonly used measure is Euclidean distance, which shows poor results in high dimensionality document clustering. In this paper, a novel cosine based internal and external validity metrics proposed for internally evaluating the results of a document clustering by considering into account the peculiarity of textual data [18], the closeness between documents [19], considering the lexical similarity [20], and also considered cluster classification metrics in the classification of elements in the cluster are well classified or not. Experimentally evaluated the effectiveness of proposed cluster validity metrics with benchmark and Twitter-based datasets.
Overall summary of the research is described as follows:
Different algorithms give different solutions for the same dataset by generating sub-clusters; different choice of input parameters produce different results for the same algorithm, which affects the final result in finding the optimal number of topics or clusters in the given topic document. To assess cluster obtained by used algorithm, to decide which algorithm is most suitable for the specific application, and to provide reliability to results suitable evaluation criteria under suitable measure is still needed. In most algorithms proximities, pairwise distances measured using Euclidean distance metrics are considered suitable for the lower number of dimensionality; it loses its reliability and interpretability at an increase of dimensionality. Clustering algorithms deal with distance, and distance relates to similarity/dissimilarity. The complement to Euclidean metric is cosine-based similarity metric in text classification problems which uses both magnitude and direction of vectors, which is non-negative, independent of document length and bounded between [0, 1]. One of the most exciting variations in the K-means family is spherical k-means [21], which is based on cosine-based similarity used in information retrieval, in which the effect of different lengths of documents is reduced by normalization. Given two tweet documents di and dj in a corpus, then cosine based distance similarity is given as
$\cos \left(d_{i}, d_{j}\right)=\frac{d_{i}^{T} d_{j}}{\left\|d_{i}\right\| \cdot\left\|d_{j}\right\|}$ (1)
The cosine is 1 if the documents use the same words and 0 if they have no two terms in common.
3.1 Datasets description
For the experiment, the datasets were collected from Twitter on 20 topics of health-related documents, TREC2014, TREC2015 Keyword Phrases. Tweets were collected from Twitter and the samples are described by Rajendra Prasad et al. [7], and Tweets extracted from Twitter related to 25 keyword phrases of TREC2018 [22] as described in Table 1. Experiments are implemented with Intel core i7processor @3.4 GHz, 8MB cache, 16GB RAM, 1TB HDD in IDLE (Python 3.8 64bit) environment on these four different datasets and results discussed in ensuing sections.
Table 1. TREC2018 keyword phrases based tweets documents
|
S.No. |
Datasets |
Description of Keyword Phrases |
|
1 |
2Keyword Phrases |
Women in Parliaments, Black Bear Attacks |
|
2 |
3Keyword Phrases |
Description of 2 Keyword Phares and Airport Security |
|
3 |
4Keyword Phrases |
Description of 3 Keyword Phares, and Wildlife Extinction |
|
4 |
5Keyword Phrases |
Description of 4 Keyword Phares, and Health and Computer Terminals |
|
5 |
6Keyword Phrases |
Description of 5 Keyword Phares, and, human smuggling |
|
6 |
7Keyword Phrases |
Description of 6 Keyword Phares, and, transportation tunnel disasters |
|
7 |
8Keyword Phrases |
Description of 7 Keyword Phares, and transportation tunnel disasters, piracy |
|
8 |
9Keyword Phrases |
Description of 8 Keyword Phares, and hydrogen energy |
|
9 |
10Keyword Phrases |
Description of 9 Keyword Phares, and euro opposition |
|
10 |
11Keyword Phrases |
Description of 10 Keyword Phares, and mercy killing |
|
11 |
12Keyword Phrases |
Description of 11 Keyword Phares, and tropical storms |
|
12 |
13Keyword Phrases |
Description of 12 Keyword Phares, and women clergy |
|
13 |
14Keyword Phrases |
Description of 13 Keyword Phares, and college education advantage |
|
14 |
15Keyword Phrases |
Description of 14 Keyword Phares, and women driving in Saudi Arabia |
|
15 |
16Keyword Phrases |
Description of 15 Keyword Phares, and eating invasive species |
|
16 |
17Keyword Phrases |
Description of 16 Keyword Phares, and protect Earth from asteroids |
|
17 |
18Keyword Phrases |
Description of 17 Keyword Phares, and, diabetes and toxic chemicals |
|
18 |
19Keyword Phrases |
Description of 18 Keyword Phares, and, car hacking |
|
19 |
20Keyword Phrases |
Description of 19 Keyword Phares, and, social media and teen suicide |
|
20 |
21Keyword Phrases |
Description of 20 Keyword Phares, and federal minimum wage increase.
|
|
21 |
22Keyword Phrases |
Description of 21 Keyword Phares, and eggs in a healthy diet |
|
22 |
23Keyword Phrases |
Description of 22 Keyword Phares, and email scams |
|
23 |
24Keyword Phrases |
Description of 23 Keyword Phares, and ethanol and food prices |
|
24 |
25Keyword Phrases |
Description of 24 Keyword Phares, and bacterial infection mortality rate. |
3.2 Process description
On each collected corpus, as mentioned above, the following steps are implemented:
Step1: For each Twitter-based dataset collected, preprocessing is performed using the Python Gensim library to prepare text documents for Document Clustering and classification.
Step2: Programs implemented in Python to applying hybrid Topic models [7] under Cosine based and Euclidean distance-based measures.
Step3: Document clustering and classification performed.
Step4: Assessment of document cluster with confusion atrices [23] and classification metrics by using novel cosine-based internal and external validity metrics.
Step5: Results compared with Euclideanmetrics with confusion matrices and classification metrics are done.
3.3 Performance of cluster validation
Topic modeling selection of appropriate method for implementation and assessment of clustering quality is still open challenges. Since the number of topics or clusters is not known ahead, the final results needed to be evaluated for cluster validation irrespective of the clustering model. To validate the cluster, external validation indices and internal validation indices are use internal validations, indices evaluate cluster structure with partitioned data by considering compactness and separation of obtained partitioned structure. It measures intra-cluster homogeneity, inter-cluster separability, or both. In most of the application, preliminary information of the number of clusters is not available in such scenarios internal validation indices are best suited for cluster validation. This paper presents both internal validity indices (C.A., NMI, Precision, Recall, and F-Score) and internal validity indices (DB, SI, XI, PCI, PEI, and SM) are used for performance evaluation. In addition to these validity indices, classification metrics are also used to check whether the cluster elements are well classified or not topic-wise.
Euclidean or cosine metrics find the proximities among the tweet's documents. Tweet documents having many terms in order to get the data sparsity problem. The topic models aim to derive the topics instead of the terms. Hence, finding proximities based on topics is to overcome the data sparsity problem since the number of topics is less than the number of terms of the documents. The proposed work finds the proximities-based topics instead of the terms to address the dimensionality problem in the case of text data clustering.
The experiment aims to compare the behavior of cosine based internal and external validity indices with Euclidean based indices. To perform a comparative study using different benchmark and real-time twitter-based datasets are collected. Four hybrid topic models [7] are implemented under Euclidean and cosine-based measures on each dataset. Results of the five external validity indices and six internal validity indices on every dataset have been calculated and tabulated, and a sample of compared results are shown in the form of tables and graphs.
All datasets of external and internal validity indices under cosine and Euclidean are tabulated for four hybrid topic models. Some sample results are presented in tabular and graphical forms. In Table 2, External validity index (Cluster Accuracy) of 2 keyword phrases to 25 keyword phrases of TREC2018 datasets, and Table 3, all external and internal validity indices of the TREC2014 dataset are shown. These results interpreted that cosine based external and internal validity indices perform better than Euclidean in most keyword phrases. Mainly performs well when smaller keyword phrases, as keyword phrases size increases result in values decreasing under both metrics, but consistency is still maintained in case of cosine based metrics. Higher values of results are represented in bold format.
4.1 Document clusters validation by using cosine based Measures
Evaluating compactness and separation of formed clusters is usually a Euclidean measure deployed in previous studies and external validity indices in most cases. Using this measure may be inconsistent with the criterion for getting partition for a specific algorithm. In this paper, with this motivation, novel coined-based metrics are used in document clustering algorithms using hybrid topic models and used in validating formed clusters using these metrics. Besides, that clusters have high cohesion and are well distinguished, both compactness and separation are considered.
Table 2. Sample table of external validity index clustering accuracy (C.A.)
|
Tweets Dataset |
CLUSTERING ACCURACY (CA) |
|||||||
|
EUCLIDEAN based |
COSINE based |
|||||||
|
VN |
VL |
VLS |
VPL |
VN |
VL |
VLS |
VPL |
|
|
2KPhrases |
1.000 |
0.850 |
0.575 |
0.500 |
1.000 |
0.800 |
0.675 |
0.500 |
|
3KPhrases |
1.000 |
0.500 |
0.467 |
0.375 |
1.000 |
0.625 |
0.542 |
0.442 |
|
4KPhrases |
0.888 |
0.644 |
0.494 |
0.356 |
0.931 |
0.625 |
0.481 |
0.394 |
|
5KPhrases |
0.615 |
0.495 |
0.360 |
0.310 |
1.000 |
0.465 |
0.620 |
0.335 |
|
6KPhrases |
0.521 |
0.408 |
0.329 |
0.338 |
0.767 |
0.454 |
0.383 |
0.342 |
|
7KPhrases |
0.445 |
0.407 |
0.332 |
0.300 |
0.861 |
0.321 |
0.407 |
0.268 |
|
8KPhrases |
0.644 |
0.644 |
0.644 |
0.644 |
0.813 |
0.316 |
0.397 |
0.288 |
|
9KPhrases |
0.497 |
0.406 |
0.286 |
0.275 |
0.767 |
0.317 |
0.369 |
0.289 |
|
10KPhrases |
0.538 |
0.353 |
0.273 |
0.223 |
0.593 |
0.280 |
0.383 |
0.288 |
|
11KPhrases |
0.450 |
0.266 |
0.309 |
0.198 |
0.714 |
0.268 |
0.323 |
0.239 |
|
12KPhrases |
0.456 |
0.350 |
0.319 |
0.210 |
0.679 |
0.329 |
0.425 |
0.231 |
|
13KPhrases |
0.423 |
0.221 |
0.252 |
0.250 |
0.508 |
0.288 |
0.346 |
0.202 |
|
14KPhrases |
0.373 |
0.261 |
0.239 |
0.220 |
0.645 |
0.252 |
0.377 |
0.213 |
|
15KPhrases |
0.293 |
0.207 |
0.263 |
0.200 |
0.331 |
0.175 |
0.226 |
0.148 |
|
16KPhrases |
0.411 |
0.253 |
0.263 |
0.223 |
0.570 |
0.295 |
0.377 |
0.220 |
|
17KPhrases |
0.378 |
0.210 |
0.222 |
0.213 |
0.550 |
0.288 |
0.301 |
0.244 |
|
18KPhrases |
0.310 |
0.265 |
0.275 |
0.193 |
0.515 |
0.258 |
0.403 |
0.206 |
|
19KPhrases |
0.359 |
0.222 |
0.322 |
0.197 |
0.570 |
0.299 |
0.382 |
0.245 |
|
20KPhrases |
0.343 |
0.235 |
0.213 |
0.210 |
0.524 |
0.275 |
0.421 |
0.205 |
|
21KPhrases |
0.540 |
0.150 |
0.610 |
0.145 |
0.542 |
0.139 |
0.298 |
0.137 |
|
22KPhrases |
0.472 |
0.148 |
0.501 |
0.150 |
0.482 |
0.135 |
0.310 |
0.147 |
|
23KPhrases |
0.477 |
0.160 |
0.503 |
0.141 |
0.480 |
0.145 |
0.283 |
0.145 |
|
24KPhrases |
0.477 |
0.148 |
0.485 |
0.142 |
0.478 |
0.143 |
0.316 |
0.142 |
|
25KPhrases |
0.573 |
0.153 |
0.468 |
0.143 |
0.574 |
0.134 |
0.302 |
0.146 |
VN: Visual NMF VL: Visual LDA VLS: Visual LSI VPL: Visual PLSA
Table 3. TREC2014 dataset external and internal validity indices
|
TREC2014 C.A. |
Cosine Based |
Euclidean Based |
||||||
|
VN |
VL |
VLS |
VPL |
VN |
VL |
VLS |
VPL |
|
|
2KPhrases |
1.000 |
0.975 |
1.000 |
0.750 |
1.000 |
0.975 |
0.975 |
0.700 |
|
3KPhrases |
1.000 |
0.908 |
1.000 |
0.483 |
0.983 |
0.891 |
0.983 |
0.483 |
|
4KPhrases |
1.000 |
0.725 |
1.000 |
0.450 |
0.850 |
0.825 |
0.968 |
0.443 |
|
N.M.I. |
Cosine Based |
Euclidean Based |
||||||
|
VN |
VL |
VLS |
VPL |
VN |
VL |
VLS |
VPL |
|
|
2KPhrases |
1.000 |
0.831 |
1.000 |
0.188 |
1.000 |
0.831 |
0.831 |
0.118 |
|
3KPhrases |
1.000 |
0.716 |
1.000 |
0.090 |
0.929 |
0.687 |
0.929 |
0.076 |
|
4KPhrases |
1.000 |
0.439 |
1.000 |
0.153 |
0.636 |
0.583 |
0.901 |
0.161 |
|
Precision (P) |
Cosine Based |
Euclidean Based |
||||||
|
VN |
VL |
VLS |
VPL |
VN |
VL |
VLS |
VPL |
|
|
2KPhrases |
1.000 |
1.000 |
1.000 |
0.794 |
1.000 |
1.000 |
1.000 |
0.814 |
|
3KPhrases |
1.000 |
1.000 |
1.000 |
0.460 |
1.000 |
1.000 |
0.983 |
0.460 |
|
4KPhrases |
0.993 |
0.993 |
1.000 |
0.441 |
0.670 |
0.670 |
0.968 |
0.486 |
|
Recall(R) |
Cosine Based |
Euclidean Based |
||||||
|
VN |
VL |
VLS |
VPL |
VN |
VL |
VLS |
VPL |
|
|
2KPhrases |
1.000 |
1.000 |
0.975 |
0.675 |
1.000 |
1.000 |
0.875 |
0.550 |
|
3KPhrases |
1.000 |
1.000 |
1.000 |
0.458 |
1.000 |
1.000 |
0.983 |
0.458 |
|
4KPhrases |
0.993 |
0.993 |
1.000 |
0.443 |
0.706 |
0.706 |
0.968 |
0.500 |
|
F-Score(F) |
Cosine Based |
Euclidean Based |
||||||
|
VN |
VL |
VLS |
VPL |
VN |
VL |
VLS |
VPL |
|
|
2KPhrases |
1.000 |
1.000 |
0.987 |
0.729 |
1.000 |
1.000 |
0.933 |
0.656 |
|
3KPhrases |
1.000 |
1.000 |
1.000 |
0.458 |
1.000 |
1.000 |
0.983 |
0.458 |
|
4KPhrases |
0.993 |
0.993 |
1.000 |
0.440 |
0.656 |
0.656 |
0.968 |
0.489 |
|
D.B. |
Cosine Based |
Euclidean Based |
||||||
|
VN |
VL |
VLS |
VPL |
VN |
VL |
VLS |
VPL |
|
|
2KPhrases |
0.690 |
0.765 |
0.690 |
1.229 |
0.929 |
2.874 |
0.932 |
2.025 |
|
3KPhrases |
1.306 |
1.567 |
1.316 |
4.108 |
1.845 |
2.110 |
1.878 |
5.976 |
|
4KPhrases |
1.855 |
3.876 |
1.875 |
6.184 |
3.570 |
3.903 |
2.848 |
5.465 |
|
S.I. |
Cosine Based |
Euclidean Based |
||||||
|
VN |
VL |
VLS |
VPL |
VN |
VL |
VLS |
VPL |
|
|
2KPhrases |
0.998 |
0.800 |
0.869 |
0.654 |
0.894 |
0.859 |
0.090 |
0.432 |
|
3KPhrases |
0.983 |
0.557 |
0.165 |
0.145 |
0.764 |
0.470 |
0.153 |
0.524 |
|
4KPhrases |
0.962 |
0.103 |
0.065 |
0.042 |
0.163 |
0.252 |
-0.04 |
0.243 |
|
X.I. |
Cosine Based |
Euclidean Based |
||||||
|
VN |
VL |
VLS |
VPL |
VN |
VL |
VLS |
VPL |
|
|
2KPhrases |
0.038 |
1.807 |
0.065 |
1.616 |
1.970 |
1.235 |
3.60 |
1.638 |
|
3KPhrases |
14.38 |
20.47 |
25.94 |
17.63 |
94.03 |
30.15 |
40.01 |
29.96 |
|
4KPhrases |
0.547 |
0.151 |
1.366 |
4.651 |
481.16 |
33.10 |
155.6 |
210.9 |
|
P.C.I. |
Cosine Based |
Euclidean Based |
||||||
|
VN |
VL |
VLS |
VPL |
VN |
VL |
VLS |
VPL |
|
|
2KPhrases |
0.998 |
0.929 |
0.998 |
0.938 |
0.922 |
0.947 |
0.944 |
0.927 |
|
3KPhrases |
0.978 |
0.862 |
0.968 |
0.968 |
0.851 |
0.830 |
0.847 |
0.958 |
|
4KPhrases |
0.953 |
0.712 |
0.934 |
0.905 |
0.738 |
0.684 |
0.770 |
0.872 |
|
P.E.I. |
Cosine Based |
Euclidean Based |
||||||
|
VN |
VL |
VLS |
VPL |
VN |
VL |
VLS |
VPL |
|
|
2KPhrases |
0.003 |
0.130 |
0.006 |
0.099 |
0.140 |
0.101 |
0.106 |
0.116 |
|
3KPhrases |
0.048 |
0.277 |
0.073 |
0.064 |
0.286 |
0.337 |
0.294 |
0.082 |
|
4KPhrases |
0.107 |
0.585 |
0.154 |
0.199 |
0.534 |
0.641 |
0.475 |
0.256 |
|
S.M. |
Cosine Based |
Euclidean Based |
||||||
|
VN |
VL |
VLS |
VPL |
VN |
VL |
VLS |
VPL |
|
|
2KPhrases |
0.025 |
0.038 |
0.0269 |
0.032 |
0.084 |
0.039 |
0.089 |
0.036 |
|
3KPhrases |
0.022 |
0.046 |
0.0259 |
0.025 |
0.093 |
0.056 |
0.095 |
0.026 |
|
4KPhrases |
0.022 |
0.054 |
0.0269 |
0.026 |
0.556 |
0.076 |
0.153 |
0.028 |
VN: Visual NMF VL: Visual LDA VLS: Visual LSI VPL: Visual PLSA
Consider corpus X={d1, d2, ..., dn}⸦Kp consists of n document vectors in 'p' terms space of dimension. With the help of a hybrid clustering algorithm, k number of clusters Cq (where q=1, 2, …, k) have been identified, such that each document has one of the labels identifying the k different clusters. These clustering algorithm aims to maximize intra-cluster proximities and minimize inter-cluster proximities. Let di, di', and dj be three documents in a corpus X, with di, and di' belongs to the same cluster, and dj belongs to other clusters. Compactness and separation can be calculated as follows:
Compactness $\left(C_{q}\right)=\sum_{d_{i}, d_{i^{\prime}} \in C_{q}} \text { proximities }\left(d_{i}, d_{i^{\prime}}\right)$. (2)
Separation $\left(C_{q} C_{q^{\prime}}\right)=\sum_{d_{i} \in C_{q} \atop d_{j} \in C_{q^{\prime}}} \text { proximities }\left(d_{i,} d_{j}\right)$ (3)
where proximities (.) usually the Euclidean distance.
In this paper, external validity indices Clustering Accuracy (CA), Normalized Mutual Information (NMI), Precision (P), Recall (R) and F-Score (F) [24, 25] under cosine based metrics and derived internal validity indices with cosine similarity as mentioned below i.e. Davis-Bouldin Index (DB), Silhouette Index (SI), Partition Coefficient Index (PCI), Partition Entropy Index (PEI) and Separation Measure (SM) are considered for evaluating. In internal validity indices, the Davis-Bouldin index (D.B.) depends on both data and algorithm is given as:
$D B=\frac{I}{N} \sum_{i=1}^{N} D_{i}$ (4)
where, $D_{i}=\max _{j \neq i} R_{i j} \text { and } R_{i j}=\frac{S_{i}+S_{j}}{M_{i j}}$.
Eq. (4) can be rewritten with cosine dissimilarity as:
$\mathrm{DB}_{\text {cosine }}=\frac{1}{\mathrm{~N}} \sum_{\mathrm{i}=1}^{\mathrm{N}}\left(1-\cos \left(\mathrm{D}_{\mathrm{i}}\right)\right)$ (5)
Silhouette index (S.I.) is given as
$\mathrm{S}(\mathrm{i})=\left\{\begin{array}{ll}
1-\mathrm{a}(\mathrm{i}) / \mathrm{b}(\mathrm{i}) & \text { if } \mathrm{a}(\mathrm{i})<\mathrm{b}(\mathrm{i}) \\
0 & \text { if } \mathrm{a}(\mathrm{i})=\mathrm{b}(\mathrm{i}) \\
\mathrm{b}(\mathrm{i}) / \mathrm{a}(\mathrm{i})-1 & \text { if } \mathrm{a}(\mathrm{i})>\mathrm{b}(\mathrm{i})
\end{array}\right.$ (6)
By considering cosine similarity Eq. (6) can be written as
$\mathrm{S}(\mathrm{i})_{\mathrm{cos} i n e}=\left\{\begin{array}{ll}
1-\cos (a(i) / b(i)) & \text { if } \mathrm{a}(\mathrm{i})<\mathrm{b}(\mathrm{i}) \\
0 & \text { if } \mathrm{a}(\mathrm{i})=\mathrm{b}(\mathrm{i}) \\
\cos (\mathrm{b}(\mathrm{i}) / \mathrm{a}(\mathrm{i})-1) & \text { if } \mathrm{a}(\mathrm{i})>\mathrm{b}(\mathrm{i})
\end{array}\right.$ (7)
By using these equations, calculated values of validity indices are tabulated. Higher values are represented in the bold form in the tables mentioned below. These tabulated values show a comparison between cosine and Euclidean represented in graphical form in the following sections.
Graphical representation of experimental results of External and Internal Validity indices under cosine based.
(a) Accuracy
(b) N.M.I.
(c) Precision
(d) Recall
(e) F-Score
Figure 1. External validity indices of 2Topics to 20Topics Twitter dataset under cosine metric
External validity indices (CA, NMI, Precision, Recall, and F-Score) under cosine of 2topics to 20 topics health datasets are represented as spiral graphs shown in Figure 1(a) to 1(e). All external validity indices values lies [0, 1]. Any external validity index value near value 1 performs better clustering. From Figure 1(a), Accuracy index results for 2topics to 20 topics are shown, from this spiral graph interpreted that Visual NMF and Visual LSI algorithm perform well. At 7T, 8T, 11T, and 12T visual NMF performs better than the other three methods. By observing NMI external index results shown in Figure 1(b) for most of the topics Visual LSI method performs well, whereas, for 7T, 8T, 11T, and 13T Visual NMF performance are better than other methods. In Figure 1(c) precision values are shown, from this inferred Visual NMF performs well in most of the topics except 3T to 6T, and 10T Visual LSI performs well. Recall values are shown in Figure 1(d) from which conclusion drawn except for 3T to 6T, for the rest of the topics Visual NMF performance is good. In those topics, Visual LSI performs well. In Figure 1(e) F-Score values are represented from these results inferred that both Visual NMF and Visual LSI perform well. On overall performance, both Visual NMF and Visual LSI perform well when compared to the other two methods for all five external indices values under cosine based metric.
Figure 2(a) shows the performance of Davis-Bouldin (DB) internal index values under the cosine metric of TREC2018 keyword phrases. Its values range from 0 to 40 shown on the Y-axis. In the case of this index, the minimum value will perform better clustering results. From this graph on observation, visual LSI performs better for most of the keyword phrases than other methods. In the case of 7keywords, 8keywords, 13keywords, 16keywords, 19keywords, and 20keywords Visual NMF performed better than other methods.
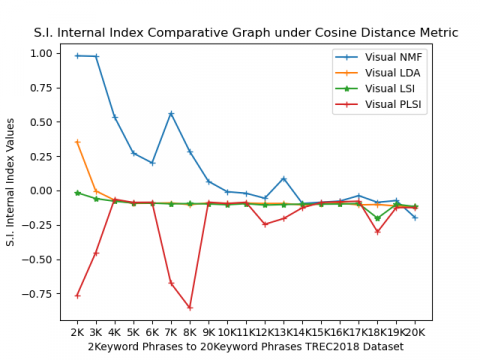
Silhouette index (SI) values range from -1 to +1. If this index value is nearer to +1 then cluster performance will be best. If values decrease from +1 to -1 its performance also decreases. From the bar graph shown in Figure 2(b) results can interpret Visual NMF under cosine performs well in all TREC2018 keyword phrases.
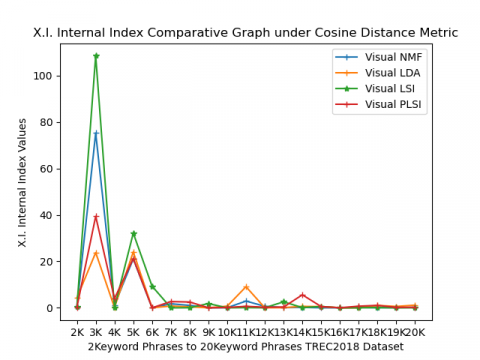
In Figure 2(c) Xie-Beni index (XI) internal validity index values under the cosine metric are represented. Its values range from 0 to 110 as represented on the Y-axis. The minimum value of this index will be considered as the best performance. From this line graph, in the case of 3keyword phrases, Visual LDA performs better than other methods; in the rest of the keyword phrases, Visual PLSI performed better than other methods.
(a) Davies-Bouldin Index (D.B.)
(b) Silhouette Index (SI)
(c) Xie-Beni Index (XI)
(d) Partition Coefficient Index (PCI)
(e) Partition Entropy Index (PEI)
(f) Separation Measure (SM)
Figure 2. TREC2018 Dataset Internal Validity Indices under cosine Metric
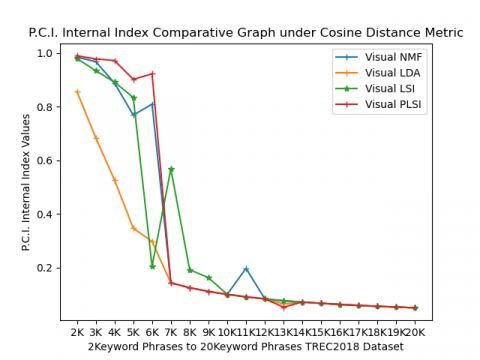
Partition coefficient index (PCI) values lie between 0 and 1. Values nearer to 1 will be treated as best. From Figure 2(d), based on PCI values under cosine metric, in the case of 7keywords and ten keywords, Visual LSI performs better, for 11keyword phrases Visual NMF performs well, and in the rest of all keyword phrases, Visual PLSI methods perform well.
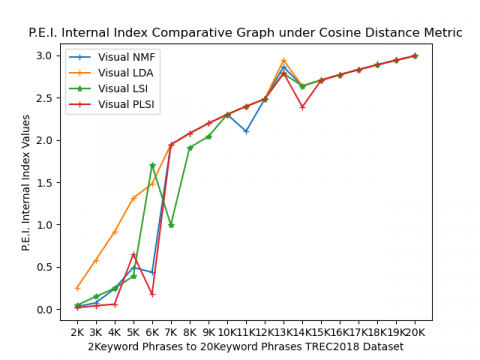
Figure 2(e) shows performance values of partition coefficient internal index values, which range from 0 to log c. In this case, its value range from 0 to 3, as indicated on the Y-axis line graph. The minimum value will be considered for higher performance in clustering. From this graph, the Visual LSI method performs well for 7 to 10 keyword phrases, for 11 and 12 keyword phrases Visual NMF and for the rest of keyword phrases Visual PLSI performs better than other methods.
Separation Measure internal index value is smaller then it will have more excellent performance. In this case, its value ranges from 0 to 10 as represented on the Y-axis. This line graph shows in Figure 2(f), 7keyword phrases, 8keywords, 11keywords, and 13keywords Visual LSI performs well and in the rest of keyword phrases, Visual PLSI under cosine metric performs better than other methods.
4.2 Comparative study of cosine based validation with Euclidean distance-based cluster validation
(a) Accuracy
(b) N.M.I.
(c) Precision
(d) Recall
(e) F-Score
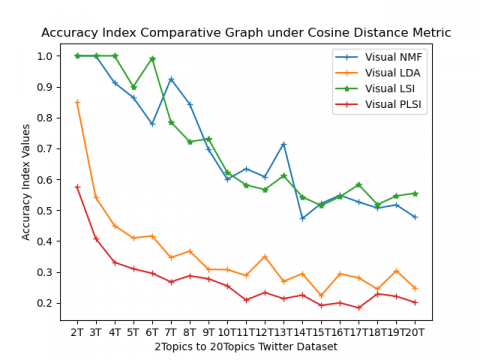
Figure 3. External validity indices Comparative results of 2Topics to 20Topics Twitter Dataset
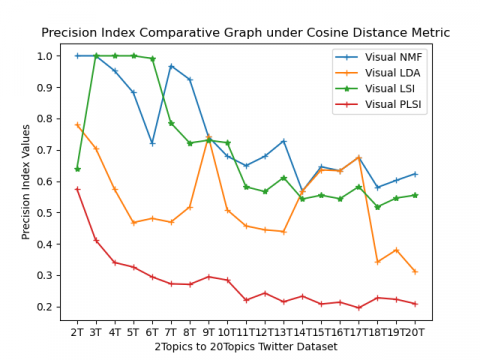
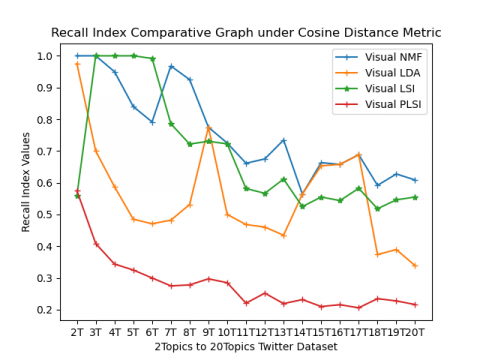
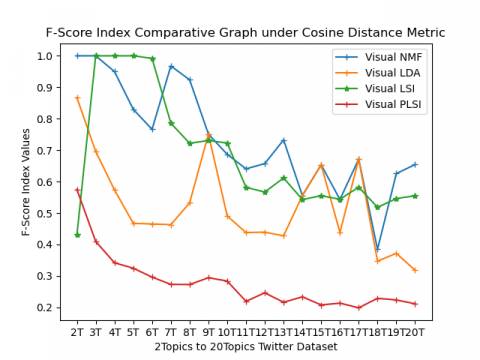
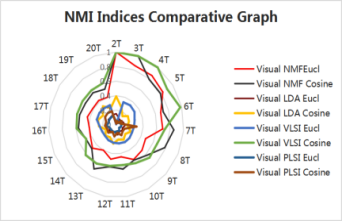
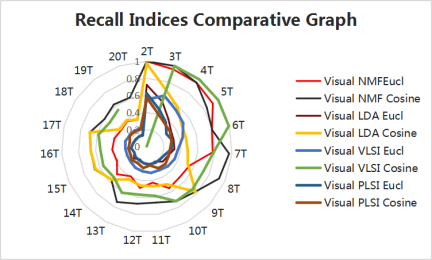
External validity indices (CA, NMI, Precision, Recall, and F-Score) comparative results of 2topics to 20 topics health datasets are represented in the form of spiral graphs as shown in Figure 3(a) to 3(e). All external validity indices values lies [0, 1]. Any external validity index value near value 1 performs better clustering. From Figure 3(a) Accuracy index results for 2topics to 20 topics are shown, from this spiral graphVisual LSI algorithm under cosine based metric performs well. At 7T, 8T, 11T, and 12T visual NMF under cosine perform better than the other three methods. By observing NMI external index results in Figure 3(b) for most of the topics Visual LSI under cosine metric performs well, whereas, for 7T, 8T, 11T, and 12T Visual NMF under cosine performance are better than other methods. In Figure 3(c) precision values are shown, from this results inferred Visual LSI under cosine metric performs well in most of the topics except 7T, 8T, 12T, and 13T Visual NMF under cosine perform, whereas at 14 Visual NMF under Euclidean perform well when compared to all other methods. Recall values are shown in Figure 3(d) from which the conclusion is drawn that both Visual NMF and Visual LSI under cosine metric perform equally. In Figure 3(e) F-Score values are represented from this can inferred that both Visual NMF and Visual LSI under cosine metric perform well. On overall performance, both Visual NMF and Visual LSI under cosine metric perform well when compared Euclidean for all five external indices value.
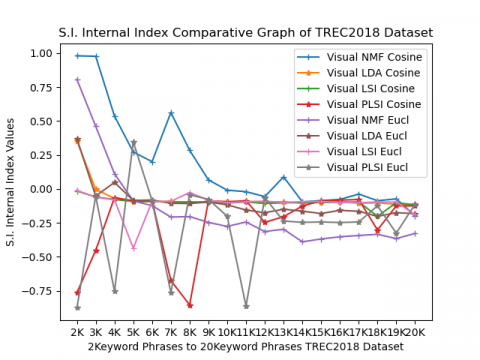
Figure 4(a) shows comparative performance results of Davis-Bouldin (DB) internal index values under Cosine and Euclidean metrics of TREC2018 keyword phrases. Its values range from 0 to 70 shown on the Y-axis. In the case of this index, the minimum value will be considered for better clustering results. Form this graph on observation, 2keywords to 6keywords, 9keywords to 12keywords, 14keywords and 17keywords visual LSI under cosine perform well, for 18keyword phrases visual NMF performs best and rest of keyword phrases Visual NMF under Cosine performs better than other models. Silhouette index (SI) values range from -1 to +1. If this index value is nearer to +1 then cluster performance will be best. If values decrease from +1 to -1 its performance also decreases. From the line graph as shown in Figure 4(b) interpreted that Visual NMF under cosine performs well in all TREC2018 keyword phrases, except 5keyword phrases where Visual NMF under Euclidean performs well.
In Figure 4(c) Xie-Beni index (XI) internal validity index values under cosine and Euclidean metric are represented. Its values range from 0 to 110 as represented on the Y-axis. The minimum value of this index will be considered as the best performance. From this line graph, in the case of 2keyword phrases to 5keyword phrases, visual LDA under Euclidean performs well, and the rest of the keyword phrases of TREC2018 datasets visual PLSI under Cosine metric performs better than other methods and also better than Euclidean distance metric.
Partition coefficient index (PCI) values lie between 0 and 1. Maximum values will be considered as better performance; values nearer to 1 will be treated as best. From Figure 4(d), based on PCI comparative result values under Cosine and Euclidean metrics, interpret that 2keyword phrases to 6keyword phrases visual PLSI under cosine metric performance is good, for 8keywords, 10keywords, 14keywords, and 17keyword phrases visual NMF under Euclidean metric, and for the rest of keyword phrases, visual LSI under Cosine metric performs well.
(a) Davies-Bouldin index (D.B.) comparative results
(b) Silhouette index(SI) comparative results
(c) Xie-Beni index(XI) comparative results
(d) Partition coefficient Index (PCI) comparative results
(e) Partition entropy index (PEI) comparative results
(f) Separation measure (SM) comparative results
Figure 4. TREC2018 internal validity indices
Figure 4(e) shows comparative performance values of partition coefficient internal index values, which range from 0 to log c. In this case, its value range from 0 to 3 as indicated on the Y-axis line graph. The minimum value will be considered for higher performance in clustering. From this graph, infer that for 2 to 4keywords, 6keywords visual PLSI under Cosine, for 5keywors, 7keywords visual LSI under cosine, and 8keywords, 10keywords, 14keywords, and 17keywords visual NMF under Euclidean and rest of keywords visual LSI under Euclidean perform better.
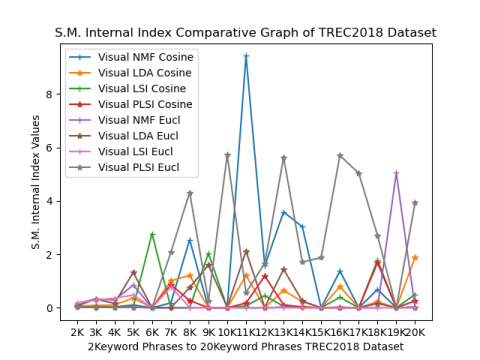
Separation Measure internal index value is smaller then it will have greater performance. In this case, its value ranges from 0 to 10 as represented on the Y-axis. From this line graph, as shown in Figure 4(f), 2keyword phrases to 5keyword phrases visual LDA under Euclidean perform better and for the rest of keyword phrases, visual PLSI under cosine metric perform better than other models and also compared to Euclidean distance.
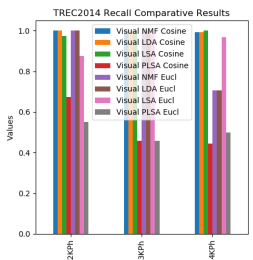
In Figure 5(a) to 5(d) external validity indices comparative results are shown. All external validity index value lies between 0 and 1. If values are nearer to 1, it indicates useful clustering, and appropriated keywords are placed in the appropriate cluster. From these bar graphs, interpret in all external validity indices visual NMF, visual LSI, and visual LDA under cosine metrics perform well, and their values are near to 1.
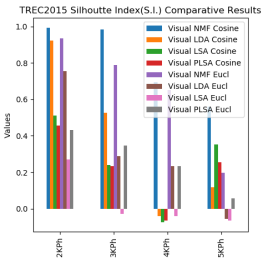
Figure 6(a) shows the comparative performance values of Davis-Bouldin (DB) internal index values under the coined and Euclidean metrics of TREC2015 keyword phrases. Its values range from 0 to 15 shown on the Y-axis. In the case of this index, the minimum value will perform better clustering results. Form this graph on observation, inferred that visual NMF under cosine metric performs well when compared to the Euclidean metric for all models. Silhouette internal index (SI) values range from -1 to +1. If this index value is nearer to +1 then cluster performance will be best. If values decrease from +1 to -1 its performance also decreases. From the line graph as shown in Figure 6(b) Visual NMF under cosine metric performs well in all TREC2015 keyword phrases than that of Euclidean distance metric.
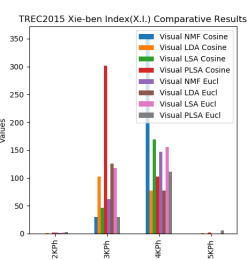
In Figure 6(c) Xie-Beni index (XI) internal validity index values under cosine and Euclidean metric are represented. Its values range from 0 to 300 as represented on the Y-axis. The minimum value of this index will be considered as the best performance. This line-graph results were interpreted for 2keyword phrases and 3keyword phrases visual NMF performs well, whereas for 4keyword phrases and 5keyword phrases of TREC2015 visual LDA performs well. In all cases performs is better under cosine based validity index than Euclidean metric based. Partition coefficient index (PCI) values lie between 0 and 1. Maximum values will be considered as better performance, values nearer to 1 will be treated as best. From Figure 6(d), based on PCI comparative result values under Cosine and Euclidean metrics, Visual NMF, and Visual LSI both methods values are more significant than that of other values under Cosine metric based validity indices.
(a) Accuracy Comparative
(b) N.M.I. comparative
(c) Recall Comparative
(d) F-Score Comparative
Figure 5. TREC2014 external validity indices comparative results
(a) Davies-BouldinIndex (DB)
(b) Silhoutte Index (SI)
(c) Xie-Beni Index (XI)
(d) Partition Coefficient (PCI)
(e) PartitionEntropyIndex (PEI)
(f) Separation Measure (SM)
Figure 6. TREC2015 Internal validity indices comparative results
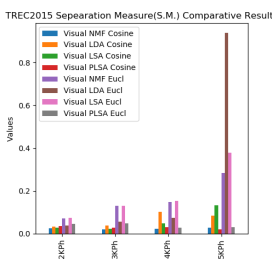
Figure 6(e) shows comparative performance values of partition coefficient internal index values, ranging from 0 to log c. Its value ranges from 0 to 1.2 as the number of keywords considered is only four, indicated on the Y-axis line graph. The minimum value will be considered for higher performance in clustering. From this graph, visual NMF values under cosine metric are more significant than that of Euclidean distance-based metrics. Separation Measure internal index value is smaller then it will have more remarkable performance.
In this case, its value ranges from 0 to 1 as represented on the Y-axis. This line graph shows in Figure 6(f), for 2keyword phrases and 3keyword phrases visual NMF, in case of 4keyword phrases, and 5 keyword phrases visual LDA. Both methods have better values under Cosine based metric validity index values than that of Euclidean based metric validity index values.
4.3 Cluster classification metrics to check elements in the cluster
4.3.1 External validity indices under cosine metric based on cluster classification metrics
In sections 4.2 and 4.3, cluster validity indices are calculated based on the confusion matrix and the number of clusters. Previous studies also cluster validation done using confusion matrices but not considered the elements in the cluster are well classified. In this paper, cluster validation is done by considering both confusion matrices and classification metrics to see that elements in the cluster are well classified or not. Cluster classification metrics are tabulated for all datasets for all four models under Cosine based and Euclidean metrics. Some sample results are represented from Table 4 to Table 9 for different datasets. In Table 4, external validity indices Precision (P), Recall (R), F-Score (F), Accuracy, Macro Average (M.A.), and Weighted Average (W.A.) of 7 Topics Twitter datasets based on Cluster Classification under Cosine metric is presented. Here, seven topics are treated as seven clusters, and external validity indices results for each cluster are represented by considering every document in that particular cluster where Support (SU) represents the number of documents present in that cluster.
Table 5, external validity indices of 10 Topics Twitter datasets for Visual NMF and Visual LDA hybrid topic models based on Cluster Classification metrics under Cosine metric, is tabulated. Here, ten topics are treated as ten clusters, and external validity indices results for each cluster are represented by considering every document in that particular cluster where Support (SU) represents the number of documents present in that cluster.
4.3.2 Comparative results of external validity indices based on cluster classification
In this paper, a comparative study of external validity indices based on cluster classifications metrics also performed for different hybrid topic models under Cosine based and Euclidean based metrics. Experimental results are tabulated for all types of datasets mentioned in the datasets description section. Sample of comparative results of external validity indices based on cluster classification for 20 keyword phrases of TREC2018 datasets is mentioned in Table 6 to Table 9.
Table 4. External validity indices based on cluster classification of 7 topics Twitter datasets
|
Visual LSI under Cosine metric |
Visual PLSI under Cosine metric |
||||||||
|
Cl # |
P |
R |
F |
SU |
Cl # |
P |
R |
F |
SU |
|
1 |
0.550 |
0.550 |
0.550 |
40 |
1 |
0.250 |
0.250 |
0.250 |
40 |
|
2 |
0.350 |
0.350 |
0.350 |
40 |
2 |
0.300 |
0.300 |
0.300 |
40 |
|
3 |
0.625 |
0.625 |
0.625 |
40 |
3 |
0.325 |
0.325 |
0.325 |
40 |
|
4 |
0.525 |
0.525 |
0.525 |
40 |
4 |
0.275 |
0.275 |
0.275 |
40 |
|
5 |
0.675 |
0.675 |
0.675 |
40 |
5 |
0.225 |
0.225 |
0.225 |
40 |
|
6 |
0.700 |
0.700 |
0.700 |
40 |
6 |
0.200 |
0.200 |
0.200 |
40 |
|
7 |
0.200 |
0.200 |
0.200 |
40 |
7 |
0.225 |
0.225 |
0.225 |
40 |
|
Accuracy |
|
0.518 |
280 |
Accuracy |
|
0.257 |
280 |
||
|
M.A |
0.518 |
0.518 |
0.518 |
280 |
M.A |
0.257 |
0.257 |
0.257 |
280 |
|
W.A |
0.518 |
0.518 |
0.518 |
280 |
W.A |
0.257 |
0.257 |
0.257 |
280 |
CL#: Cluster Number; P: Precision; R: Recall; F: F-Score; SU: Support; M.A.: Macro Average; W.A.: Weighted Average
Table 5. External validity indices based on cluster classification metrics of10 topics Twitter datasets
|
Visual NMF under Cosine metric |
Visual LDA under Cosine metric |
||||||||
|
Cl # |
P |
R |
F |
SU |
Cl # |
P |
R |
F |
SU |
|
1 |
0.800 |
0.800 |
0.800 |
50 |
1 |
0.240 |
0.240 |
0.240 |
50 |
|
2 |
0.400 |
0.600 |
0.480 |
20 |
2 |
0.200 |
0.150 |
0.171 |
20 |
|
3 |
0.714 |
0.385 |
0.500 |
65 |
3 |
0.246 |
0.246 |
0.246 |
65 |
|
4 |
0.457 |
0.457 |
0.457 |
35 |
4 |
0.157 |
0.314 |
0.210 |
35 |
|
5 |
0.822 |
0.529 |
0.643 |
70 |
5 |
0.257 |
0.129 |
0.171 |
70 |
|
6 |
0.550 |
0.244 |
0.338 |
45 |
6 |
0.229 |
0.178 |
0.200 |
45 |
|
7 |
0.323 |
0.700 |
0.442 |
30 |
7 |
0.133 |
0.133 |
0.133 |
30 |
|
8 |
0.543 |
0.543 |
0.543 |
35 |
8 |
0.111 |
0.143 |
0.125 |
35 |
|
9 |
0.247 |
0.514 |
0.343 |
35 |
9 |
0.229 |
0.229 |
0.229 |
35 |
|
10 |
0.000 |
0.000 |
0.000 |
15 |
10 |
0.100 |
0.133 |
0.114 |
15 |
|
Accuracy |
|
0.497 |
400 |
Accuracy |
|
0.195 |
280 |
||
|
M.A |
0.487 |
0.477 |
0.455 |
400 |
M.A |
0.190 |
0.189 |
0.184 |
400 |
|
W.A |
0.576 |
0.497 |
0.507 |
400 |
W.A |
0.208 |
0.195 |
0.195 |
400 |
CL#: Cluster Number; P: Precision; R: Recall; F: F-Score; SU: Support; M.A.: Macro Average; W.A.: Weighted Average
Table 6. Comparative results of validity indices (Visual NMF) based on Cluster Classification for 20 Keyword Phrases of TREC2018 Datasets
|
Visual NMF under Cosine metric |
Visual NMF under Eucl metric |
||||||||
|
Cl # |
P |
R |
F |
SU |
Cl # |
P |
R |
F |
SU |
|
1 |
0.740 |
0.740 |
0.740 |
50 |
1 |
0.740 |
0.740 |
0.740 |
50 |
|
2 |
0.300 |
0.375 |
0.333 |
40 |
2 |
0.300 |
0.375 |
0.333 |
40 |
|
3 |
0.306 |
0.578 |
0.400 |
45 |
3 |
0.306 |
0.578 |
0.400 |
45 |
|
4 |
0.200 |
0.200 |
0.200 |
35 |
4 |
0.200 |
0.200 |
0.200 |
35 |
|
5 |
0.440 |
0.367 |
0.400 |
30 |
5 |
0.440 |
0.367 |
0.400 |
30 |
|
6 |
0.543 |
0.224 |
0.317 |
85 |
6 |
0.543 |
0.224 |
0.317 |
85 |
|
7 |
0.733 |
0.440 |
0.550 |
50 |
7 |
0.733 |
0.440 |
0.550 |
50 |
|
8 |
0.880 |
0.400 |
0.550 |
55 |
8 |
0.880 |
0.400 |
0.550 |
55 |
|
9 |
0.289 |
0.371 |
0.325 |
35 |
9 |
0.289 |
0.371 |
0.325 |
35 |
|
10 |
0.000 |
0.000 |
0.000 |
15 |
10 |
0.000 |
0.000 |
0.000 |
15 |
|
11 |
0.000 |
0.000 |
0.000 |
30 |
11 |
0.000 |
0.000 |
0.000 |
30 |
|
12 |
0.325 |
0.650 |
0.433 |
20 |
12 |
0.325 |
0.650 |
0.433 |
20 |
|
13 |
0.129 |
0.360 |
0.189 |
25 |
13 |
0.129 |
0.360 |
0.189 |
25 |
|
14 |
0.600 |
0.514 |
0.554 |
35 |
14 |
0.600 |
0.514 |
0.554 |
35 |
|
15 |
0.400 |
0.286 |
0.333 |
70 |
15 |
0.400 |
0.286 |
0.333 |
70 |
|
16 |
0.771 |
0.600 |
0.675 |
45 |
16 |
0.771 |
0.600 |
0.675 |
45 |
|
17 |
0.436 |
0.480 |
0.453 |
50 |
17 |
0.436 |
0.480 |
0.453 |
50 |
|
18 |
0.086 |
0.086 |
0.086 |
35 |
18 |
0.086 |
0.086 |
0.086 |
35 |
|
19 |
0.511 |
0.920 |
0.657 |
25 |
19 |
0.511 |
0.920 |
0.657 |
25 |
|
20 |
0.067 |
0.040 |
0.050 |
25 |
20 |
0.067 |
0.040 |
0.050 |
25 |
|
Accuracy |
|
0.388 |
800 |
Accuracy |
|
0.388 |
800 |
||
|
M.A |
0.388 |
0.382 |
0.362 |
800 |
M.A |
0.388 |
0.382 |
0.362 |
800 |
|
W.A |
0.446 |
0.388 |
0.392 |
800 |
W.A |
0.446 |
0.388 |
0.392 |
800 |
CL#: Cluster Number; P: Precision; R: Recall; F: F-Score; SU: Support; M.A.: Macro Average; W.A.: Weighted Average
Table 7. Comparative results of validity indices (Visual LDA) based on Cluster Classification for 20 Keyword Phrases of TREC2018 Datasets
|
Visual LDA under Cosine metric |
Visual LDA under Eucl metric |
||||||||
|
Cl # |
P |
R |
F |
SU |
Cl # |
P |
R |
F |
SU |
|
1 |
0.171 |
0.120 |
0.141 |
50 |
1 |
0.160 |
0.160 |
0.160 |
50 |
|
2 |
0.109 |
0.150 |
0.126 |
40 |
2 |
0.167 |
0.125 |
0.143 |
40 |
|
3 |
0.100 |
0.111 |
0.105 |
45 |
3 |
0.171 |
0.133 |
0.150 |
45 |
|
4 |
0.160 |
0.144 |
0.133 |
35 |
4 |
0.100 |
0.200 |
0.133 |
35 |
|
5 |
0.086 |
0.100 |
0.092 |
30 |
5 |
0.150 |
0.100 |
0.120 |
30 |
|
6 |
0.167 |
0.100 |
0.125 |
85 |
6 |
0.212 |
0.212 |
0.212 |
85 |
|
7 |
0.167 |
0.100 |
0.125 |
50 |
7 |
0.160 |
0.080 |
0.107 |
50 |
|
8 |
0.171 |
0.218 |
0.192 |
55 |
8 |
0.171 |
0.109 |
0.133 |
55 |
|
9 |
0.100 |
0.086 |
0.092 |
35 |
9 |
0.156 |
0.200 |
0.175 |
35 |
|
10 |
0.120 |
0.200 |
0.150 |
15 |
10 |
0.080 |
0.133 |
0.100 |
15 |
|
11 |
0.100 |
0.067 |
0.080 |
30 |
11 |
0.133 |
0.067 |
0.089 |
30 |
|
12 |
0.067 |
0.050 |
0.057 |
20 |
12 |
0.080 |
0.200 |
0.114 |
20 |
|
13 |
0.114 |
0.160 |
0.133 |
25 |
13 |
0.109 |
0.240 |
0.150 |
25 |
|
14 |
0.111 |
0.143 |
0.125 |
35 |
14 |
0.222 |
0.286 |
0.250 |
35 |
|
15 |
0.150 |
0.086 |
0.109 |
70 |
15 |
0.286 |
0.143 |
0.190 |
70 |
|
16 |
0.143 |
0.111 |
0.125 |
45 |
16 |
0.143 |
0.111 |
0.125 |
45 |
|
17 |
0.244 |
0.220 |
0.232 |
50 |
17 |
0.200 |
0.100 |
0.133 |
50 |
|
18 |
0.220 |
0.314 |
0.259 |
35 |
18 |
1.100 |
0.143 |
0.118 |
35 |
|
19 |
0.120 |
0.120 |
0.120 |
25 |
19 |
0.100 |
0.160 |
0.123 |
25 |
|
20 |
0.100 |
0.200 |
0.133 |
25 |
20 |
0.067 |
0.080 |
0.073 |
25 |
|
Accuracy |
|
0.142 |
800 |
Accuracy |
|
0.149 |
800 |
||
|
M.A |
0.136 |
0.142 |
0.135 |
800 |
M.A |
0.148 |
0.149 |
0.140 |
800 |
|
W.A |
0.145 |
0.142 |
0.140 |
800 |
W.A |
0.166 |
0.149 |
0.149 |
800 |
CL#: Cluster Number; P: Precision; R: Recall; F: F-Score; SU: Support; M.A.: Macro Average; W.A.: Weighted Average
Comparative results of validity indices of 20 keyword phrases of TREC2018 for Visual NMF hybrid topic model is mentioned in Table 6. From these results inferred that both results are the same under two distance metrics for all twenty clusters.
In Table 7, comparative results of validity indices are shown under cosine and Euclidean based metrics for the Visual LDA model. From these results, interpreted Euclidean based metric on average for all clusters perform better than cosine based metric.
Table 8. Comparative results of validity indices (Visual LSI) based on Cluster Classification for 20 Keyword Phrases of TREC2018 Datasets
|
Visual LSI under Cosine metric |
Visual LSI under Euclidean metric |
||||||||
|
Cl # |
P |
R |
F |
SU |
Cl # |
P |
R |
F |
SU |
|
1 |
0.200 |
0.140 |
0.165 |
50 |
1 |
0.840 |
0.420 |
0.560 |
50 |
|
2 |
0.200 |
0.150 |
0.171 |
40 |
2 |
0.340 |
0.425 |
0.378 |
40 |
|
3 |
0.380 |
0.422 |
0.400 |
45 |
3 |
0.375 |
0.333 |
0.353 |
45 |
|
4 |
0.200 |
0.143 |
0.167 |
35 |
4 |
0.600 |
0.429 |
0.500 |
35 |
|
5 |
0.300 |
0.300 |
0.300 |
30 |
5 |
0.100 |
0.067 |
0.080 |
30 |
|
6 |
0.660 |
0.388 |
0.489 |
85 |
6 |
0.486 |
0.200 |
0.283 |
85 |
|
7 |
0.240 |
0.120 |
0.160 |
50 |
7 |
0.133 |
0.080 |
0.100 |
50 |
|
8 |
0514 |
0.327 |
0.400 |
55 |
8 |
0.422 |
0.345 |
0.080 |
55 |
|
9 |
0.200 |
0.229 |
0.213 |
35 |
9 |
0.540 |
0.771 |
0.635 |
35 |
|
10 |
0.222 |
0.667 |
0.333 |
15 |
10 |
0.000 |
0.000 |
0.000 |
15 |
|
11 |
0.000 |
0.000 |
0.000 |
30 |
11 |
0.171 |
0.200 |
0.185 |
30 |
|
12 |
0.200 |
0.350 |
0.255 |
20 |
12 |
0.267 |
0.600 |
0.369 |
20 |
|
13 |
0.086 |
0.240 |
0.126 |
25 |
13 |
0.133 |
0.080 |
0.100 |
25 |
|
14 |
0.080 |
0.057 |
0.067 |
35 |
14 |
0.388 |
0.943 |
0.550 |
35 |
|
15 |
0.235 |
0.286 |
0.258 |
70 |
15 |
0.329 |
0.329 |
0.329 |
70 |
|
16 |
0.400 |
0.489 |
0.440 |
45 |
16 |
0.333 |
0.222 |
0.267 |
45 |
|
17 |
0.089 |
0.080 |
0.084 |
50 |
17 |
0.686 |
0.480 |
0.565 |
50 |
|
18 |
0114 |
0.114 |
0.114 |
35 |
18 |
0.540 |
0.771 |
0.635 |
35 |
|
19 |
0.150 |
0.120 |
0.133 |
25 |
19 |
0.171 |
0.240 |
0.200 |
25 |
|
20 |
0.200 |
0.400 |
0.267 |
25 |
20 |
0.364 |
0.800 |
0.500 |
25 |
|
Accuracy |
|
0.249 |
800 |
Accuracy |
|
0.375 |
800 |
||
|
M.A |
0.234 |
0.251 |
0.227 |
800 |
M.A |
0.361 |
0.387 |
0.348 |
800 |
|
W.A |
0.273 |
0.249 |
0.248 |
800 |
W.A |
0.398 |
0.375 |
0.361 |
800 |
CL#: Cluster Number; P: Precision; R: Recall; F: F-Score; SU: Support; M.A.: Macro Average; W.A.: Weighted Average
Table 9. Comparative results of validity indices (Visual PLSI) based on cluster classification for 20 keyword phrases of TREC2018 datasets
|
Visual PLSI under Cosine metric |
Visual PLSI under Euclidean metric |
||||||||
|
Cl # |
P |
R |
F |
SU |
Cl # |
P |
R |
F |
SU |
|
1 |
0.200 |
0.180 |
0.189 |
50 |
1 |
0.200 |
0.200 |
0.200 |
50 |
|
2 |
0.140 |
0.175 |
0.156 |
40 |
2 |
0.080 |
0.050 |
0.062 |
40 |
|
3 |
0.111 |
0.111 |
0.111 |
45 |
3 |
0.267 |
0.267 |
0.267 |
45 |
|
4 |
0.160 |
0.229 |
0.188 |
35 |
4 |
0.067 |
0.086 |
0.075 |
35 |
|
5 |
0.100 |
0.233 |
0.140 |
30 |
5 |
0.114 |
0.133 |
0.123 |
30 |
|
6 |
0.300 |
0.106 |
0.157 |
85 |
6 |
0.176 |
0176 |
0.176 |
85 |
|
7 |
0.114 |
0.080 |
0.094 |
50 |
7 |
0.167 |
0.100 |
0.125 |
50 |
|
8 |
0.164 |
0.164 |
0.164 |
55 |
8 |
0.200 |
0.127 |
0.156 |
55 |
|
9 |
0.100 |
0.057 |
0.073 |
35 |
9 |
0.100 |
0.057 |
0.073 |
35 |
|
10 |
0.100 |
0.267 |
0.145 |
15 |
10 |
0.060 |
0.200 |
0.092 |
15 |
|
11 |
0.114 |
0.133 |
0.123 |
30 |
11 |
0.160 |
0.133 |
0.145 |
30 |
|
12 |
0.029 |
0.050 |
0.036 |
20 |
12 |
0.133 |
0.100 |
0.144 |
20 |
|
13 |
0.120 |
0.120 |
0.120 |
25 |
13 |
0.100 |
0.160 |
0.123 |
25 |
|
14 |
0.160 |
0.114 |
0.133 |
35 |
14 |
0.114 |
0.114 |
0.114 |
35 |
|
15 |
0.165 |
0.200 |
0.181 |
70 |
15 |
0.200 |
0.200 |
0.200 |
70 |
|
16 |
0.133 |
0.089 |
0.107 |
45 |
16 |
0.127 |
0.156 |
0.140 |
45 |
|
17 |
0.171 |
0.120 |
0.141 |
50 |
17 |
0.171 |
0.120 |
0.141 |
50 |
|
18 |
0140 |
0.200 |
0.165 |
35 |
18 |
0.133 |
0.114 |
0.123 |
35 |
|
19 |
0.120 |
0.120 |
0.120 |
25 |
19 |
0.160 |
0.160 |
0.160 |
25 |
|
20 |
0.200 |
0.120 |
0.150 |
25 |
20 |
0.080 |
0.160 |
0.107 |
25 |
|
Accuracy |
|
0.141 |
800 |
Accuracy |
|
0.145 |
800 |
||
|
M.A |
0.142 |
0.143 |
0.135 |
800 |
M.A |
0.141 |
0.141 |
0.136 |
800 |
|
W.A |
0.158 |
0.141 |
0.140 |
800 |
W.A |
0.153 |
0.145 |
0.146 |
800 |
CL#: Cluster Number; P: Precision; R: Recall; F: F-Score; SU: Support; M.A.: Macro Average; W.A.: Weighted Average
The quantitative validity indices of 20 keyword phrases of TREC2018 for the Visual LSI hybrid topic model are mentioned in Table 8. From these results, Euclidean results are better than that of cosine based on accuracy, Macro Average, and Weighted Average.
In Table 9, comparative results of validity indices based on cluster classification metrics are shown under Cosine and Euclidean based metrics. These results interpreted that Euclidean based metric on average for all clusters to perform better than cosine based metric.
The cosine-based validation metrics proposed in this paper have the advantage of considering both in the implementation of hybrid topic models clustering algorithms and the validation of formed clusters. Nearness among documents in terms of topics is also quantified by the closeness between two different documents and their lexical similarity. In this point of view, proposed cosine-based metrics are more desirable than Euclidean metrics, where merely the distance between two clusters will be considered in document clustering. This paper in cluster validation compactness, separation, number of clusters, and classification metrics is considered, which will evaluate the classification by considering every element in all clusters of a corpus. Experimentally proved proposed novel cosine based internal and external validity indices work well in cluster validation and improve the effectiveness of cluster than that of Euclidean validity metrics. However, in high sparsity, other aspects such as density should also be considered in the evaluation. Performance can be optimized by increasing the scalability of their execution in a semi-distributed environment and dealing with dynamically changing large datasets in text documents clustering applications.
This research did not receive any financial grant/funding from any agency in public, commercial, or not-for-profit sectors to conduct this study. The author also sincerely appreciates the editor and reviewers for their time and valuable comments.
[1] Rodrigues, F., Lourenc, M., Ribeiro, B., Pereira, F. (2018). Learning supervised topic models for classification and regression from crowds. IEEE Transactions on Pattern Analysis and Machine Intelligence, 39(12): 2409-222. https://doi.org/10.1109/TPAMI.2017.2648786
[2] Momtazi, S. (2018). Unsupervised latent dirichlet allocation for supervised question classification. Information Processing and Management, 54(3): 380-393. https://doi.org/10.1016/j.ipm.2018.01.001
[3] Deerwester, S., Dumais, S.T., Furnas, G.W., Landauer, T.K., Harshman, R. (1990). Indexing by latent semantic analysis. Journal of American Societ for Information Sciences, 41(6): 391-407. https://doi.org/10.1002/(SICI)1097-4571(199009)41:6<391::AID-ASI1>3.0.CO;2-9
[4] Hofmann, T. (1999). Probabilistic latent semantic indexing. SIGIR '99: Proceedings of the 22nd Annual International ACM SIGIR Conference on RESEARCH and Development in Information Retrieval, pp. 50-57. https://doi.org/10.1145/312624.312649
[5] Blei, D.M., Ng, A.Y., Jordan, M.I. (2003). Latent dirichlet allocation. The Journal of Machine Learning Research, 3: 993-1022.
[6] Choo, J., Lee, C., Reddy, C.K., Park, H. (2013). Utopian: User-driven topic modeling based on interactive non-negative matrix factorization. IEEE Transactions on Visualization and Computer Graphics, 19(12): 1992-2001. https://doi.org/10.1109/TVCG.2013.212
[7] Rajendra Prasad, K., Mohammed, M., Noorullah, R.M. (2019). Visual topic models for healthcare data clustering. Evolutionary Intelligence, 1: 1-17. https://doi.org/10.1007/s12065-01900300-y
[8] Pattanodom, M., Iam-On, N., Boongoen, T. (2016). Clustering data with the presence of missing values by ensemble approach. Second Asian Conference on Defense Technology, Chiang Mai, Thailand. https://doi.org/10.1109/acdt.2016.7437660
[9] Amelio, A., Pizzuti, C. (2015). Is normalized mutual information a fair measure for comparing community detection methods? IEEE/ACM International Conference on Advances in Social Networks Analysis and Mining, pp. 1584-1585. https://doi.org/10.1145/2808797.2809344
[10] Xu, G., Meng, Y., Chen, Z., Qiu, X., Wang, C., Yao, H. (2019). Research on topic detection and tracking for online news texts. IEEE Access, 7: 58407-58418. https://doi.org/10.1109/access.2019.2914097
[11] Li, Z., Shang, W., Yan, M. (2016). News text classification model based on-the topic model. IEEE/ACIS 15th International Conference on Computer and Information Science (ICIS), Okayama, Japan. https://doi.org/10.1109/icis.2016.7550929
[12] Maulik, U., Bandyopadhyay, S. (2002). Performance evaluation of some clustering algorithms and validity indices. IEEE Transactions on Pattern Analysis and Machine Intelligence, 24(12): 1650-1654. https://doi.org/10.1109/TPAMI.2002.1114856
[13] Mekaroonkamon, T., Wongsa, S. (2016). A comparative investigation of the robustness of unsupervised clustering techniques for rotating machine fault diagnosis with poorly-separated data. 8th International Conference on Advanced Computational Intelligence, Thailand. https://doi.org/10.1109/ICACI.2016.7449821
[14] Dan, A., Simovici, E., Jaroszewicz, S. (2002). An axiomatization of partition entropy. IEEE Transactions on Information Theory, 48(7): 2138-2142. https://doi.org/10.1109/TIT.2002.1013159
[15] Kelemen, O., Tezel, O., Ozkul, E., Tiryaki, B.K., Agayev, E. (2017). A comparison of validity indices on fuzzy C-means clustering algorithm for directional data. 25th Signal Processing and Communications Applications Conference, Turkey. https://doi.org/10.1109/siu.2017.7960557
[16] Wu, K.L. (2008). An analysis of the robustness of the partition coefficient index. IEEE International Conference on Fuzzy Systems, Hong Kong, China. https://doi.org/10.1109/fuzzy.2008.4630393
[17] Vergani, A., Binaghi, E. (2018). A soft davies-bouldin separation measure. IEEE International Conference on Fuzzy Systems (FUZZ-IEEE), Rio de Janeiro, Brazil. https://doi.org/10.1109/fuzz-IEEE.2018.8491581
[18] Babli, S., Misuraca, M., Spano, M. (2016). A cosine based validation measure for document clustering. JADT 2016: 13ème Journées internationales d’Analyse statistique des Données Textuelles. Corpus ID: 195322770.
[19] Oghbaie, M., Mohammadi Zanjireh, M. (2018). Pairwise document similarity measure based on present term set. Journal of Big Data, 5: 52. https://doi.org/10.1186/s40537-018-0163-2
[20] Rafi, M., Sharif, M.N., Arshad, W., Rafay, H. (2016). Exploiting document level semantics in document clustering. International Journal of Advanced Computer and Applications (IJACSA), 7(6): 462-469. https://doi.org/10.14569/IJACSA.2016.070660
[21] Zhong, S. (2005). Efficient online spherical K-means clustering. IEEE International Conference on Neural Network, Montreal, Que., Canada. https://doi.org/10.1109/IJCNN.2005.1556436
[22] Dataset TREC2018 Keyword phrases. https://trec.nist.gov/pubs/trec24/trec2018.html.
[23] Wongkot, S., Meesad, P., Haruechaiyasak, C. (2010). Hierarchical web page classification based on a topic model and neighboring pages integration. (IJCSIS) International Journal of Computer Science and Information Security, 7(2): 166-173.
[24] Pattanodom, M., Iam-On, N., Boongoen, T. (2016). Clustering data with the presence of missing values by ensemble approach. 2016 Second Asian Conference on Defense Technology (ACDT), Chiang Mai, Thailand. https://doi.org/10.1109/acdt.2016.7437660
[25] Alessia, A., Pizzuti, C. (2015). Is normalized mutual information a fair measure for comparing community detection methods? IEEE/ACM International Conference on Advances in Social Networks Analysis and Mining, pp. 1584-1585. https://doi.org/10.1145/2808797.2809344