Bouhamed Heni
© 2020 IIETA. This article is published by IIETA and is licensed under the CC BY 4.0 license (http://creativecommons.org/licenses/by/4.0/).
OPEN ACCESS
In this study, we use a Deep Learning sequence prediction models for the continuous monitoring of the infection and recovering processes while considering the potential impacts of Bacille Calmette-Guérin (BCG) vaccination and tuberculosis (TB) infection rates in populations. This model was built based on the epidemic data evolution in several countries between the date of their first case and March 13, 2020. The data was based on 14 variables for cases prediction and 15 variables for recoveries prediction. Prevision results were very promising and the suspicions on the BCG vaccination and TB infections rates’ implications turned out to be quite warranted. The model can evolve by continuously updating and enriching data, adding experiences of all affected countries.
COVID-19, deep learning, RNN, GRU, LSTM, BCG, tuberculosis
Many doubts have emerged in recent months about the potential links between BCG vaccination, tuberculosis infection and the spread of COVID-19. Some work [1-5] has been published in this context without being conclusive. So, to keep digging into the matter is much needed now in order to develop a prediction model to better control the pandemic while trying to know the extent of the three factors’ possible implications even though it would still be quite difficult to prove. At the beginning of epidemic, stochastic models were widely used, because a small group of carriers had infected people randomly. After that, researchers turned their attention to deterministic models, which make possible to predict the emergence of infection peaks and to define different control strategies. Work, published in this context, touched on studies on a single country [6-12], the impact of one or more parameters on the evolution of contagion [9], the comparison between the evolution of the current epidemic with the one of previous versions of the corona virus [10], the risk estimation of fatal cases [11] etc. We suggest moving towards advanced artificial intelligence techniques to try and develop a model to predict infection and recovery instances for any selected country given many inputs including BCG vaccination and TB infections rate. Such a model can serve as a reference and a tool to inform the public health professionals, clinicians and decision-makers, enabling them to take coordinative and collaborative efforts to control the pandemic. Models can, also, help to better understand the virus by comparing predictions in different situation.
Several studies invoke the prominence of deep neural networks (DNNs) which surpass the performance of the previous dominant paradigm in diverse machine learning applications [13-17]. Deep Learning is a set of machine learning methods allowing to model data with a high level of abstraction. It is based on articulate architectures of various transformations in the nonlinear space [13, 18]. It is also considered as part of the Big Data domain. Current interest for Deep Learning is, not only for its conceptual advances, but also for its technological advances. As a matter of fact, all the available solutions (in terms of models learning) can exploit the immense reservoir of power computing, established through actual modern computers, as well as requesting the main processor (CPU) and the graphic dedicated processors (GPU) [13]. A Big Data model can adapt with enormous volume of data and with enormous sequential treatment of numbers exceeding most powerful server capacities [13, 19]. Since prediction, in our context, depends on observations obtained at previous timings, our scope was more about predicting time sequences. The prediction of recovery cases also depends on the predicted numbers of infected cases, so the model we are trying to develop must also consider this overlap or dependency of predictions.
Sequence prediction has different problems than other types of supervised learning. The sequence imposes an order to the observations that must be preserved when training models and making predictions. In general, prediction problems that involve sequence data are referred to as sequence prediction problems, although there are several other problems that differ based on the input and output sequences. Many artificial recurrent neural network (RNN) architectures [12, 20] are used in the field of Deep Learning among which Simple Recurrent Neural Network (SRNN), Long Short-Term Memory (LSTM) and Gated Recurrent Unit (GRU). Unlike standard feedforward neural networks, RNN has feedback connections. It is capable of not only processing single data points, but also entire sequences of data (such as speech or video). For example, RNN is applicable to tasks such as unsegmented and connected handwriting recognition [21], speech recognition [22] and anomaly detection in network traffic or IDS's (intrusion detection systems). We, then, propose to test this three RNN architectures (SRNN, LSTM, GRU) for this study.
The remainder of this paper is organized as follows: In section 2, we introduce RNN and their three main architectures. In section 3, we treat data, features and methods. In section 4, we proceed with experimentation and discussion. And finally, in the last section, we draw our conclusion and perspectives.
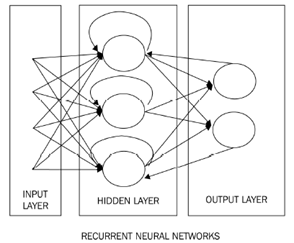
A recurrent neural network is a network of artificial neurons with recurrent connections (Figure 1). It consists of interconnected units (neurons) interacting non-linearly and for which there is, at least, one cycle in the structure. The units are connected by weighted arcs (synapses). The output of a neuron is a non-linear combination of its inputs.
SRNN are simple and suitable for input data of various sizes. The training techniques of the network are the same for classical networks, using gradient retro-propagation. However, SRNN may face the problem of gradient disappearance while attempting to memorize too many past events. Some architectures treat this mentioned problem, notably the LSTM and GRU.
Figure 1. RNN
LSTM is the most widely used recurrent neural network architecture in practice, which allows to tackle the gradient disappearance issue. The LSTM network was proposed by Sepp Hochreiter and Jürgen Schmidhuber in 1997 [20]. The idea behind LSTM is that each computational unit is linked, not only to a hidden state h, but also to a state c of the cell that acts as memory. The transition is made by a constant gain transfer equal to 1, so that errors propagate to previous steps (up to 1000 steps in the past) without any gradient disappearance instances [23].
GRU were introduced in 2014 by Cho et al. [24]. Usually when we learn about recurrent networks, we learn about the LSTM first, which could be due to its popularity, or possibly because it was invented first. The GRU is a simpler version of the LSTM. It incorporates many of the same concepts, but it has a much smaller number of parameters, so it can train faster at a constant hidden layer size.
As a first step, a database has been compiled, representing the evolution of COVID-19 infections for 79 countries from the date of their first cases of infection until March 13, 2020 (1899 observations). The data was recovered from ecdc.europa.eu web site and we have chosen countries where the pandemic started early (Table 1). We have used 13 variables representing demographic, medical and social indicators which data were depicted from the United Nations Development Program-Human Development Report and the World Health Organization (Table 2). The last variable was the cumulative number of infection cases on day j+1 compared to the first descriptive variable which was the cumulative number of infection cases on day j. The other descriptive variables were as follows:
- BCG vaccination policies by country: Several studies [1-5] express doubts about its involvement in the spread of the epidemic,
- Estimated TB incidence rates by country (2018): Also several studies [1-5] share doubts about its implication in the spread of the epidemic,
- Monthly average temperatures: It turns out that the virus succumbs to high temperatures which could possibly limit contagion,
- Gross Domestic Product per capita: It could give an idea on the financial capacity of the country and its population relevant to fight against the pandemic,
- Country population number: It was used to control the number of cases according to the number of the population,
- Country population density per square meter: An overpopulated country may be more vulnerable to contagion,
- Human Development index: This index could give an idea on the intellectual and educational capacity of the population, which is positively correlated to prevention measures application such as social distancing,
- Country percentage of health expenditure: It gives an idea on the degree of governments involvement in public health, which is crucial in the current fight against COVID-19,
- Country number of visitors per year: The number of visitors could be a contributing factor in how fast the epidemic can spread,
- Country number of hospital beds per 10000 habitants: This variable gives an idea on the country's capacity to care for potential patients,
- Country number of days since the first case: This number can help control the epidemic evolution,
- National lockdown establishment: The lockdown’s enforcement could logically limit contagion.
Table 1. Countries included in our studies
|
China |
S.Korea |
France |
Germany |
Iran |
|
Iraq |
UK |
Italy |
Japan |
Singapo |
|
Spain |
Thailand |
Afghani |
Albania |
Algeria |
|
Argentina |
Armenia |
Australi |
Austria |
Bahrain |
|
Belgium |
Brazil |
Bulgaria |
Canada |
Chile |
|
Colombia |
Costa Ri |
Croatia |
Czech R |
Denmar |
|
Dominican |
Ecuador |
Egypt |
Estonia |
Finland |
|
Georgia |
Greece |
Hungary |
Iceland |
India |
|
Indonesia |
Ireland |
Israel |
Kuwait |
Latvia |
|
Lebanon |
Luxembou |
Malaysia |
Mexico |
Morocco |
|
Netherlands |
Norway |
Oman |
Pakistan |
Palestine |
|
Panama |
Paraguay |
Peru |
Philippines |
Poland |
|
Portugal |
Qatar |
Romania |
Russia |
San M |
|
Saudi A |
Senegal |
Serbia |
Slovakia |
Slovenia |
|
South Af |
Sri Lanca |
Sweden |
Switzerland |
Taiwan |
|
Tunisia |
UAE |
USA |
Vietnam |
|
Table 2. R2 average scores for the first phase model for 10 iterations of training
|
Architecture |
Average |
|
LSTM R2 |
0.999 |
|
GRU R2 |
0.973 |
|
SRNN R2 |
0.959 |
As a second step, a database was set up, representing the evolution of recovered cases for 12 countries (China, South Korea, France, Germany, Iran, Iraq, United Kingdom, Italy, Japan, Singapore, Spain and Thailand), starting from the date of their first case of recovery until March 19, 2020 (594 observations). 14 Descriptive variables were used. The last variable was the cumulative number of recovered cases on day j+1 compared to the first descriptive variable which was the cumulative number of recovered cases on day j. For the rest, we kept the same variables used for cases prediction while including the number of cases predicted by the first model and the average age of the population which we considered relevant for the speed of recovery. Note that the datasets of the two phases have a similar distribution.
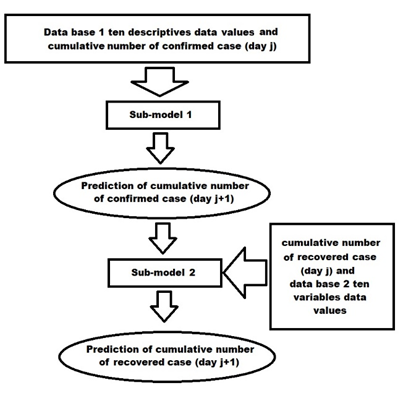
Figure 2. Prevision process
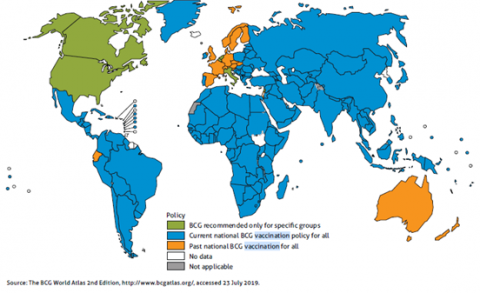
Figure 3. BCG vaccination in the world: Global tuberculosis report by World Health
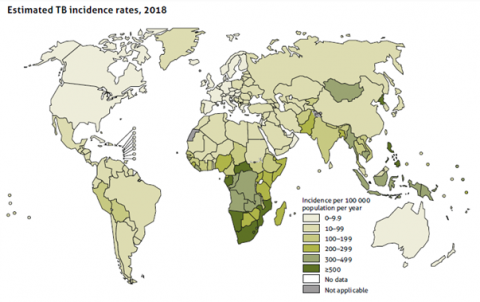
Figure 4. Estimated TB incidence rates: Global tuberculosis report by World Health Organization 2019
The training was done in two steps, training a first model for the prediction of the cumulative number of infected cases with database 1, followed by training of a second model for the prediction of the cumulative number of recovered cases with database 2. The prediction process with our two models is shown in Figure 2. A first prediction would be computed based on the phase 1 model followed by a second prediction computed based on the phase 2 model by retrieving the first prediction as input to the second model. We have tested the three most popular RNN architectures: SRNN, LSTM and GRU. The experimentation codes were written with the Python language. TensorFlow and Keras packages were mainly used for the Deep Learning-LSTM and matplotlib package for the visualization of results. All codes, as well as, the database itself is accessible on GitHub (https://github.com/henibouhamed/COVID-19-LSTM). k-fold Cross Validation are used to evaluate the two model phases. The learning process for both phases was repeated 10 times. For the optimization of the model two phases hyperparameter, we started by testing the use of the layers in an ascending way (one layer then two etc...), cross validation results continuously improved up to 4 layers before stagnating and this is the reason why we adopted four layers for the model parameterization. A dropout was used after each layer to prevent overfitting.
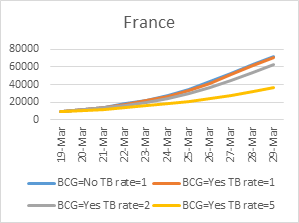
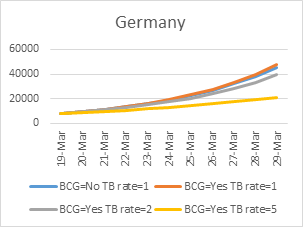
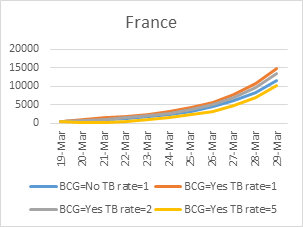
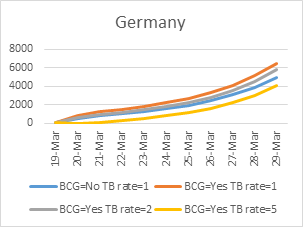
An investigation was launched at the end to try and verify the links between BCG, TB infection and COVID-19. The study involved three countries: France, Germany and Spain. We used our model (in two phases) to predict the number of cases and recoveries for these countries according to the following four possibilities:
- BCG vaccination: No, Estimated TB incidence per 100000 population class = 1 (1 [0-9.9], 2 [10-99], 3 [100-199], 4 [200-299], 5 [300-499], 6 [>500] see Figure 3 and Figure 4 depicted from World Health Organization report),
- BCG vaccination: Yes, Estimated TB incidence per 100000 population class=1,
- BCG vaccination: Yes, real Estimated TB incidence per 100000 population class=2,
- BCG vaccination: Yes, real Estimated TB incidence per 100000 population class=5. The way that section titles and other headings are displayed in these instructions, is meant to be followed in your paper.
Some studies published in the context of COVID-19 and its possible correlation with BCG and TB mainly presents statistical studies suggesting this possible relationship without presenting a predictive model [2, 5]. Some other studies have simply presented microbiological studies with hypotheses and have not reported decisive conclusion. They also don’t have presented a future action for monitoring and control of the pandemic [1, 3, 4]. Outside the context of BCG and TB, several works focused on studying and predicting the pandemic evolution for a single country using deterministic or stochastic models [6-11]. To our knowledge, our work is the only one to propose this conduct in the context of COVID-19, generalized for all affected countries.
Experimental results were expressed in three ways:
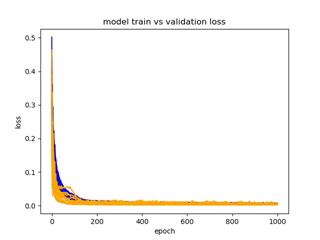
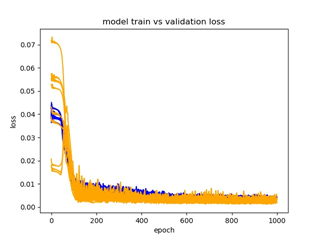
- Figures 5, 6, and 7 present the error evolution (loss) for the learning and test data for 10 learnings carried out for the phase 1 with respectively: SRNN, GRU and LSTM. Figures 8, 9 and 10 present the error evolution (loss) for the learning and test data for 10 learnings carried out for the phase 2 with respectively: SRNN, GRU and LSTM.
- Table 2 present the R2 average scores for the phase 1 model with respectively LSTM, GRU, SRNN for 10 learnings. Table 3 present the R2 average scores for the phase 2 model with respectively LSTM, GRU, SRNN for 10 learnings.
- At the end of this study, we also tried to predict the pandemic evolution (prediction of the evolution COVID-19 cases and recoveries by modifying each time the information concerning BCG vaccination and the estimation of TB infections for three countries: France, Germany and Spain (Figures 11, 12 ,13, 14, 15 and 16)). According to the average R2 score for each architecture test, the results of LSTM were slightly better (Table 2 and 3), which led us to use it for investigation.
Figure 5. Evolution of the error (loss) for training and test data for 10 learnings carried out for the first phase model training with SRNN
Figure 6. Evolution of the error (loss) for training and test data for 10 learnings carried out for the first phase model training with GRU
Figure 7. Evolution of the error (loss) for training and test data for 10 learnings carried out for the first phase model training with LSTM
Figure 8. Evolution of the error (loss) for training and test data for 10 learnings carried out for the second phase model training with SRNN
Figure 9. Evolution of the error (loss) for training and test data for 10 learnings carried out for the second phase model training with GRU
Figure 10. Evolution of the error (loss) for training and test data for 10 learnings carried out for the second phase model training with LSTM
The evolution of learning and testing rate (loss) (Figures 5, 6, 7, 8, 9 and 10) as well as the R2 scores found (Table 2 and 3) allowed us to conclude that the models’ results were globally reliable according to the three RNN architectures tested. The LSTM was slightly better but learning the two other architectures was faster. The results of the second phase (recoveries predictions) were very encouraging even though the study involved only 12 countries until March 13, a date until which experiences on recoveries evolution were lacking.
Figure 11. Prevision of cases number for France
Figure 12. Prevision of cases number for Germany
Figure 13. Prevision of cases number for Spain
Table 3. R2 average scores for the second phase model for 10 iterations of training
|
Architecture |
Average |
|
LSTM R2 |
0.996 |
|
GRU R2 |
0.964 |
|
SRNN R2 |
0.952 |
Figure 14. Prevision of recoveries number for France
Figure 15. Prevision of recoveries number for Germany
Figure 16. Prevision of recoveries number for Spain
The final phase of the studies, concerning the involvement of the BCG vaccination and the percentage of TB infections, revealed some surprising trends. Indeed, the increase in the percentage of TB infections significantly decreased the evolution of cases, whereas BCG vaccination did not have a considerable effect in this first phase of the study. Conversely, BCG vaccination accelerated the evolution of recoveries during the second phase of the study, whereas the percentage of TB infections did not have a significant impact at this stage. Nevertheless, it is very difficult to draw radical conclusions in one direction or the other, and our study may eventually inspire the scientific community to continue research on the matter.
We propose, as a perspective to this work, first, to add the data of all other countries affected by the virus, then to create an automatic process to update the results and finally to nest another model following the two previous ones (cases and recoveries) to predict the number of deaths. This model may help control the pandemic and may help in making the right decisions in advance.
In this study, we have used a Deep Learning sequence prediction models (SRNN, LSTM and GRU) for the continuous monitoring of the infection and recovering processes making investigations about the impact of Bacille Calmette-Guérin (BCG) vaccination and the incidence of tuberculosis (TB) infection rate in populations. Models were built based on the epidemic data evolution of several countries between the date of their first case and March 13, 2020. The data was based on 14 variables for case prediction and 15 variables for recoveries prediction.
Prevision results were very promising and the intuition behind the BCG vaccination and TB infections rate implications turned out to be quite relevant. The model can evolve by continuously updating and enriching data by adding experiences of all affected countries.
The methods in this study can help inform public health professionals, clinicians and decision-makers to take coordinative and collaborative efforts to control the epidemic.
The perspective for this work is, first, to add data from all other countries affected by the virus, then to create an automatic process to update the results, and finally to nest another model following the two others to predict the number of deaths. This model may help control the pandemic and may help making the right decisions in advance.
[1] Gupta, A. (2020). Is immuno-modulation the key to COVID-19 pandemic? JOIO, 54: 394-397. https://doi.org/10.1007/s43465-020-00121-7
[2] Gursel, M., Gursel, I. (2020). Is global BCG vaccination coverage relevant to the progression of SARS-CoV-2 pandemic? Medical Hypotheses. https://doi.org/10.1016/j.mehy.2020.109707
[3] Redelman-Sidi, G. (2020). Could BCG be used to protect against COVID-19? Nature Reviews Urology. https://doi.org/10.1038/s41585-020-0325-9
[4] Schaaf, H.S., du Preez, K., Kruger, M., Solomons, R., Taljaard, J.J., Rabie, H., Seddon, J.A., Cotton, M.F., Tebruegge, M., Curtis, N., Hesseling, A.C. (2020). Bacille Calmette-Guérin (BCG) vaccine and the COVID-19 pandemic: responsible stewardship is needed. International Journal of Tuberculosis and Lung Disease (IJTLD).
[5] Hegarty, P.K., Kamat, A.M., Zafirakis, H., Dinardo, A. (2020). BCG vaccination may be protective against Covid-19. https://doi.org/10.13140/RG.2.2.35948.10880
[6] Chen, X.G., Yu, B. (2020). First two months of the 2019 Coronavirus Disease (COVID-19) epidemic in China: Realtime surveillance and evaluation with a second derivative model. Global Health Research and Policy. https://doi.org/10.1186/s41256-020-00137-4
[7] Toshikazu Kuniya, Prediction of the Epidemic Peak of Coronavirus Disease in Japan 2020.
[8] Li, Q., Gua,n X.H., Wu, P., Wang, X.Y., Zhou, L., Tong, Y.Q., Ren, R.Q., Leung, K.S.M., Lau, E.H.Y., Wong, J.Y., Xing, XS., Xiang, N.J., Wu, Y., Li, C., Chen, Q., Li, D., Liu, T., Zhao, J., Li, M., Tu, W.X., Chen, C.D., Jin, L.M., Yang, R., Wang, Q., Zhou, S.H., Wang, R., Liu, H., Luo, Y.B., Liu, Y., Shao, G., Li, H., Tao, Z.F., Yang, Y., Deng, Z.Q., Liu, B.X., Ma, Z.T., Zhang, Y.P., Shi, G.Q., Lam, T.T.Y., Wu, J.T.K., Gao, G.F., Cowling, B.J., Yang, B., Leung, G.M., Feng, Z.J. (2020). Early transmission dynamics in Wuhan, China, of novel coronavirus–infected pneumonia. The new England Journal of Medicine, 382: 1199-1207. https://doi.org/10.1056/NEJMoa2001316
[9] Anzai, A., Kobayashi, T., Linton, N.M., Kinoshita, R., Hayashi, K., Suzuki, A., Yang, Y., Jung, S., Miyama, T., Akhmetzhanov, A.R., Nishiura, H. (2020). Assessing the impact of reduced travel on exportation dynamics of novel coronavirus infection (COVID-19). Journal of Clinical Medecine, 9(2): 601. https://doi.org/10.3390/jcm9020601
[10] McAleer, M. (2020). Prevention is better than the cure: risk management of COVID-19. Journal of Risk Financial Managment, 13(3): 46. https://doi.org/10.3390/jrfm13030046
[11] Jung, S., Akhmetzhanov, A.R., Hayashi, K., Linton, N.M., Yang, Y., Yuan, B.Y., Kobayashi, T., Kinoshita, R., Nishiura, H. (2020). Real-time estimation of the risk of death from novel coronavirus (COVID-19) infection: inference using exported cases. Journal of Clinical Medecine, 9(2): 523. https://doi.org/10.3390/jcm9020523
[12] Brownlee, J. (2017). Long Short-Term Memory Networks with Python. Machine Learning Mastery Edition.
[13] Bouhamed, H., Ruichek, Y. (2018). Deep feedforward neural network learning using Local Binary Patterns histograms for outdoor object categorization. Advances in Modelling and Analyses B, 61(3): 158-162. htttps://doi.org/10.18280.ama_b.610309
[14] Hinton, G., Deng, L., Yu, D., Dahl, G., Mohamed, A., Jaitly, N. (2012). Deep neural networks for acoustic modeling in speech recognition: the shared views of four research groups. IEEE Signal Process. Mag, 29(6): 82-97. htttps://doi.org/10.1109/MSP.2012.2205597
[15] Mohamed, A., Dahl, G., Hinton, G. (2012). Acoustic modeling using deep belief networks. IEEE Transactions on Audio, Speech, and Language Processing, 20(1): 14-22. htttps://doi.org/10.1109/TASL.2011.2109382
[16] Ciresan, D., Meier, U., Gambardella, L., Schmidhuber, J. (2010). Deep big simple neural nets excel on handwritten digit recognition. arXiv:1003.0358v1.
[17] Yu, D., Deng, L. (2011). Deep learning and its applications to signal and information processing [exploratory DSP]. IEEE Signal Processing Magazine, 28(1): 145-154. https://doi.org/10.1109/MSP.2010.939038
[18] Bengio, Y. (2009). Learning deep architectures for AI. Foundations and Trends® in Machine Learning, 2(1): 1-127. http://dx.doi.org/10.1561/2200000006
[19] Zikopoulos, P, Eaton, C. (2011). Understanding Big Data: Analytics for Enterprise Class Hadoop and Streaming Data. McGraw-Hill Osborne Media.
[20] Hochreiter, S., Schmidhuber, J. (1997). Long short-term memory. Neural Computation, 9(8): 1735-1780. https://doi.org/10.1162/neco.1997.9.8.1735
[21] Graves, A., Liwicki, M., Fernandez, S., Bertolami, R., Bunke, H., Schmidhuber, J. (2009). A novel connectionist system for improved unconstrained handwriting recognition. IEEE Transactions on Pattern Analysis and Machine Intelligence, 31(5): 855-868. https://doi.org/10.1109/TPAMI.2008.137
[22] Li, X.G., Wu, X.H. (2014). Constructing long short-term memory based deep recurrent neural networks for large vocabulary speech recognition. arXiv:1410.4281.
[23] Gers, F.A., Schraudolph, N.N., Schmidhuber, J. (2002). Learning precise timing with LSTM recurrent networks., Journal of Machine Learning Research, 3: 115-143. https://doi.org/10.1162/153244303768966139
[24] Cho, K., van Merrienboer, B., Caglar, G., Bougares, F., Schwenk, H., Bengio, Y. (2014). Learning phrase representations usingrnn encoder-decoder for statistical machine translation. arXiv preprint, arXiv:1406.1078.