Kaustuv Deb* | Sonali Banerjee | Rudra Prasad Chatterjee | Atanu Das | Rajib Bag
OPEN ACCESS
In the Internet era, it is a huge challenge for users to find suitable and pertinent information out of the huge amount of online data. The challenge is particularly arduous for students searching for education information in a specific domain. To solve the problem, this paper puts forward an educational website ranking method, which applies fuzzy logic and k-means clustering in sequence. First, a fuzzy inference system (FIS) was established based on the fuzzy logic, and used to find the utility value (UV) of an educational website according to the feedback marks of each student. Then, the general utility value (GUV) of each educational website was determined through k-means clustering of all the UVs of that website. Then, the educational websites were ranked by their GUVs. The experimental results show that the proposed method ranks the educational websites clearly and correctly, enabling students to find the desired education information.
decisive criteria, fuzzy set, fuzzy inference system (FIS), utility value (UV), major cluster (MC)
The World Wide Web is gradually booming with a varied and gigantic source of data both in connected and disconnected forms. These comprise of data belonging to acoustic, video, textual, graphical representation formats and surprisingly most of these data contain intrinsic information enclosed within the data itself. The exponential growth of data had begun surfacing since early 1990’s which has led to data explosion in the Internet at present. The most enthralling task meted out to the users due to this data outburst is to effectively explore, discover, extort, strain or assess the appropriate content. To help human race mend ways to accurately opt for the requisite data, gives rise to the need to formulate techniques so that these challenges be resolved effortlessly.
The authors as researchers have felt the urgency of thinking a way out of this hitch, as learners are very much dependant on the Internet for study materials and there is a constant urge to assemble the finest, latest yet significant information in smallest possible time. In this era of automation, probing valid distinctive data is based on perspective, measurability, balance and diversity. The most contrasting feature of today’s data exploration to that of previous times is in the vast increase in the assortment of web content. Though whatever the search content may be, the outcome that they provide should be effective and finding the relevant search matter in optimum time is a mandate from the point of view of a learner.
Web based learning environments should be differentiated according to the preferences of all students from the virtual learning community. Learners’ attitude towards using these websites may depend on the degree it is personalized into their needs. The contents and learner acceptance of interface may play significant role in educational system performance.
The main part of any information retrieval system is ranking depending on the utility. Student learners visit those websites most frequently, which provide best utility regarding their learning activities. Ranking of educational websites based on served utilities is helpful in web searching.
This paper proposes a hybrid method of finding the utilities of educational websites served to student learners and rank websites according to their respective served utilities using fuzzy logic and K-means clustering based analysis of feedback marks given by student learners to educational websites. Brief overview of different sections of this paper is given below.
Section 2 describes the literature survey whereas section 3 provides a brief overview of fuzzy logic and K-Means clustering method. Section 4 describes the proposed method. Section 5 shows the experimental results and analysis. Evaluation of the proposed method is discussed in section 6 and section 7 concludes the work.
A lot of research is being done currently to augment the performance of search engines. Kohli and Mehrotra [1] proposed a hybrid clustering algorithm which focused on optimizing the web search results for web users. Medical data were used as input to analyze users’ behaviors to facilitate users to get the relevant information based on their search request. Nagpal et al. [2] proposed an approach using Fuzzy Analytical Hierarchical Process (FAHP) to rank educational websites using their usability measures.Users satisfaction is an important objective measure of usability of a website. Educational websites should provide users satisfaction as well as should fulfill all the necessary and complicated educational procedures. Thus measuring the effectiveness of the educational websites is a complex process and should be done using Multi Criterion Decision Making (MCDM) techniques. FAHP, a MCDM technique, having the ability to deal with uncertainty can be used to measure the effectiveness of the educational websites [2]. Nagpal et al. [2] have used FAHP to categorize the preferences based on the requirements of the user as per their search criteria. Grbovic et al. [3] proposed a method using supervised clustering which encompassed a concept of label ranking data. The researchers considered various parameters for maintaining cluster quality such as cluster compactness, label ranking prediction loss etc. which enhanced the prediction accuracy of the proposed methodology. Kathuria et al. [4] have proposed an approach to classify the intent of the queries of the web users using K-means clustering method. Results obtained by the application of the proposed approach have shown that the proposed approach has successfully performed automatic classification of a large number of web users’ queries with great deal of accuracy. High success rate achieved by the approach proposed by Kathuria et al. [4] induced reliability in the classification. Lu and Cong [5] suggest a method for improving the efficiency of web search engine, content based and link based approach namely Topic_ExpertRank where the results have also been compared with two renowned algorithms HITS and Page-Rank. Another web page prediction approach has been implemented by Srikala et al. [6], where a hybrid model has been developed by combining two methods Markov model and Support Vector Machine (SVM). Krishen [7] has proposed a method which can be used to find users interest in specific websites, based on certain criteria. Four aspects namely distinctiveness, learning importance, personalization and dependability has been found out and perceptual plotting has been used to group stationary websites. This method can be used to classify different specifications of users and will facilitate the creation of functional and satisfying based provisional websites. Kapoor and Singhal [8], have passed sorted and unsorted data into three clustering algorithms: K-means, K-means++ and object predicted fuzzy C-means. The work has produced a result showing that the performances and the time complexities of the three clustering algorithms were affected due to the input of sorted data. A fuzzy inference system has been suggested by Gabriel et al. [9] to evaluate the quality of an educational data where four steps have been performed such as fuzzyfication, implication, aggregation and defuzzyfication. Prominent page ranking methods have also been devised by Kumar et al. [10] based on the number of times a certain link has been visited. This helps in not only providing the most important pages but also to understand the consumer drift while searching for that specific information. Application of fuzzy logic has also been implemented by Zeng and Li [11] to rank football teams based on four constraints. A methodology has been presented Herrera-Viedma et al. [12] to evaluate the information quality of content-based Web sites using fuzzy linguistic techniques. The above said approach is used to generate linguistic recommendations on such Web sites that can help other users in their future search processes. Sabry and Baldwin [13] has investigated the styles of learning and proposed a learning methodology for a group of web learners. This work has explored different styles of learning of learners and their effects on the progress of learning in view of various aspects like learner tutor, learner-learner, and learner-information. The results of this work portrayed that learner-information interrelation achieved highest importance compared to the others regarding frequency of use and perception of usefulness. Goodarzi and Amiri [14] incorporated Fuzzy Inference System to assess the learning progress of students based on the levels of complications of the questions. Mamdani's max-min inference rule and COG (Center of Gravity) defuzzyfication procedure have been used to develop a model to evaluate learning process of students. Asopa and Asopa [15] have proposed a system by implementing a Fuzzy Inference System for fuzzy Intelligent Tutoring System (ITS) for the purpose of evaluating the performances of students.
3.1 Fuzzy logic
Fuzzy logic was developed by L. Zadeh in 1965 around. Fuzzy logic has been leaving enormous effect on mathematical modelling, research areas of soft computing and machine learning since its development. Fuzzy logic operates on uncertain linguistic variables describing factors like temperature with linguistic tokens like ‘very low’, ‘low’, ’medium’, ’high’, ’very high’ etc. Linguistic tokens incorporate vagueness for constructing inference systems to solve realistic problems such as automatic air-conditioner controlling, automatic car controlling, refrigerator controlling, washing machine controlling, educational performance measuring, doing various predictive analysis etc. These problems can’t be solved using conventional crisp set theory as it doesn’t support the concept of vagueness and thus fuzzy logic is the best suited approach for these problems. Fuzzy logic based systems work on fuzzy sets. A fuzzy set F can be represented by {(mi, µF(mi))} for all i such that mi ∈ a space of input values called Universe of Discourse and 0 < µF(mi) ≤ 1. Here, µF(mi) is the membership function of F that makes a mapping between member element mi and its degree of membership value falling in the range 0 to 1. Degree of membership µF(mi) signifies the strength of membership of mi in F. Fuzzy set theory doesn’t work on 0 or 1 membership concept used in conventional crisp theory, where an element can either be a member of a crisp set or can’t. Rather in fuzzy set theory, an element can be a member of a fuzzy set with different degree of membership ranging from 0 to 1. µF(mi) = 1 indicates absolute membership of mi in fuzzy set F and µF(mi) = 0 indicates non membership of mi in fuzzy set F. Partial memberships are indicated by 0 < µF(mi) < 1. Higher degree of membership value indicates the existence of a member element in a fuzzy set with higher strength.
3.2 Fuzzy Inference System (FIS)
A FIS is a fuzzy logic based inference system. These systems are used to draw inferences by firing some already defined fuzzy inference rules. These systems are used to make decisions in situations where vagueness is involved. These systems are used in various automatic fuzzy logic based controllers as mentioned in the above fuzzy logic section. A FIS takes some input variables and some output variables and allocates fuzzy membership functions to them. It then maps crisp values of input variables into fuzzy sets using allocated fuzzy membership functions. This mapping process is called fuzzy fication. Fuzzy inference rules are then used to produce fuzzy outputs from fuzzy inputs. At last, fuzzy outputs are defuzzyfied into crisp outputs. FISs are very much useful for making proper decisions in the situation where more than one inference conditions are applicable. Problems having linguistic tokenization can properly be solved using FIS.
3.3 K-Means clustering method
Clustering is a boosting and famous mechanism for extracting useful information from a set of data without any associated predefined class labels. In clustering, data values belonging to an input data set form different groups or clusters based on the similarities among data values.
Among all the clustering algorithms one of the most likely algorithm is K-Means clustering. K-Means clustering is a method commonly used to automatically partition a data set containing f number of data values into K clusters. It proceeds by randomly selecting K initial cluster centers from the input data values and then iteratively refining them as follows:
The algorithm converges when there is no further change in assignment of members to clusters.
Euclidean distance is mostly used to find the closeness of a cluster center to a data value. Accordingly, data values having small Euclidean distances among each other are placed in the same cluster. So, Euclidean distance is used to measure similarities among data values. K-Means clustering method is applied to extract suitable information through proper clustering to solve many complex real-life problems where data values are not labeled.
Today, various educational websites are hosted. These websites provide learning information related to different domains of learning. Engineering learning of today’s era is taking the help of these websites. Student learners find most utilizable websites from their web-surfing experiences and pay higher frequency of visits to those websites. The proposed method introduces a hybrid approach of finding utilities of different educational websites and providing a ranking of them according to their utility values. Utilities of educational websites are calculated from the data set obtained from feedback marks given by student learners to each educational website upon different decisive criteria. Choosing these decisive criteria is very important issue regarding utility finding. Decisive criteria should be capable of judging the utility performance of any educational website from student learners’ point of view. Taking the requirement of choosing the decisive criteria into account, three decisive criteria defined in the following are chosen.
4.1 Comparative Frequency of Visit per week (CFV)
Student learners pay most frequent visit to the educational website which is most utilizable to them from their point of view. Thus, Frequency of Visit per week (FV) is one of the decisive criteria to reflect the utility performance of an educational website with respect to student learners’ point of view and personalization aspect. FV values are just some numeric values without any unit scale. In order to compare different educational websites on the basis of their FV values, these values are to be scaled in a unit. In order to serve the purpose, we have derived CFV values in unified percentage scale from FV values of different educational websites. CFVj, j=1 to n, denotes the CFV value of educational website wj and calculated from FVx, x=1 to n, values of n educational websites we intend to compare. FVx denotes FV value of website wx. Eq. (1) shows the calculation of CFVj for each of the n educational websites.
$\mathrm { CFV } _ { j } = \mathrm { FV } _ { j } / \sum _ { \mathrm { X } = 1 } ^ { \mathrm { n } } \mathrm { FV } _ { \mathrm { X } }$ (1)
4.2 Quality of Subject Content (QSC)
Students are attracted to the websites which provide precise, structured, concrete, sophisticated subject contents or learning contents to them. Today, various websites are providing learning contents in different domains of learning. But among them, many subject contents are imprecise, unstructured, inadequate and improper. Moreover, sometimes subject contents reflect insufficient knowledge information and even wrong information in worst cases. These incorrect subject contents are dangerous for the students and are not visited by them at all. Student learners look for good quality subject contents which are beneficial to them. Hence QSC plays a very important role in finding the utility of any educational website for student learners. Thus, QSC is chosen as the next decisive criteria.
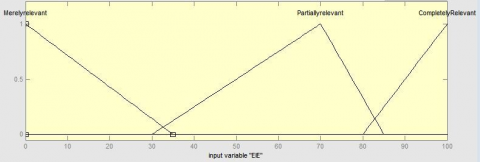
4.3 Effectiveness of Illustrative Example (EIE)
Examples act as catalyst in understanding any subject content easily. Students find it very easy to imbibe any subject matter if that is illustrated by suitable examples. Examples are used to portrait a clear picture of the theoretical concepts through mundane things and values. Illustrative examples enhance the utility of any subject content for the students. Discussing only theories without any example is not fruitful to make students understand the subject matter. Thus, student learners prefer those subject contents where effective illustrative examples are used. Examples should be proper, effective, and contextual to satisfy the understanding needs of students. Hence use of illustrative examples in educational websites is one of the attractive criteria from students’ point of view. So EIE can be used to judge the utility of an educational website impact fully.
The entire procedure of utility finding will execute as per the following steps:
Details of the aforesaid steps are portrayed below-
I. Student learners have their point of views towards educational websites. Student learners visit different educational websites and then judge the best websites according to their preferences. Student learners find their preferred websites based on the utility services of the websites. Student learners are most in numbers to visit any educational website. Thus, student learners are used to give their feedback marks out of 100 to different educational websites upon decisive criteria: CFV, QSC, and EIE to judge the served utility of websites. A data set is made from p number of student learners’ feedback marks given to each of the n number of different websites. This data set is analyzed in the subsequent steps to find the utilities of n different educational websites.
II. UV measures the served utility of an educational website. Each of the n educational websites has p UVs. Authors have used FIS to calculate UV from the data set obtained in step I. FIS used in the proposed method takes CFV, QSC and EIE as input variables and UV as output variable. Authors have allocated triangular fuzzy membership functions to the input and output variables. Crisp input values are mapped into fuzzy sets, denoted by various linguistic tokens, by triangular fuzzy membership functions. A triangular fuzzy membership function takes three intervals corresponding to the crisp values. A triangular fuzzy membership function of fuzzy set A is defined in the following, considering a crisp value v and intervals y1, y2 and y3:
$\mu _ { \text {TRIANGULAR } A (v)} = \left\{ \begin{array} { c } { 0 , \mathrm { v } \leq \mathrm { y } _ { 1 } } \\ { \left( \mathrm { v } - \mathrm { y } _ { 1 } \right) / \left( \mathrm { y } _ { 2 } - \mathrm { y } _ { 1 } \right) , \mathrm { y } _ { 1 } < \mathrm { v } < \mathrm { y } _ { 2 } } \\ { 1 , \mathrm { v } = \mathrm { y } _ { 2 } } \\ { \left( \mathrm { y } _ { 3 } - \mathrm { v } \right) / \left( \mathrm { y } _ { 3 } - \mathrm { y } _ { 2 } \right) , \mathrm { y } _ { 2 } < \mathrm { v } < \mathrm { y } _ { 3 } } \\ { 0 , \mathrm { y } _ { 3 } \leq \mathrm { v } } \end{array} \right.$
Table 1 shows the input and output variables of the proposed method, their corresponding fuzzy sets with linguistic tokens and intervals of the triangular membership functions related to the fuzzy sets.
Table 1. Linguistic tokens corresponding to variables and intervals of related triangular membership
|
Variable |
Type |
Linguistic tokens of corresponding fuzzy sets |
Intervals of the triangular membership functions |
|
CFV |
Input |
Low |
(0, 0, 50) |
|
Medium |
(45, 65, 80) |
||
|
High |
(75, 100, 100) |
||
|
QSC |
Input |
Bad |
(0, 0, 45) |
|
Average |
(40, 60, 75) |
||
|
Good |
(70, 100, 100) |
||
|
EIE |
Input |
Merely Relevant |
(0, 0, 35) |
|
Partially Relevant |
(30, 70, 85) |
||
|
Completely Relevant |
(80, 100, 100) |
||
|
UV |
Output |
Unfruitful |
(0, 0, 50) |
|
Moderately Fruitful |
(50, 60, 80) |
||
|
Fruitful |
(80, 100, 100) |
Figures 1-3 show the triangular membership functions of three input variables and Figure 4 shows for output variable. Horizontal axis of each figure denotes crisp values of respective input or output variable in the range 0 to 100. Vertical axis denotes the degree of membership values, in the range 0 to 1, of the horizontal axis values in corresponding fuzzy sets described in Table 1. If the degree of membership value of an input or output variable value is higher (closer to 1), then the input or output variable value has a high strength of existence in the corresponding fuzzy set. Highest strength of existence and no existence of an input or output variable value in a corresponding fuzzy set are indicated by corresponding degree of membership values of 1 and 0 respectively.
Figure 1. Triangular membership function of CFV
UVs are produced from values of CFV, QSC and EIE by inferring fuzzy inference rules. An inference rule has antecedent-consequent structure. Antecedent part is formed by AND or OR connections of input variables. Consequent part represents fuzzy output values. Following inference rules are defined for the proposed FIS–
A situation may arise where more than one rules are fired. In that type of situations, there will be a dilemma that what will be the ultimate fuzzy output value. Mamdani’s method is used here to resolve this dilemma and get the defuzzyfied crisp output UV. FIS is used in the proposed method to obtain UVs in practical and proper way by handling involved vagueness. Linguistic acquisition and inferences used in FIS built solid foundation to obtain actual utility measures of an educational website with suitable justifications.
Figure 2. Triangular membership function of QSC
Figure 3. Triangular membership function of EIE
Figure 4. Triangular membership function of UV
III. Data set of p number of students has produced p UVs for each of the n number of websites in step II. Thus, for each website Wj, j=1 to n, it is problematic to find which among the p UVs is considered to be the UV of Wj. To resolve this problem, a General Utility Value (GUV) of Wj is needed to be found from p UVs of Wj. This GUV will decide that which of the n websites is found to be the most utilizable website for the student learners according to their marking. Thus, finding the GUV of Wj is a very important task in order to find the most utilizable website. K-Means clustering method is used to perform this task with ease and accuracy. K-Means clustering method being a well-known clustering method works fine on data set and forms clusters based on the similarities of same cluster members. Here, K-Means clustering method is applied on p UVs to form three cohesive clusters by properly placing p UVs in respective clusters according to their similarity measures. Now, K-Means clustering produces three Final Cluster Center (FCC) values along with the cluster membership statistics corresponding to each of three final clusters. FCC value of a cluster is the mean value of the member UVs of that cluster. Statistics of the final cluster members is clearly going to help in finding the Major Cluster (MC) having highest number of members out of p UVs in it. Clearly, MC reflects the fact that most of the p UVs of Wj is clubbed together in MC. Thus, MC actually depicts the opinion of majority of p number of student learners about the utility of Wj. FCC value of MC being the mean value of its members gives the GUV of Wj.
A situation may arise where more than one MCs are found. In that case, mean value of FCC values of those MCs gives the GUV of Wj.
IV. Educational websites are arranged in the descending order of their respective GUVs and are ranked accordingly.
Four educational websites such as W1, W2, W3 and W4 are considered for educational website ranking experiment. Feedback marks of two hundred engineering student learners are taken upon decisive criteria discussed in section 4 for each of the four websites. Proposed method is applied on the data set of two hundred student learners’ feedback marks. Proposed method has executed all its steps discussed in section 4 and produced a raking of four educational websites. Following part of this section depicts various results obtained by carrying out the experiment of educational website ranking. Table 2-5 show samples of the entire data set containing two hundred student learners’ feedback marks given to W1, W2, W3 and W4 upon decisive criteria: CFV, QSC, EIE and calculated UVs for four websites. A serial number (SL No.) is associated with each row of Tables 2-5. UVs of each educational website are calculated by firing of different combinations of i to xxvii inference rules of the proposed FIS and defuzzyfication method discussed in step II of the proposed method mentioned in section 4. Results produced by FIS shows properly measured UVs without any distortion or wrong calculation. Marking values of all the three decisive criteria are considered properly with realistic fuzzy logic mechanism and perfect and relevant defuzzyfied UVs are produced. To illustrate this fact, let’s consider some of the examples from the results shown in Table 2-5. It can be seen in the entries corresponding to SL No. 7 of Table 2 that a student learner has given lower marks like: 6%, 8% and 6% to CFV, QSC and EIE respectively for W1 and accordingly a small UV of 16.8% is produced by the proposed FIS. Again, the entries corresponding SL No. 7 of Table 3 show that higher marks like: 80%, 90% and 95% are given by a student learner to CFV, QSC and EIE respectively for W2 and accordingly a large UV of 91.2% is produced by the proposed FIS. Also, the entries corresponding SL No. 3 of Table 4 show that middle order marks like: 44.57%, 70 % and 76% are given by a student learner to CFV, QSC and EIE respectively for W3 and accordingly a medium UV of 64.7% is produced by the proposed FIS. Apart from the above three examples, the entries corresponding SL No. 9 of Table 3 show that a combination of low, middle and high order marks like: 34.88%, 65% and 85% respectively are given by a student learner to CFV, QSC and EIE respectively for W2 and accordingly a medium UV of 64.4% is produced by the proposed FIS. Accordingly, many more combinations of decisive criteria marks and their corresponding relevant UVs can be found in Tables 2-5.
After getting UVs, GUV of each of the four websites is obtained by applying K-Means clustering method on the two hundred UVs of each website as shown in Table 2-5. Results produced by K-Means clustering method are shown in Table 6-13. K-Means clustering method has worked perfectly and has produced proper clusters. This fact can be illustrated by taking some of the examples from the results shown in Table 6-13. Table 6 shows that all the two hundred UVs of W1 are found valid in clustering and there is no missing UV of W1 that could not be clustered. Thus, it is obvious that all the two hundred UVs of W1 are successfully clustered into three clusters numbered as 1, 2 and 3 respectively. Table 6 also shows that cluster 1 has 10 UV members, cluster 2 has 107 UV members and cluster 3 has 83 UV members. Thus, it can be easily found that cluster 2 has got highest membership compare to other two clusters and hence cluster 2 has become the MC of W1. Table 7 shows that FCC value of MC i.e of cluster 2 is 22.9. Thus, the GUV of W1 is 22.9. Subsequently, Table 8, 10 and 12 show that all two hundred UVs belonging to each of W2, W3 and W4 are found valid in respective clustering activities and no UV of W2, W3 and W4 is missing. This result ensures the successful clustering of UVs of W2, W3 and W4 as well. Table 8, 10 and 12 also show that cluster 1 with 132 UV members, cluster 2 with 114 UV members and cluster 3 with 134 UV members has become the MC of W2, W3 and W4 respectively. Table 9, 11 and 13 show that FCC values of MCs of W2, W3 and W4 are 62.5, 62.5 and 21.9 respectively. Thus, GUVs of W2, W3 and W4 are 62.5, 62.5 and 21.9 respectively.
Table 2. Samples of two hundred student learners’ given feedback marks to W1 and calculated UVs for W1
|
W1 |
|||||
|
SL No. |
FV (per week) |
CFV (in %) |
QSC (in %) |
EIE (in %) |
UV (in %) |
|
1 |
21 |
24.42 |
50 |
67 |
62 |
|
2 |
25 |
25.00 |
70 |
65 |
64.2 |
|
3 |
12 |
6.52 |
54 |
64 |
63.6 |
|
4 |
10 |
16.39 |
65 |
85 |
62.2 |
|
5 |
12 |
11.21 |
23 |
25 |
21.4 |
|
6 |
45 |
22.50 |
52 |
75 |
63.8 |
|
7 |
3 |
6.00 |
8 |
6 |
16.8 |
|
8 |
65 |
29.82 |
72 |
70 |
64.5 |
|
9 |
55 |
31.98 |
45 |
64 |
64.4 |
|
10 |
2 |
3.08 |
25 |
49 |
19.7 |
Table 3. Samples of two hundred student learners’ given feedback marks to W2 and calculated UVs for W2
|
W2 |
|||||
|
SL No. |
FV (per week) |
CFV (in %) |
QSC (in %) |
EIE (in %) |
UV (in %) |
|
1 |
15 |
17.44 |
35 |
43 |
22.1 |
|
2 |
30 |
30.00 |
100 |
100 |
92.1 |
|
3 |
85 |
46.20 |
76 |
78 |
64.8 |
|
4 |
15 |
24.59 |
90 |
95 |
90.6 |
|
5 |
37 |
34.58 |
75 |
69 |
64.6 |
|
6 |
55 |
27.50 |
41 |
54 |
34.1 |
|
7 |
40 |
80.00 |
90 |
95 |
91.2 |
|
8 |
68 |
31.19 |
65 |
55 |
64.1 |
|
9 |
60 |
34.88 |
65 |
85 |
64.4 |
|
10 |
30 |
46.15 |
75 |
87 |
88.2 |
Table 14 synoptically shows information obtained from clustering regarding four websites.
GUVs shown in Table 14 can be arranged in the descending order in the following way:
GUV of W2 = GUV of W3 > GUV of W1 > GUV of W4
The above arrangement reflects the fact that according to the proposed method, the ranking of W2 and W3 is highest in terms of served utility measure of student learners and W1 and W4 hold second lowest and lowest rank respectively.
Table 4. Samples of two hundred student learners’ given feedback marks to W3 and calculated UVs for W3
|
W3 |
|||||
|
SL No. |
FV (per week) |
CFV (in %) |
QSC (in %) |
EIE (in%) |
UV (in%) |
|
1 |
43 |
50 |
76 |
84 |
80.3 |
|
2 |
20 |
20.00 |
43 |
45 |
50.7 |
|
3 |
82 |
44.57 |
70 |
76 |
64.7 |
|
4 |
25 |
40.98 |
90 |
85 |
88.9 |
|
5 |
14 |
13.08 |
61 |
77 |
63.8 |
|
6 |
65 |
32.50 |
63 |
50 |
64.2 |
|
7 |
5 |
10.00 |
21 |
10 |
18.9 |
|
8 |
55 |
25.23 |
78 |
74 |
64.4 |
|
9 |
52 |
30.23 |
50 |
56 |
64.1 |
|
10 |
23 |
35.38 |
89 |
92 |
89.5 |
Table 5. Samples of two hundred student learners’ given feedback marks to W4 and calculated UVs for W4
|
W4 |
|||||
|
SL No. |
FV (per week) |
CFV (in%) |
QSC (in %) |
EIE (in %) |
UV (in %) |
|
1 |
7 |
8.14 |
15 |
20 |
19.9 |
|
2 |
25 |
25.00 |
60 |
65 |
63.9 |
|
3 |
5 |
2.72 |
10 |
15 |
18.5 |
|
4 |
11 |
18.03 |
24 |
30 |
23 |
|
5 |
44 |
41.12 |
63 |
72 |
64.6 |
|
6 |
35 |
17.50 |
55 |
65 |
63.6 |
|
7 |
2 |
4.00 |
7 |
9 |
17.3 |
|
8 |
30 |
13.76 |
45 |
28 |
22.3 |
|
9 |
5 |
2.91 |
14 |
12 |
17.9 |
|
10 |
10 |
15.38 |
23 |
25 |
21.4 |
Table 6. Cluster membership statistics of W1
|
Cluster |
Number of UV members |
Valid UVs |
Missing UVs |
MC |
|
1 |
10 |
200 |
0 |
2 |
|
2 |
107 |
|||
|
3 |
83 |
Table 7. Final cluster centers (FCC) of W1
|
Educational Website |
Cluster |
FCC value |
|
W1 |
1 |
89.0 |
|
2 |
22.9 |
|
|
3 |
62.4 |
Table 8. Cluster membership statistics of W2
|
Cluster |
Number of UV members |
Valid UVs |
Missing UVs |
MC |
|
1 |
132 |
200 |
0 |
1 |
|
2 |
27 |
|||
|
3 |
41 |
Results obtained by the application of proposed method portrayed the properly calculated UVs of educational websites from the linguistically represented decisive criteria values feed into suitably designed FIS. No inconsistency is witnessed in the FIS outputs regarding any of the considered educational website’s UVs’ calculation. Legitimate clustering activity is confirmed by K-means clustering results which showed the proper placement of an UV in one of the three clusters depending on inter UV distance similarity measures without leaving any of the considered UVs unassigned to any of the final three clusters. Thereafter, GUVs of the four considered educational websites are obtained successfully form the FCC values of respective MCs of each of the educational websites.
GUV of W2 (62.5) and W3 (62.5) jointly achieved the highest score followed by GUV of W1 (22.9) and W4 (21.9). Hence, W2 and W3 jointly held the highest rank in utility service provided to student learners and subsequent ranks are held by W1 and W4 respectively.
Table 9. Final Cluster Centers (FCC) of W2
|
Educational Website |
Cluster |
FCC value |
|
W2 |
1 |
62.5 |
|
2 |
88.4 |
|
|
3 |
23.9 |
Table 10. Cluster membership statistics of W3
|
Cluster |
Number of UV members |
Valid UVs |
Missing UVs |
MC |
|
1 |
64 |
200 |
0 |
2 |
|
2 |
114 |
|||
|
3 |
22 |
Table 11. Final Cluster Centers (FCC) of W3
|
Educational Website |
Cluster |
FCC value |
|
W3 |
1 |
23.4 |
|
2 |
62.5 |
|
|
3 |
88.0 |
Table 12. Cluster membership statistics of W4
|
Cluster |
Number of UV members |
Valid UVs |
Missing UVs |
MC |
|
1 |
6 |
200 |
0 |
3 |
|
2 |
60 |
|||
|
3 |
134 |
Table 13. Final Cluster Centers (FCC) of W4
|
Educational Website |
Cluster |
FCC value |
|
W4 |
1 |
87.5 |
|
2 |
59.0 |
|
|
3 |
21.9 |
Table 14. MCs, FCC values of MCs and GUVs of W1, W2, W3 and W4
|
Educational Website |
MC |
FCC value of MC |
GUV |
|
W1 |
2 |
22.9 |
22.9 |
|
W2 |
1 |
62.5 |
62.5 |
|
W3 |
2 |
62.5 |
62.5 |
|
W4 |
3 |
21.9 |
21.9 |
This paper presented educational website ranking through fuzzy logic based UV findings and then obtaining GUVs of websites by forming clusters from UV members.
Each individual student learner has given marks to each of the four educational website with respect to decisive criteria CFV, QSC and EIE. UV of each of the four websites is calculated from CFV, QSC and EIE marks given by each individual student learner to each of the four websites. Thus, corresponding to each individual student learner, there are four obtained UVs each which is the UV of one of the four websites. Clearly, in the view of an individual student learner, four educational websites are ranked as per the descending order arrangements of their respective UVs given by that individual student learner. If z (z=2 to 4) number of educational websites have same UV, then top z unallocated ranks are allocated to those z educational websites. In these cases, each of those z educational websites can hold any of the top z unallocated ranks in such a way that no two of those z educational websites hold same rank at the same time instance. This individual ranking, as per the individual UVs related to websites, of the educational websites reflects the personalized website preferences of an individual student learner. In the proposed work, two hundred individual rankings are collected. Now as discussed in Section 5, the proposed system has produced a ranking of four educational websites as per the descending order arrangement their GUVs. In this ranking, it is found that two educational websites such as W2 and W3 are having same GUV. Also, GUV of W2 and W3 is the highest GUV among the GUVs of four educational websites. So, top 2 unallocated ranks i.e. rank 1 and 2 are allocated to W2 and W3. Thus, each of W2 and W3 can hold either rank 1 or rank 2 in such a way that they don’t hold the same rank at the same time instance. It is also found in the proposed method’s ranking that the GUVs of W1 and W4 are found to be the next lowest and lowest among four GUVs respectively. So, W1 and W4 holds rank 3 and rank 4 respectively.
In order to find how beneficial the proposed ranking method can be for the student learners, it is checked that how close the proposed method’s ranking is to the each individual ranking. Number of Same Ranked Websites (NSRW), calculated for each of the two hundred individual ranking cases, is defined as the total number of educational websites whose proposed method’s ranking is exactly same as their individual ranking in an individual ranking case.
Same Ranking Rate (SRR), calculated for each of the two hundred individual ranking cases, is defined as the rate of same ranked educational websites by the proposed method compare to four educational websites. SRR is used to measure the closeness between the proposed ranking and an individual ranking. SRRg, g=1 to 200, denotes the SRR of g th individual ranking case and is calculated as per Eq. (2).
$\mathrm { SRR } _ { \mathrm { g } } = \mathrm { NSRW } _ { \mathrm { g } } / 4$ (2)
NSRWg, g=1 to 200, denotes the NSRW of g th individual ranking case. As the experiment is done on four websites, thus the denominator of equation (2) is 4.
Table 15 shows samples of data set containing two hundred individual UV entries, calculated from student learners’ given feedback marks, for each of W1, W2, W3 and W4. A serial number (SL No.) is associated with each row of Table 15. Individual UVs of shown in Table 15 are collected from the data set whose samples are shown in Tables 2-5.
Table 15. Samples of two hundred individual UVs for each of W1, W2, W3 and W4
|
W1 |
W2 |
W3 |
W4 |
|
|
SL No. |
UV (in%) |
UV (in %) |
UV (in %) |
UV (in %) |
|
1 |
62 |
22.1 |
80.3 |
19.9 |
|
2 |
64.2 |
92.1 |
50.7 |
63.9 |
|
3 |
63.6 |
64.8 |
64.7 |
18.5 |
|
4 |
62.2 |
90.6 |
88.9 |
23 |
|
5 |
21.4 |
64.6 |
63.8 |
64.6 |
|
6 |
63.8 |
34.1 |
64.2 |
63.6 |
|
7 |
16.8 |
91.2 |
18.9 |
17.3 |
|
8 |
64.5 |
64.1 |
64.4 |
22.3 |
|
9 |
64.4 |
64.4 |
64.1 |
17.9 |
|
10 |
19.7 |
88.2 |
89.5 |
21.4 |
Table 16 shows samples of data set containing two hundred entries of individual ranking of W1, W2, W3 and W4 based on their individual UV and the ranking as per proposed method of W1, W2, W3 and W4. Table 16 also shows samples of NSRWs and SRRs calculated using Eq. (2) for each of the two hundred ranking entries. A serial number (SL No.) is associated with each row of Table 16. Each individual ranking and the ranking as per proposed method of educational websites are perfectly done. Also, each ranking as per proposed method is suitably evaluated with respect to corresponding individual ranking. To illustrate this fact, let’s consider some of the examples from the results shown in Table 15 and Table 16. It can be seen in the entries corresponding to SL No. 1 of Table 15 that individual UVs of W1, W2, W3 and W4 are 62, 22.1, 80.3 and 19.9 respectively. Obviously, it can be seen in this example that all the four websites have different UVs. Descending order arrangement of these individual UVs is: UV of W3> UV of W1> UV of W2> UV of W4. Individual ranking entries corresponding to SL No. 1 of Table 16 show that W1, W2, W3 and W4 are ranked as per the descending order arrangements of their individual UVs and thus W1, W2, W3 and W4 holds individual ranks of 2, 3, 1 and 4 respectively. Ranking as per proposed method entries corresponding to SL No. 1 of Table 16 show that W1, W2, W3 and W4 holds proposed method’s ranks of 3, 1 or 2, 1or 2 and 4 respectively. Now clearly, individual ranks of W1 and W2 are not same as their respective proposed method ranks. But, individual rank of W3 is 1 and its proposed method rank is 1 or 2. So, the individual rank of W3 is same as one of the proposed methods ranks of W3. Again, individual rank of W4 is same as its proposed method rank. Thus, corresponding to SL No. 1 of Table 16, we have 2 websites such as W3 and W4 having individual ranks same as their respective proposed method ranks. Therefore, NSRW is obtained as 2. Putting NSRW=2 in Eq. (2), SRR is obtained as 2/4 or 50 %. Again, by comparing individual ranking and ranking as per proposed method entries corresponding to SL No. 3 of Table 16 it is seen that both ranking of each of W1, W2, W3 and W4 are same. Thus, NSRW is obtained as 4 which has given a 100% SRR. Accordingly, many other rankings with corresponding NSRWs and SRRs can be found in Table 16.
Table 16. Samples of two hundred individual ranking and ranking as per proposed method of W1, W2, W3 and W4 with corresponding calculated NSRWs and SRRs
|
Individual Ranking of Educational Websites as per Individual UV |
Ranking of Educational Websites as per Proposed Method |
|||||||||
|
SL No. |
W1 |
W2 |
W3 |
W4 |
W1 |
W2 |
W3 |
W4 |
NSRW |
SRR (in %) |
|
1 |
2 |
3 |
1 |
4 |
3 |
1 or 2 |
1 or 2 |
4 |
2 |
50 |
|
2 |
2 |
1 |
4 |
3 |
3 |
1 or 2 |
1 or 2 |
4 |
1 |
25 |
|
3 |
3 |
1 |
2 |
4 |
3 |
1 or 2 |
1 or 2 |
4 |
4 |
100 |
|
4 |
3 |
1 |
2 |
4 |
3 |
1 or 2 |
1 or 2 |
4 |
4 |
100 |
|
5 |
4 |
1 or 2 |
3 |
1 or 2 |
3 |
1 or 2 |
1 or 2 |
4 |
1 |
25 |
|
6 |
2 |
4 |
1 |
3 |
3 |
1 or 2 |
1 or 2 |
4 |
1 |
25 |
|
7 |
4 |
1 |
2 |
3 |
3 |
1 or 2 |
1 or 2 |
4 |
2 |
50 |
|
8 |
1 |
3 |
2 |
4 |
3 |
1 or 2 |
1 or 2 |
4 |
2 |
50 |
|
9 |
1 or 2 |
1 or 2 |
3 |
4 |
3 |
1 or 2 |
1 or 2 |
4 |
2 |
50 |
|
10 |
4 |
2 |
1 |
3 |
3 |
1 or 2 |
1 or 2 |
4 |
2 |
50 |
Table 17. SRR percentages with number of times they are obtained and the average SRR percentage of two hundred ranking cases
|
SRR |
Average SRR (in %) |
|||||
|
0 % |
25 % |
50 % |
75 % |
100 % |
54.75 % |
|
|
Number of Times Obtained |
13 |
39 |
96 |
1 |
51 |
|
Table 17 shows different SRR percentages and the number of times those are obtained out of two hundred ranking cases. Table 17 also shows the average SRR percentage of two hundred ranking cases. It can be seen from Table 17 that out of two hundred ranking cases 50% SRR is obtained most number of cases. 100% SRR is obtained in second most number of cases and 75% of SRR is obtained only in one case. It can also be seen from Table 17 that a decent average SRR of 55% (approx) is achieved for two hundred ranking cases.
The achieved average SRR shows that the proposed method has successfully produced ranking of educational websites substantially close to each student learner’s individual ranking. Hence, proposed method has not produced any adverse ranking distant apart from student learners’ individual perspective.
Proposed method has shown a noble way of ranking educational websites. Utility measures of the educational websites plays crucial role for the ranking purpose. Fuzzy logic and K-means clustering methods have shown their usefulness to obtain important and accurate results. The problem of identifying most appropriate website has been addressed in this work and the solution offered by the proposed method may provide personalized need of the learner users to feed their brains with knowledge in individually suited way. This is made possible because of using various decisive criteria with inherent mathematical usage or application of fuzzy logic and K-means clustering.
Identifying the usefulness of the educational websites is also addressed by the proposed ranking method with reduced time and complexity issues in a web environment full of perplexities. Reduced time of searching towards identifying appropriate destination demonstrate the effectiveness of the proposed method.
Evaluation of the proposed method shows that its produced ranking converges with the personalized educational website priority ordering of each individual student learner. Thus, the proposed ranking ensures satisfaction and benefits to student learners at individual and personalised level.
As a matter of fact, the proposed method is tested on the data set of engineering domain student learners’ feedback responses. Tests in other educational domains are to be carried in future by incorporating varied utility finding decisive criteria. Use of other machine learning techniques like ANN, fuzzy C-means clustering to extend the proposed method may increase the efficiency of the identification and ranking which are left for future research.
[1] Kohli, S., Mehrotra, S. (2016). A clustering approach for optimization of search result. Journal of Images and Graphics, 4(1): 63-66. https://doi.org/10.18178/joig.4.1
[2] Nagpal, R., Mehrotra, D., Bhatia, P.K., Sharma A. (2015). FAHP approach to rank educational websites on usability. International Journal of Computing and Digital Systems, 4(4): 251-260. https://doi.org/10.12785/ijcds/040404
[3] Grbovic, M., Djuric, N., Guo, S., Vucetic, S. (2013). Supervised clustering of label ranking data using label preference information. Machine Learning, 93(2-3): 191-225. https://doi.org/10.1007/s10994-013-5374-3
[4] Kathuria, A., Jansen, B.J., Hafernik, C., Spink, A. (2010). Classifying the user intent of web queries using k-means clustering. Internet Research, 20(5): 563-581. http://dx.doi.org/10.1108/10662241011084112
[5] Lu, P., Cong, X. (2015). The research on webpage ranking algorithm based on topic-expert documents. Recent Advances in Information and Communication Technology 2015, pp. 195-204. https://doi.org/10.1007/978-3-319-19024-2_20
[6] Srikala, S., Geetha, P., Sampath, P. (2017). Certain issues in web page prediction, classification and clustering in data mining. International Journal of Advanced Engineering, Management and Science (IJAEMS), 3(3): 205-208. https://dx.doi.org/10.24001/ijaems.3.3.9
[7] Krishen A.S. (2013). First impressions count: exploring the importance of website categorisation. International Journal of Computer Applications in Technology, 47(1): 32-43. https://doi.org/ 10.1504/ijcat.2013.054300
[8] Kapoor, A., Singhal, A. (2017). A comparative study of K-means, K-means++ and fuzzy C-means clustering algorithms. 2017 3rd International Conference on Computational Intelligence & Communication Technology (CICT), IEEE, pp. 1-6. http://dx.doi.org/10.1109/CIACT.2017.7977272
[9] Gabriel, M.S.L., William, P., Juan, D.L.V. (2014). Fundamentals of a fuzzy inference system for educational evaluation. 2014 International Conference on Mathematics and Computers in Sciences and in Industry (MCSI), IEEE, pp. 42-47. https://doi.org/10.1109/MCSI.2014.58
[10] Kumar, G., Duhan, N., Sharma, A.K. (2011). Page ranking based on number of visits of links of Web page. 2011 2nd International Conference on Computer and Communication Technology (ICCCT), IEEE, pp. 11-14. https://doi.org/ 10.1109/iccct.2011.6075206
[11] Zeng, W., Li, J. (2014). Fuzzy logic and its application in football team ranking. The Scientific World Journal, 1–6. https://doi.org/10.1155/2014/291650
[12] Herrera-Viedma, E., Pasi, G., Lopez-Herrera, A.G., Porcel, C. (2006). Evaluating the information quality of web sites: A methodology based on fuzzy computing with words. Journal of the American Society for Information Science and Technology, 57(4): 538-549. https://doi.org/10.1002/asi.20308
[13] Sabry, K., Baldwin, L. (2003). Web-based learning interaction and learning styles. British Journal of Educational Technology, 34(4): 443-454. https://doi.org/10.1111/1467-8535.00341
[14] Goodarzi, M.H., Amiri, A. (2009). Evaluating students' learning progress by using fuzzy inference system. 2009 Sixth International Conference on Fuzzy Systems and Knowledge Discovery (FSKD'09), IEEE, pp. 561-565. https://doi.org/10.1109/FSKD.2009.313
[15] Asopa P, Asopa S. (2016). Evaluating student performance using fuzzy inference system in fuzzy ITS. 2016 International Conference on Advances in Computing, Communications and Informatics (ICACCI), IEEE, pp. 1847-1851. http://dx.doi.org/10.1109/ICACCI.2016.7732318