Yifei Lyu | Jie Wang* | Yuhua Zhang | Hao Zeng | Ming Chang
© 2022 IIETA. This article is published by IIETA and is licensed under the CC BY 4.0 license (http://creativecommons.org/licenses/by/4.0/).
OPEN ACCESS
This paper focused on the sustainability of the impact of the Russia-Ukraine conflict on the military spending of NATO allies. As Russia launched a "special military operation" in Ukraine in February 2022, NATO allies announced their intention to significantly increase military spending in response to the "threat" from Russia. However, under the stimulation of the Russia-Ukraine conflict, it is uncertain whether the NATO defense budget increase spree can be sustained. Based on this, this paper analyzed the sustainability of NATO's military spending increase in the context of the Russia-Ukraine conflict by building a vector autoregressive model (VAR). Through the impulse response analysis, this paper concluded that the Russia-Ukraine conflict shock stimulates NATO allies to increase military spending persistently only for about three years.
Russia-Ukraine conflict, NATO, military spending, vector autoregressive model (VAR)
NATO military spending has long been a common concern for countries around the world. As early as 2006, NATO set the goal of "military budget to GDP ratio of no less than 2%" [1]. However, due to the impact of the international financial crisis and the European debt crisis, most NATO countries' military expenditures had increased slowly, and some even showed a downward trend [2]. The growth rate of total military expenditures of NATO allies had gradually decreased after 2008, and in some years, it even showed negative growth, as shown in Figure 1 below. In March 2014, Crimea was incorporated into Russia, and in September of the same year at a NATO summit, the U.S. urged NATO allies to stop cutting military spending and to meet the 2% target set by NATO over the next 10 years [3]. In response to this request, NATO countries began to gradually increase their military spending [4, 5] (as shown in Figure 1 below), increasing the number of members meeting the 2% target from three in 2014 to eight by 2021, including the United States, the United Kingdom, Greece, Poland, Croatia, Estonia, Latvia, and Lithuania.
As Russia launched a "special military operation" in Ukraine in February 2022, NATO allies announced their intention to significantly increase military spending and build up their defense to counter the "threat" from Russia. According to Jane's defense estimates, in addition to the United States, NATO allies will increase military spending by 8.2% in 2022, to $ 394.1 billion. Germany announced its intention to set up a special defense fund totaling 100 billion euros over the next three years for the purchase of modern weapons and equipment, pushing its military spending to more than 2 percent of GDP. In addition, Romania, Poland, Spain and other NATO countries have expressed their desire to increase their military spending to 2% of GDP or more (as shown in Figure 2 below); the leaders of France, Belgium, Norway, Bulgaria and North Macedonia have announced plans to increase their military spending; Finland and Sweden, which are considering applying for NATO membership, have been also considering expanding their defense budgets.
The U.S., which accounts for more than two-thirds of NATO allies' military spending, whose House of Representatives passed the final reconciled version of the National Defense Authorization Act for fiscal year 2023 by a vote of 350 to 80, with a total defense budget of $858 billion, an $80 billion increase over the previous fiscal year's amount and \$45 billion higher than President Biden requested. The FY 2023 defense budget focuses primarily on providing more resources for U.S. forces to counter the so-called "challenge" posed by China and Russia, including at least \$800 million in additional security assistance for Ukraine, 100 million of that will be spent on training UAF pilots to fly U.S. warplanes; \$11.5 billion for the Pacific Deterrence Initiative to enhance U.S. military capabilities in the Indo-Pacific region; and more funding for the development of new weapons and the purchase of weapons such as the Loma F-35 and General Electric-made surface systems and to maintain 31 combat-ready amphibious assault ships for the U.S. Navy, citing the so-called "threat" from the Chinese Navy.
The existing literature has mainly studied the impact of the Russia-Ukraine conflict on financial [6, 7], monetary [8] and commodity [9, 10] markets, health [11-13] and food [14] security, etc. However, it is full of uncertainty whether the frenzy of NATO's defense budget increase stimulated by the Russia-Ukraine conflict can be sustained. Based on this, this paper analyzed the sustainability of NATO's military spending increase in the context of the Russia-Ukraine conflict by building a vector autoregressive model (VAR). The first part of this paper introduces the research background, the second part presents the empirical analysis, and the third part presents the conclusion.
Figure 1. Growth rate of total NATO allied military spending
Figure 2. Military spending as a share of GDP for some NATO members
Table 1. Variable description table
|
Code |
Variable Name |
Variable Identification |
|
RUshock |
Russia-Ukraine conflict shocks |
dummy variable |
|
NATOmex |
NATO military expenditure |
the amount of change in the growth rate of NATO allies' defense spending |
2.1 Models and variables
The vector autoregressive model (VAR model) is a non-structural system of equations model [15]. The model is a multi-equation linkage model in which endogenous variables are regressed on the lagged terms of all endogenous independent variables in each equation to estimate the dynamic relationships of all endogenous variables [16]. VAR is commonly used to predict interconnected time series systems and to analyze the dynamic impact of stochastic perturbations on systems of variables [17].
VAR approach was adopted because it can effectively analyze the dynamic effects of shocks of random standard deviation size on the system variables [18, 19]. Therefore, this paper used STATA software to construct a VAR model of the Russia-Ukraine conflict and NATO allies' military spending to investigate whether the impact of the Russia-Ukraine conflict on NATO's defense budget increase is persistent.
For the empirical study of Russia-Ukraine conflict shocks and NATO military expenditure, this paper constructed the Russia-Ukraine conflict dummy variable RUshock using relevant data from 2006 to 2022 and used it as a proxy variable for Russia-Ukraine conflict shocks; the amount of change in the growth rate of NATO allies' defense spending was calculated as a proxy variable for NATO military expenditure, which was represented by NATOmex, as shown in Table 1 above.
This paper used the dummy variable RUshock to denote the Russia-Ukraine conflict shocks. Considering the integration of Crimea into Russia in March 2014, the United States urged NATO allies to stop cutting military spending and achieve the 2% target set by NATO in the next 10 years at the NATO summit in September of the same year, so the year 2014 was set to 1. In addition, the year 2022 was also set to 1, taking into account the Russian "special military operation" in Ukraine in February 2022. The rest of the years were set to 0. In summary, the dummy variables used in this paper to represent the shock of the Russia-Ukraine conflict were set to 1 for year 2014 and 2022, and 0 for the rest of the years.
In this paper, NATO military expenditures were represented by the change in the growth rate of NATO allied military expenditures, NATOmex, with data from the Stockholm International Peace Research Institute (SIPRI). The amount of change in the growth rate is a dynamic indicator of the degree of change in the trend of NATO military spending growth over a certain period of time, so using the amount of change in the growth rate of NATO allies' military spending as the main variable can verify the persistence of the Russia-Ukraine conflict shock on NATO's increased military spending. It is important to note that the total amount of NATO allied military spending in 2022 is a measured value. According to Jane's defense estimates, the military spending of NATO allies, excluding the United States, will increase by 8.2% in 2022, raising to $394.1 billion; together with the U.S. military spending costs in 2022, this paper obtained the total military spending of NATO allies in 2022, and then calculated the growth rate of NATO allies' military spending from 2006 to 2022, and finally obtained its change amount.
2.2 Stability test
Before constructing the model, this paper performed a unit root test on the variables of interest to determine whether each variable is stationary or not. In this paper, the Augmented Dickey-Fuller test, or ADF test, was used, and the test results obtained are shown in Table 2.
From the above table, it can be seen that the variables RUshock as well as NATOmex pass the test at 5% level of significance, the series are in zero-order singularity and can be directly regressed for analysis.
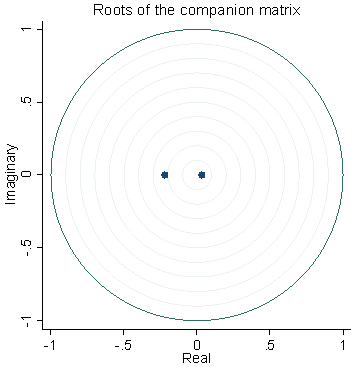
This paper constructed a VAR (1) model and tested whether the impact of the Russia-Ukraine conflict shock on NATO's increased military spending is persistent mainly through impulse response analysis. However, before conducting the impulse response analysis, the model needs to be tested for stability to verify whether the VAR (1) model system is smooth to ensure the reliability of the impulse response analysis results. The sufficient and necessary condition for the stability of the VAR (1) model is that all eigenvalues of $\Pi_1$ should be within the unit circle. Figure 3 above shows the unit circle curve of the VAR (1) model and the location of all the eigenroots. From the figure, it can be seen that all the eigenroots in the VAR (1) model fall within the unit circle, which indicates that the VAR(1) model is smooth and can be subjected to impulse response analysis.
Table 2. Unit root test results
|
Parameter |
Test form |
T-statistic |
5% critical value |
P-value |
Test result |
|
RUshock |
(C,N,0) |
-4.743 |
-3.000 |
0.0001 |
stationary |
|
NATOmex |
(C,N,0) |
-3.975 |
-3.000 |
0.0015 |
stationary |
Figure 3. Unit root location of the VAR (1) model stability test
2.3 Impulse response analysis
The impulse response function portrays the response of the endogenous variables to changes in the magnitude of the error [20]. Specifically, it portrays the effect of adding a shock of normalized size to the error term on the current and future values of the endogenous variables. And for each of the error terms, the endogenous variables correspond to an impulse response function.
This paper constructed a VAR (1) model with the main variables RUshock and NATOmex, respectively, and the model takes the following specific form:
$\left\{\begin{array}{c}\text { RUshock }_t=\alpha_1+\pi_{11.1} \text { RUshock }_{t-1} \\ +\pi_{12.1} \text { NATOMex }_{t-1}+\varepsilon_{1 t} \\ \text { NATOmex }_t=\alpha_2+\pi_{21.1} \text { RUshock }{ }_{t-1} \\ +\pi_{22.1} \text { NATOmex }_{t-1}+\varepsilon_{2 t}\end{array}\right.$ (1)
where, $\varepsilon_{1 t}, \varepsilon_{2 t} \sim \operatorname{IID}\left(0, \sigma^2\right), \operatorname{Cov}\left(\varepsilon_{1 t}, \varepsilon_{2 t}\right)=0$. Written in matrix form as:
$\left[\begin{array}{c}\text { RUshock }_t \\ \text { NATOTex }_t\end{array}\right]=\left[\begin{array}{l}\alpha_1 \\ \alpha_2\end{array}\right]+\left[\begin{array}{ll}\pi_{11.1} & \pi_{12.1} \\ \pi_{21.1} & \pi_{22.1}\end{array}\right]\left[\begin{array}{c}\text { RUshock }_{t-1} \\ \text { NATOmex }_{t-1}\end{array}\right]+\left[\begin{array}{l}\varepsilon_{1 t} \\ \varepsilon_{2 t}\end{array}\right]$ (2)
Set, $\mathrm{Y}_{\mathrm{t}}=\left[\begin{array}{c}\text { RUshock }_t \\ \text { NATOmex }_t\end{array}\right], \quad \mathrm{A}=\left[\begin{array}{c}\alpha_1 \\ \alpha_2\end{array}\right], \cdot \Pi_1=\left[\begin{array}{ll}\pi_{11.1} & \pi_{12.1} \\ \pi_{21.1} & \pi_{22.1}\end{array}\right], \mathrm{E}_t=\left[\begin{array}{c}\varepsilon_{1 t} \\ \varepsilon_{2 t}\end{array}\right]$.
Then,
$Y_t=A+\Pi_1 Y_{t-1}+E_t$ (3)
In the VAR(1) model, $Y_t$ is a 2×1 order time series column vector, Α is a 2×1 order constant term column vector, $\Pi_1$ is a 2×2 order parameter matrix, and $E_t \sim \operatorname{IID}(0, \Omega)$ is a 2×1 order random error column vector, where each element is non-autocorrelated (but correlation may exist between random error terms corresponding to different equations). Since the right-hand side of each equation in the VAR(1) model contains only lagged terms of the endogenous variables, which are uncorrelated with $E_t$, each equation can be estimated in turn by the OLS method, and the obtained parameter estimates are consistent.
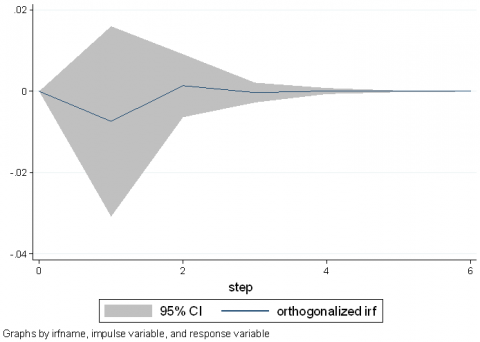
In the above model, if the errors $\varepsilon_{1 t}$ and $\varepsilon_{2 t}$ are not correlated, then $\varepsilon_{1 t}$ is the error term of $R$ Shock $_t$ and $\varepsilon_{2 t}$ is the error term of NATOmex $_t$. The impulse response function of $\varepsilon_{1 t}$ contains the effect of one standard deviation size of the Russia-Ukraine conflict shock on the change in the growth rate of NATO allies' military expenditures in the current period, which is depicted in Figure 4 below. As can be seen from the figure, at the beginning of the period, there is a negative effect of the Russia-Ukraine conflict shock on the growth rate of NATO allies' military expenditures, which peaks at around -0.01 at the end of the first period; after the first period, the negative effect gradually decreases; after several periods of fluctuations, it reaches zero at the end of the third period and remains in a stable state.
Figure 4. Impulse response diagram
Based on the results of the impulse response analysis, this paper can answer two questions: the persistence of the impact of the Russia-Ukraine conflict shock on the growth of NATO allies' military spending, and the impact of the Russia-Ukraine conflict shock on the total military spending of NATO allies. According to the measured values in this paper, the growth rate of total NATO allied military spending in 2022 compared to 2021 is about 0.05. And according to the impulse response analysis, there is a negative impact of about -0.01 on the growth rate of military expenditure of NATO allies in 2023. However, considering that 0.05 is greater than 0.01, it can be concluded that the impact of the Russia-Ukraine conflict shock on the growth rate of total military expenditure of NATO allies in 2023 is gradually decreasing, but the overall trend leading to increased military spending by NATO allies has not changed. The impact of Russia-Ukraine conflict shocks on the growth rate of NATO military spending continues to decrease from year 2023 to 2024, but at the same time, the impact of Russia-Ukraine conflict shocks on the total military spending of NATO allies is also decreasing, and by the end of 2025 the Russia-Ukraine conflict shock will no longer continue to have an impact on the military spending of NATO allies.
The sustainability of NATO allies' defense budget increase binge, spurred by the Russia-Ukraine conflict, is full of uncertainties. This paper analyzed the persistence of NATO's military spending increase in the context of the Russia-Ukraine conflict by building a vector autoregressive model (VAR). Through impulse response analysis, this paper concluded that the persistence of the impact of the Russia-Ukraine conflict shock on NATO allies' military spending increase only lasts for about three years, after which the impact of the Russia-Ukraine conflict shock on NATO allies' military spending will not continue.
This can be explained in two ways. On the one hand, some NATO members lack clear planning and long-term layout for achieving the goal of "no less than 2% defense spending". Denmark plans to achieve the 2 percent target "no later than the end of 2033"; Italy has postponed reaching the target until 2028; and Germany's 100 billion euro fund plan will only exist for three years and will not be able to achieve the 2 percent target after 2025. On the other hand, there are economic challenges to military spending, and the actual rate of increase cannot be accurately predicted. Inflation in the U.S., U.K., Germany and Spain is at a dozen-year high due to the epidemic and the Russia-Ukraine conflict. Rising inflation and economic sanctions against Russia may make it difficult for NATO countries to afford more military spending.
[1] Alozious, J. (2021). NATO’s Two percent guideline: A demand for military expenditure perspective. Defence and Peace Economics, 1-14. https://doi.org/10.1080/10242694.2021.1940649
[2] Haesebrouck, T. (2021). NATO burden sharing after the Wales summit: A generalized set qualitative analysis. Defence and Peace Economics, 1-18. https://doi.org/10.1080/10242694.2021.1928435
[3] Donaldson, R.H. (2017). The role of NATO enlargement in the Ukraine crisis. The Soviet and post-Soviet review, 44(1): 32-52.
[4] Dvorak, J., Pernica, B. (2021). To free or not to free (ride): A comparative analysis of the NATO burden-sharing in the Czech Republic and Lithuania–another insight into the issues of military performance in the Central and Eastern Europe. Defense & Security Analysis, 37(2): 164-176. https://doi.org/10.1080/14751798.2021.1919345
[5] Pavlíčková, K., Gabriela Bartoszewicz, M. (2021). Beyond bare numbers: the qualitative subtleties of free-riding on NATO’s engagement in the Middle East. Defense & Security Analysis, 37(2): 177-192. https://doi.org/10.1080/14751798.2021.1919353
[6] Umar, Z., Polat, O., Choi, S.Y., Teplova, T. (2022). The impact of the Russia-Ukraine conflict on the connectedness of financial markets. Finance Research Letters, 102976. https://doi.org/10.1016/j.frl.2022.102976
[7] Gaio, L.E., Stefanelli, N.O., Júnior, T.P., Bonacim, C.A.G., Gatsios, R.C. (2022). The impact of the Russia-Ukraine conflict on market efficiency: Evidence for the developed stock market. Finance Research Letters, 50: 103302. https://doi.org/10.1016/j.frl.2022.103302
[8] Chortane, S.G., Pandey, D.K. (2022). Does the Russia-Ukraine war lead to currency asymmetries? A US dollar tale. The Journal of Economic Asymmetries, 26: e00265. https://doi.org/10.1016/j.jeca.2022.e00265
[9] Alam, M.K., Tabash, M.I., Billah, M., Kumar, S., Anagreh, S. (2022). The impacts of the Russia–Ukraine invasion on global markets and commodities: A dynamic connectedness among G7 and BRIC Markets. Journal of Risk and Financial Management, 15(8): 352. https://doi.org/10.3390/jrfm15080352
[10] Just, M., Echaust, K. (2022). Dynamic spillover transmission in agricultural commodity markets: What has changed after the COVID-19 threat?. Economics Letters, 217: 110671. https://doi.org/10.1016/j.econlet.2022.110671
[11] Chaaya, C., Thambi, V.D., Sabuncu, Ö., Abedi, R., Osman, A.O.A., Uwishema, O., Onyeaka, H. (2022). Ukraine–Russia crisis and its impacts on the mental health of Ukrainian young people during the COVID-19 pandemic. Annals of Medicine and Surgery, 79: 104033. https://doi.org/10.1016/j.amsu.2022.104033
[12] Uwishema, O., Sujanamulk, B., Abbass, M., Fawaz, R., Javed, A., Aboudib, K., Onyeaka, H. (2022). Russia-Ukraine conflict and COVID-19: A double burden for Ukraine’s healthcare system and a concern for global citizens. Postgraduate Medical Journal. http://dx.doi.org/10.1136/postgradmedj-2022-141895
[13] Ramírez, C., Durón, R.M. (2022). The Russia-Ukraine war could bring catastrophic public-health challenges beyond COVID-19. International Journal of Infectious Diseases, 120: 44. http://dx.doi.org/10.1016/j.ijid.2022.04.016
[14] Ben Hassen, T., El Bilali, H. (2022). Impacts of the Russia-Ukraine war on global food security: towards more sustainable and resilient food systems?. Foods, 11(15): 2301. https://doi.org/10.3390/foods11152301
[15] Sims, C.A. (1980). Macroeconomics and reality. Econometrica: journal of the Econometric Society, 48(1): 1-48. https://doi.org/10.2307/1912017
[16] Hallin, M., La Vecchia, D., Liu, H. (2023). Rank-based testing for semiparametric VAR models: a measure transportation approach. Bernoulli, 29(1): 229-273. https://doi.org/10.3150/21-BEJ1456
[17] Jordan, S., Philips, A.Q. (2018). Cointegration testing and dynamic simulations of autoregressive distributed lag models. The Stata Journal, 18(4): 902-923. https://doi.org/10.1177/1536867X1801800409
[18] Dallakyan, A., Kim, R., Pourahmadi, M. (2022). Time series graphical lasso and sparse VAR estimation. Computational Statistics & Data Analysis, 176: 107557. https://doi.org/10.1016/j.csda.2022.107557
[19] Ditzen, J. (2018). Estimating dynamic common-correlated effects in Stata. The Stata Journal, 18(3): 585-617. https://doi.org/10.1177/1536867X1801800306
[20] Pesaran, M.H., Shin, Y. (1995). An autoregressive distributed lag modelling approach to cointegration analysis. Faculty of Economics, University of Cambridge, 1995.