Candiwan Candiwan* | Mufidatul Azmi | Andry Alamsyah
© 2022 IIETA. This article is published by IIETA and is licensed under the CC BY 4.0 license (http://creativecommons.org/licenses/by/4.0/).
OPEN ACCESS
Behavior in using inappropriate technology and low level of individual awareness causes a high risk of cybercrime. This study aims to see the behavior and awareness of information security among users of the Zoom application, especially in the COVID-19 era in Indonesia. The measurement scales used in this study were RBS (Risky Behavior Scale), CBS (Conservative Behavior Scale), EOS (Exposure Offence Scale), and RPS (Risk Perception Scale). This research used an online questionnaire to collect data with 400 respondents. Data analysis techniques used the Independent Sample T-Test, Mann Whitney, One Way Anova, Krusskal Wallis, Tukey, Pairwise Comparison, and Spearman Rank, which were processed using the SPSS program. The results showed significant differences between demographics on behavior and information security awareness. Daily Internet usage time influenced behavior and awareness of information security. Security behavior and awareness of information security are essential to determine the risks due to behavior and lack of awareness of information security. The most important findings in this study can be used as a reference in designing information security training. Further studies are expected to add other variables such as psychography, geography, or other users of different video conferencing applications such as Google Meet, Microsoft Team, and Webex.
information security behavior, information security awareness, zoom video conference, COVID-19
Cybercrimes can well be described as hidden crimes [1]. At the same time, victims of cybercrime are willing to be hidden victims [2]. Cybercrime is harder to prove. Cybercrime can be done by using any equipment that is connected to the internet. A perpetrator is a person who is very familiar with the internet. This act causes material and immaterial losses [3]. The type of cybercrime that usually occurs in network application software is credential stuffing. Credential Stuffing is a process where all of the credentials of the users of the target are gathered from breached data that is available on the internet. If those people haven’t changed their password yet, it can be a major security threat to the users and organizations [4].
Zoom is one of the video conference applications currently widely used due to the limited space for direct meetings. Bernstein Zane Chrane and Michelle Isaacs, analysts from the United States, estimated that the Zoom application has 173 million monthly active users as of May 27, 2020 [5]. Amid the increasing number of users, Zoom Video Communication, Inc. is experiencing a cybercrime problem. Cybercrime is a form of crime caused by the use of Internet technology. It can be defined as an illegal act committed using the Internet based on computer and telecommunication technology sophistication. This can happen on various platforms on the Internet, and even communication technology companies can be impacted. Zoom Video Communication, Inc. experienced a user data leak. The Internet security expert Bleeping Computer found around 530,000 Zoom users' data were sold on cybercrime sites at a price of US $ 0.002 or around 31 IDR per account. Transacted user information includes email addresses, passwords, URLs, personal meetings, and User HostKey [6]. This phenomenon namely credential stuffing where the hackers try to access all accounts with the same user name, so they can steal data of the user. Cybercrime data leak also reported related to the Zoom application is Zoombombing, an act of attack from outside parties entering online meeting rooms to disrupt the running of online meetings [7]. The Zoom application then received a lot of criticism related to information security, but this issue did not affect the number of Zoom users. The number of Zoom users was reported to increase every week [8]. Cybersecurity can occur due to restrictions related to user privacy by information and communication technology service companies that are often unclear and subject to legal interpretation, resulting in users having an obligation to be aware of threats and protect their personal information. Behavior in using inappropriate technology and a low level of individual awareness causes a high risk associated with cybercrime [9].
Based on the phenomena and problems described above, the increase of users of the Zoom application in the COVID-19 era was also accompanied by cybercrime attacking users. This study aims to determine the behavior and awareness of information security of Zoom users in the COVID-19 era in Indonesia. We will conduct research entitled "Behavior Analysis and Information Security Awareness of Zoom Application Users in the COVID-19 Era."
People who have more knowledge are more aware of potential security risks but are also more vulnerable to risky behavior in using information systems [10]. It’s because people who have a lot of knowledge about information systems spend more time on the internet. Doing the same thing over and over makes people feel more safe and secure than they really are, not thinking about possible risks so they become more vulnerable [10]. Students have riskier behavior. Adults who have a job are more aware and know more about the risk of using the information system [10]. In addition, the more time teenagers spend on the Internet, the higher the risk of privacy and information security they face [11].
Security threats come from cyberspace or external parties, the environment, and internal organizations. For example, sales of information by internal parties, document theft, natural disasters, illegal data changes, etc. [12], and social network users have a risk tendency and tend to be victims of cybercrime [13].
Cyber engagement, in general, has motivated academics and practitioners to focus on attitudes and behaviors related to cyber threats [14]. Employees are one of the users who have a lot of involvement with cyberspace. Employees' experience of using information technology positively affects their perception of vulnerabilities caused by cybercrime incidents because people who have a lot of experience can find out the gaps and weaknesses of information systems that can cause cybercrime.
Barriers perceived by employees have a negative impact on cybersecurity behavior [15]. It is important, therefore, to develop effective methods for educating employees about organizational policies and procedures. In terms of information security behavior, training strategies can be targeted according to the most vulnerable information security areas [16]. Information security awareness indirectly affects employee compliance through employee confidence [17].
Along with the development of information technology, cybercrime cases are increasing. One area that is very synonymous with cybercrime is banking. Humans are recognized as the main factor in overcoming the problem of information security in banking. Banking customers need to reduce risky behavior to reduce exposure to cybercrime in online banking [18].
Based on research conducted by Kruger and Kearney [19], behavior is one dimension that to be measured for information security awareness beside knowledge and attitude. Furthermore, based on Human Aspects of Information Security Questionnaire (HAIS-Q), behavior dimension has seven focus areas, one of them is mobile computing that discuss about network user behavior. It investigates about physically securing personal electronic devices, sending sensitive information via mobile networks, and checking work email via free network [20].
In the use of information technology, there are many risks faced. Information security risk is caused by the behavior of sharing information on social media or social networks [21]. Some indicators of password change and scanning of all email attachments need to be consider regarding the risk [22]. This indicator can reduce the risk of using information technology because it can prevent data theft which can occur due to credential stuffing, and preventing malicious email access.
Knowledge that involves awareness or understanding is acquired through experience, familiarity, or learning [23]. Advances in information technology have changed people's lives, especially by facilitating services [24].
Information technology security (ICT) and cybersecurity urgently need continuous innovation [25]. Many studies have been carried out as a raw material for innovation. The results of research on information security vary widely. However, in Indonesia itself, it is still quite rare [26].
Information security is the state of protecting information regarding the needs of individuals, society, and the state regardless of internal and external threats [27]. The study, entitled “Personal Information Security and Awareness Analysis” only focuses on one demographic aspect, where the work is mainly in universities [9]. The data were analyzed with descriptive and inferential statistics, same with the research entitled "Relationship between self-care behaviors and quality of life in patients with heart failure" used the Independent Sample T-Test, Anova, Mann Whitney, and Kruskal Wallis as data analysis techniques [28].
Therefore, four demographic aspects will be studied in this study, namely gender, occupation, educational background, and generation. The results of this study can then produce findings that can be used in designing a more targeted information security training program.
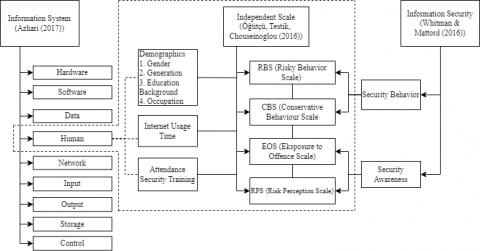
Information systems, in general, can be said to be a human and machine system that is integrated into the provision of information to support management operation functions and determine alternative actions in the organizational system. Information system components are grouped into software, hardware, data, humans, networks, input, output, storage, and control [29]. Information security is the protection of the confidentiality, integrity, and availability of information assets, either in storage, processing, or transmission through the application of policies, education, training and awareness, and technology [30]. In information security, there is a dimension of security behavior. Behavior is a study that studies human behavior starting from individual behavior, groups, and its effects on activities carried out [31]. Awareness of information security is a part of the Security Education, Training, and Awareness (SETA) program dedicated to keeping users aware of crucial issues related to information security through the use of newsletters, posters, and other methods [32]. This study used a quantitative descriptive method because it explains how the behavior and awareness of the information security of users of the Zoom application in the COVID-19 era are. This research is cross-sectional, in which data collection is done at one time only. A cross-sectional study is a study that studies the dynamics of the correlation between risk factors and effects using an observation approach or data collection once [33]. The following is the framework used in this study.
Based on the framework model in Figure 1, the hypotheses in this study are as follows:
H1: Demographic affects Information Security Behavior and Awareness;
H1a: Males behave more securely than females;
H1b: Males are more aware of security threats than females;
H1c: X generation behaves more securely than Y generation and Z generation;
H1d: Z generation is more aware of security threats than Y generation and X generation;
Figure 1. Framework model
H1e: Those with a postgraduate educational background behave more securely;
H1f: Those with a postgraduate educational background are more aware of security threats;
H1g: Teachers behave more securely;
H1h: Lecturers are more aware of security threats.
Demographic segmentation divides the market into gender, generation, educational background, family size, family cycle, income, race, nationality, and social class. This variable is very popular because it is related to the needs and desires of consumers [34].
H2: The duration of time spent on the Internet affects behavior and information security awareness.
H3: The presence of information security training affects behavior and awareness of information security.
H4: There is a significant relationship among the mean scale values of RBS, CBS, EOS, RPS.
Four scales can be used in measuring behavior and awareness of information security, namely [9]:
1. RBS (Risky Behavior Scale) measures the degree of risk of users of information systems related to behavior.
2. CBS (Conservative Behavior Scale) measures how careful users are when using information systems.
3. EOS (Exposure to Offence Scale) measures users' exposure to cybersecurity incidents due to their behavior.
4. RPS (Risk Perception Scale measures the level of danger or risk associated with information technology.
This research adopted a quantitative approach. Samples are part of the number and characteristics possessed by the population, or a small part of the population members taken according to specific procedures so that they can represent the population [33]. There were 257,853 users of the Zoom application in Indonesia based on data obtained from Statqo Analytics until March 2020. Samples were found based on the Slovin formula. The number of samples was 400. The instrument used in this research was a survey using an online questionnaire with a Google Form, distributed to various types of social media. Below are the results of testing the reliability of the research instrument.
Table 1. Result for reliability test
|
No. |
Item |
N of Item |
Cronbach's Alpha |
R Table |
Result |
|
1 |
RBS |
21 |
0.809 |
0.6 |
Reliable |
|
2 |
CBS |
26 |
0.882 |
0.6 |
Reliable |
|
3 |
EOS |
8 |
0.941 |
0.6 |
Reliable |
|
4 |
RPS |
28 |
0.894 |
0.6 |
Reliable |
Based on Table 1, it was found that the research instrument used was valid and reliable because the Cronbach’s alpha value was greater than the R table value.
Before the reliability test, we also conduct the validity test, using 5% significance value and R table value 0.361. All of the item scales are valid because all of the corrected value is more than 0.361.
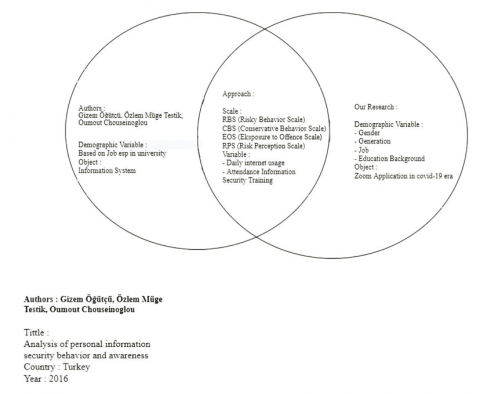
The Figure 2 below is the approach used based on previous research.
In this research, the journal referenced [9] entitled "Analysis of Personal Information Security and Awareness." Previous studies only examined demographic variables based on occupation, especially in universities with a more general object, namely information systems. However, this study examines more dimensions in demographic variables, namely gender, generation, occupation, and educational background, with the object zoom application in the COVID-19 era.
The questionnaire of RBS, CBS, and EOS used a 5-point Likert scale starting from Never (1), Infrequently (2), Sometimes (3), Often (4), and Always (5). The RPS scale (Risk Perception Scale) starts from Don't Know (1), Not Dangerous (2), Slightly Dangerous (3), Dangerous (4), Very Dangerous (5) [9].
The data were analyzed with descriptive and inferential statistics used the Independent Sample T-Test, Anova, Mann Whitney, and Kruskal Wallis as data analysis techniques. After testing the normality and homogeneity, the RBS and CBS variables met the requirements for the parametric test because the data were normally distributed and homogeneous, so the independent Sample T-Test and Anova with the Tukey Advanced Test were used. In contrast, the variables EOS and RPS did not meet the requirements in the parametric test because the data were not normally distributed and not homogeneous. So a non-parametric test was carried out as an alternative test, namely Mann Whitney, Kruskal Wallis, and pairwise comparisons. In addition, to determine the relationship among the four measurement variables (RBS, CBS, EOS, RPS), the Spearman Rank Correlation test was carried out on the four measurement variables. Figure 3 is a diagram of data processing carried out in this study.
Figure 2. Research approach based on previous research
Figure 3. Data analysis techniques
Based on Figure 3, the following are the understanding and basis of decision-making for each data analysis technique. Independent-Sample T-Test is used to test the significance of the difference in the two groups' mean [35]. The Mann-Whitney technique is used to test the significance of the comparative hypothesis of two independent samples if the data are in the ordinal form.
One way Anova is a comparative test widely used in testing the difference of the mean (average) of data consisting of more than two groups [36]. Tukey's test is a test that has an extremely high level, which means that if the test shows that there are conditions of two treatment averages that are significantly different, then the results of the Tukey test cannot be significantly different [37]. Kruskal-Wallis test is a non-parametric test used to compare three or more groups of sample data [38]. A pairwise comparison is a further test used to compare the average value of all groups after testing variations using the Kruskal Wallis test. The following items are the basis for making decisions:
If the significance value is smaller than 0.05, it means there is a significant difference, and we have to use further tests to find out the difference.
Spearman's rank correlation coefficient test is used to determine the correlation or relationship among variables, the closeness of the relationship among variables, and the type of relationship among variables. The basic for concluding the types of the correlation coefficient among variables are as follows:
The basis for concluding the direction of the relationship among variables is as follows:
Descriptive analysis that using in this research is data portrait analysis, where the value is presented as absolute amounts or percentage of the total, and also use central trend analysis of data, where the value is presented as mean, median, and mode [33]. It can be supported in the analysis of further tests, wherein the further tests only indicators that have significant differences are shown, with the existence of central trend analysis can find out which indicators have a higher or lower value based on demographic.
Based on the results of the descriptive analysis carried out on the behavior and information security awareness of users of the Zoom application in the COVID-19 era, on the RBS (Risky Behavior Scale) scale, which shows risky behavior, 84% of respondents have used the same password on several accounts including the Zoom application. This puts the respondent at risk of cybercrime attacking email. All accounts will be affected when an email is used on multiple accounts. Only 7% of people always share their zoom password with others, and only 4% of people change their password regularly. As many as 74% of respondents have provided information on phone numbers when registering for a Zoom application account. This presents a risk of cybercrime that can attack via phone numbers. As many as 70% of respondents have shared participation IDs and online meeting links in public forums this risks cybercrime, especially Zoombombing, which could attack when an online meeting is in progress. On the EOS scale (Exposure to Offence Scale), which shows exposure to cybercrime, more than 70% of respondents have never been exposed to cybercrime.
After descriptive analysis, below are the results of hypothesis testing.
H1: Demographic affects Information Security Behavior and Awareness
The demographic groups used as variables in this study were gender, generation, educational background, and occupation. The following is a table of the results of the tests carried out.
1. Based on gender
Based on Table 2, it can be seen that, on all measurement scales used, the asymp value. Sig. (2-Tailed) is smaller than 0.05 as the significance level. It can be concluded that there are significant differences in Zoom application users in the COVID-19 era based on gender toward behavior and awareness of information security.
Based on further test and descriptive analysis of the trend among scales on the RBS, it indicates that men have riskier behavior than women. The CBS scale indicates that men are more careful in using information technology. On the EOS scale, it indicates that women are more often exposed to cybercrime. On the RPS scale, it suggests that men have a higher risk perception. It can be concluded that H1a “males behave more securely than female” and H1b “males are more aware of security threats than females” are accepted.
Table 2. Significant difference based on demographic
|
No. |
Variable |
Demographic |
|||
|
Gender (Sig.) |
Generation (Sig.) |
Educational Background (Sig.) |
Occupation (Sig.) |
||
|
|
|
Independent Sample T Test |
|
One Way Anova |
|
|
1. |
RBS |
0.000 |
0.000 |
0.000 |
0.000 |
|
2. |
CBS |
0.007 |
0.000 |
0.000 |
0.017 |
|
|
|
Mann Whitney |
|
Kruskall Wallis |
|
|
3. |
EOS |
0.005 |
0.000 |
0.000 |
0.000 |
|
4. |
RPS |
0.003 |
0.000 |
0.020 |
0.000 |
2. Based on generation
Based on Table 2, it can be seen that, on all measurement scales used, the significance level is less than 0.05. It can be concluded that there are significant differences among users of the Zoom application in the COVID-19 era based on generations of behavior and awareness of information security. So Tukey test and Pairwise Comparison as a further test are carried out.
Based on a further test and descriptive analysis of the trend among scales on the RBS, it indicates that the Y generation has a riskier behavior. Based on CBS scales it indicates that the X generation is more careful in using information technology. Based on EOS scales it indicates that the Z generation is more often exposed to cybercrime. On the RPS scale, it indicates that the X generation has a better risk perception. It can be concluded that H1c “X generation behaves more securely than Y generation and Z generation” and H1d “Z generation is more aware of security threats than Y generation and X generation” are accepted.
3. Based on education background
Based on Table 2, it can be seen that, on all measurement scales used, the significance level is less than 0.05. It can be concluded that there is a significant relationship among users of the Zoom application in the COVID-19 era based on an educational background on behavior and awareness of information security. To find out the location of the difference, a further test is carried out. Tukey test and Pairwise Comparison as a further test are carried out.
Based on a further test and descriptive analysis of the trend among scales on the RBS, it indicates that respondents with an elementary education background have riskier behavior. On the CBS scale, it indicates that respondents with a postgraduate education background are more careful in using information technology. On the EOS scale, it indicates that respondents with a senior high school education background are more frequently exposed to cybercrime. On the RPS scale, it indicates that respondents with a graduate background have a better risk perception. Therefore, it is known that the higher the educational background, the higher the perception of risk. It can be concluded that H1e “Those with a postgraduate educational background behave more securely” and H1f “Those with a postgraduate educational background are more aware of security threats” are accepted.
4. Based on occupation
Based on Table 2, it can be seen that, on all measurement scales used, the significance level is less than 0.05. It can be concluded that there is a significant relationship among users of the Zoom application in the COVID-19 era based on occupation on behavior and awareness of information security. To find out the location of the difference, Tukey test and Pairwise Comparison as a further test are carried out.
Based on a further test and descriptive analysis of the trend among scales on the CBS scale, it indicates that teachers are more careful in using information technology. On the RPS scale, it indicates that the lecturers have a better risk perception. On the RBS scale, it indicates that students have riskier behavior and on the EOS scale indicates that students are exposed to cybercrime more frequently. Students must pay more attention to the risks that can cause cybercrime. Therefore, it is also important to conduct information security socialization related to cybercrime, avoid cybercrime, and report when exposed to cybercrime. However, it be concluded that H1g “Teachers behave more securely” and H1h “Lecturers are more aware of security threats” are accepted.
Based on the previous research [9], the demographic item is only occupation in university. But in this research demographic consists of gender, generation, educational background, and occupation that’s why we only make comparison only in occupation.
H2: The duration of time spent on the Internet affects behavior and awareness of information security
The table below is the test result based on the duration of time spent on the Internet.
Table 3. Significant differences based on the duration of time spent on the Internet
|
No. |
Variable |
Data Analysis Techniques |
Sig. |
Significance level |
|
1 |
RBS |
One Way Anova |
0.00 |
0.05 |
|
2 |
CBS |
One Way Anova |
0021 |
0.05 |
|
3 |
EOS |
Kruskal Wallis |
0.132 |
0.05 |
|
4 |
RPS |
Kruskal Wallis |
0.051 |
0.05 |
Based on Table 3, it can be seen that on EOS and RPS, there is no significant difference because the significance value is more than 0.05. Furthermore, the Spearman rank correlation test was used to determine the relationship in each scale to the daily Internet usage time. The following is the table of correlation test results.
Table 4. Correlation between Internet use time and RBS CBS EOS RP
|
|
RBS |
CBS |
EOS |
RPS |
|||
|
Internet use time |
Correlation Coefficient |
.221** |
.149** |
-.118* |
.128* |
||
|
Sig. (2-tailed) |
0 |
0.003 |
0.018 |
0.01 |
|||
|
|
N |
400 |
400 |
400 |
400 |
||
Based on Table 4, it is known that there is a relationship between:
1. Internet Usage Time - RBS Sig. 0.00
It has a correlation coefficient value of 0.221, which is included in the fragile correlation category, and is positive, which means that the relationship between the two variables is unidirectional. If the Internet use time increases, risky behavior will also increase, and vice versa.
2. Internet usage time - CBS Sig. 0.03
It has a correlation coefficient value of 0.149, which is included in the fragile correlation category, and is positive, which means that the relationship between the two variables is unidirectional. When daily Internet usage time increases, conservative behavior also increases, and vice versa.
3. Internet usage time - EOS Sig. 0.018
It has a negative correlation coefficient value of -0.118, which means that the relationship between the two variables is unidirectional. When daily Internet usage time increases, the level of exposure to cybercrime decreases, and vice versa.
4. Internet usage time - RPS Sig. 0.01
It has a correlation coefficient value of 0.128, which is included in the fragile correlation category, and is positive, which means that the relationship between the two variables is unidirectional. When daily Internet usage time increases, the risk of perception also increases, and vice versa.
This is in line with previous research, which states that the more time respondents spend on the Internet, the risky behavior, conservative behavior, and perception of risk also increase [9]. This is in line with another previous research which states that the more time spent on the Internet, the higher the privacy risk that could occur [9].
H3: The presence of information security training affects behavior and awareness of information security
The table below is a test result based on the presence of information security training.
Based on Table 5, it can be seen that, on all measurement scales used, the asymp value Sig. (2-Tailed) is greater than the significance level. It can be concluded that there is no significant difference among users of Zoom applications in the COVID-19 era based on the presence of security training information. This is different from previous research, which states that the presence of information security training affects information security behavior and awareness [10]. This can occur because information security training programs have not focused too much on video conferencing applications, currently in large numbers. Therefore, it is essential to design a special security socialization program to provide education that is more focused on video conferencing applications. It would be more effective to use a pop-up message regarding security awareness, so when users using zoom, they can see the message related to socialization.
H4: There is a significant relationship between the mean scale values of RBS, CBS, EOS, and RPS
The table below is the result of the correlation test between RBS, CBS, EOS, and RPS.
Based on Table 6, it is known that there is a relationship between:
1. RBS – CBS Sig. 0.00
It has a correlation coefficient value of 0.567, which is included in the strong correlation category, and is positive, which means that the relationship between the two variables is unidirectional.
2. RBS – RPS Sig. 0.00
It has a correlation coefficient value of 0.236, which is included in the fragile correlation category, and is positive, which means that the relationship between the two variables is unidirectional.
3. CBS – RPS Sig. 0.00
It has a correlation coefficient value of 0.312, which is included in the sufficient correlation category, and is positive, which means that the relationship between the two variables is unidirectional.
Other relationships of variables are not correlated because significance values are more than 0.05.
Based on the result we can see that when risky behavior, and level of caution increase, perception of risk is also increase. Therefore, it is important to conduct a special training program that could be informed by email broadcast from zoom because zoom has all the email addresses of users. The training is designed to provide education so that risky behavior decreases and caution behavior and risk perceptions continue to increase.
Table 5. Significant differences based on presence of information security training
|
No. |
Variable |
Data Analysis Techniques |
Asymp. Sig. (2-Tailed) |
Significance level |
|
1 |
RBS |
Independent Sample T-Test |
0.460 |
0.05 |
|
2 |
CBS |
Independent Sample T-Test |
0.734 |
0.05 |
|
3 |
EOS |
Mann Whitney |
0.611 |
0.05 |
|
4 |
RPS |
Mann Whitney |
0.839 |
0.05 |
Table 6. Correlation between scales
|
|
RBS |
CBS |
EOS |
RPS |
||
|
Correlation Coefficient |
RBS |
Correlation Coefficient |
1 |
.567** |
0 |
.236** |
|
Sig. (2-tailed) |
. |
0 |
0.992 |
0 |
||
|
N |
400 |
400 |
400 |
400 |
||
|
CBS |
Correlation Coefficient |
.567** |
1 |
-0.049 |
.312** |
|
|
Sig. (2-tailed) |
0 |
. |
0.325 |
0 |
||
|
N |
400 |
400 |
400 |
400 |
||
|
EOS |
Correlation Coefficient |
0 |
-0.049 |
1 |
0.094 |
|
|
Sig. (2-tailed) |
0.992 |
0.325 |
. |
0.06 |
||
|
N |
400 |
400 |
400 |
400 |
||
|
RPS |
|
.236** |
.312** |
0.094 |
1 |
|
|
Sig. (2-tailed) |
0 |
0 |
0.06 |
. |
||
|
N |
400 |
400 |
400 |
400 |
||
In demographics, based on gender, men have more risky behavior, but women have a higher exposure to cybercrime. Based on generation, the Y generation has risky behavior, but the Z generation has a higher exposure to cybercrime. Based on the educational background of Zoom application users with an elementary school education background, the behavior is riskier. Those with a high school senior education background have a higher exposure to cybercrime. It is known that the higher the educational background also experience increases the behavior and security awareness. Based on occupation, students have more risky behaviors, but college students have higher levels of cybercrime exposure. This indicates that they must pay more attention to the risks that can cause cybercrime. Therefore, it is also important to conduct information security socialization related to cybercrime, avoid cybercrime, and report when exposed to cybercrime.
When daily internet usage time increases, risk behavior, caution behavior, and perceptions of risk also increase. In addition, there is a negative correlation between daily internet usage time and exposure, which means that when daily internet usage time increases, exposure to cybercrime decreases, and vice-versa.
Based on the analysis, when risky behavior increases, the level of caution and risk perceptions also increases. It would be even better if a special training program could be informed by email broadcast from zoom because zoom has all the email addresses of users. The training is designed to provide education so that risky behavior decreases and caution behavior and risk perceptions continue to increase.
There is no significant difference between respondents who participated in information security training and participants who never attended information security training. This can occur because information security training programs have not focused too much on video conferencing applications, which is being widely used. Therefore, it is essential to design a special security socialization program that is more focused on video conferencing applications. It would be more effective to use a pop-up message regarding security awareness when users using zoom.
In this study, variables and indicators of behavior and information security awareness can be used as reference material for further research. This study uses demographic variables. Further researchers are expected to add other variables such as psychography or geography. This research can be developed on users of different video conferencing applications such as Google Meet, Microsoft Team, and WebEx. Further research can also use more general applications related to personal data, such as digital credit card applications: Kredivo and Akulaku. So, it can obtain findings with different characteristics.
We thank the respondents who fill the questionaries and Telkom University for their support, especially for providing some papers of references.
[1] Li, X. (2018). Crucial elements in law enforcement against cybercrime. International Journal of Information Security Science, 7(3): 140-158.
[2] Cook, D. (1997). Poverty, Crime and Punishment. London: CPAG.
[3] Fuady, M.E. (2005). “Cybercrime”: Fenomena Kejahatan melalui Internet di Indonesia. Mediator: Jurnal Komunikasi, 6(2): 255-264. https://doi.org/10.29313/mediator.v6i2.1194
[4] Saraswathi, V.R., Ahmed, I.S., Reddy, S.M., Akshay, S., Reddy, V.M., Reddy, S.M. (2022). Automation of recon process for ethical hackers. 2022 International Conference for Advancement in Technology (ICONAT), pp. 1-6. https://doi.org/10.1109/iconat53423.2022.9726077
[5] Novet. J. (2020). Zoom Revenue grew 169% during the quarter, and the company doubled its revenue guidance for the year. https://www.cnbc.com/2020/06/02/zoom-zm-earnings-q1-2021.html, accessed on May 15, 2021.
[6] Lawrence, A. (2020). Over 500.000 zoom accounts sold on hacker forums on the dark web. https://www.bleepingcomputer.com/news/security/over-500-000-zoom-accounts-sold-on-hacker-forums-the-dark-web/, accessed on May 15, 2021.
[7] Iskandar. (2020). Apa itu zoombombing. https://www.liputan6.com/tekno/read/4229453/apa-itu- zoombombing-serangan-yang-bikin-pengguna-zoom-resah, accessed on May 15, 2021.
[8] Triharyanto. (2020). Jumlah Pengguna Zoom Terus Naik Meskipun ada Isu Keamanan. https://tekno.kompas.com/read/2020/04/25/17160067/jumlah-pengguna-zoom-terus-naik-meskipun-ada-isu-keamanan, accessed on May 15, 2021.
[9] Öʇütçü, G., Testik, Ö.M., Chouseinoglou, O. (2016). Analysis of personal information security behavior and awareness. Computers and Security, 56: 83-93. https://doi.org/10.1016/j.cose.2015.10.002
[10] Velki, T., Romstein, K. (2018). User risky behavior and security awareness through the lifespan. International Journal of Electrical and Computer Engineering Systems, 9(2): 53-60. https://doi.org/10.32985/ijeces.9.2.2
[11] Letica, I.B. (2019). Some correlates of risky user behavior and ICT security awareness of secondary school students. International Journal of Electrical and Computer Engineering Systems, 10(2): 85-89. https://doi.org/10.32985/ijeces.10.2.4
[12] Candiwan, P., Sari, P.K., Nurshabrina, N. (2016). Assessment of information security management on Indonesian higher education institutions. In: Sulaiman, H., Othman, M., Othman, M., Rahim, Y., Pee, N. (eds) Advanced Computer and Communication Engineering Technology. Lecture Notes in Electrical Engineering, vol 362. Springer, Cham. https://doi.org/10.1007/978-3-319-24584-3_31
[13] van Schaik, P., Jansen, J., Onibokun, J., Camp, L.J., Kusev, P. (2017). Security and privacy in online social networking: risk perception and precautionary behavior. Computers in Human Behavior, 78: 283-297. https://doi.org/10.1016/j.chb.2017.10.007
[14] Zwilling, M., Klien, G., Lesjak, D., Wiechetek, Ł., Cetin, F. Basim, H.N. (2020). Cyber security awareness, knowledge and behavior: A comparative study. Journal of Computer Information Systems, 62(1): 82-97. https://doi.org/10.1080/08874417.2020.1712269
[15] Torten, R., Reaiche, C., Boyle, S. (2018). The impact of security awareness on information technology professional’s behavior. Computers and Security, 79: 68-79. https://doi.org/10.1016/j.cose.2018.08.007
[16] Pattinson, M., Butavicius, M., Parsons, K., McCormac, A., Calic, D. (2017). Managing information security awareness at an Australian bank: A comparative study. Information and Computer Security, 25(2): 181-189. https://doi.org/10.1108/ICS-03-2017-0017
[17] Hwang, I., Wakefield, R., Kim, S., Kim, T. (2019). Security awareness: The first step in information security compliance behavior. Journal of Computer Information Systems, 61(4): 345-356. https://doi.org/10.1080/08874417.2019.1650676
[18] Asfoor, A., Rahim, F.A., Yussof, S. (2019). Factors influencing information security awareness of phishing attacks from bank customers' perspective: A preliminary investigation. In: Saeed, F., Gazem, N., Mohammed, F., Busalim, A. (eds) Recent Trends in Data Science and Soft Computing. IRICT 2018. Advances in Intelligent Systems and Computing, vol 843. Springer, Cham. https://doi.org/10.1007/978-3-319-99007-1_60
[19] Kruger, H.A., Kearney, W.D. (2006). A prototype for assessing information security awareness. Computers and Security, 25(4): 289-296. https://doi.org/10.1016/j.cose.2006.02.008
[20] Parsons, K., McCormac, A., Butavicius, M., Pattinson, M., Jerram, C. (2014). Determining employee awareness using the Human Aspects of Information Security Questionnaire (HAIS-Q). Computers and Security, 42: 165-176. https://doi.org/10.1016/j.cose.2013.12.003
[21] Torten, R., Reaiche, C., Boyle, S. (2018). The impact of security awareness on information technology professionals. Behavior. Computers and Security, 79: 68-79. https://doi.org/10.1016/j.cose.2018.08.007
[22] Candiwan, P., Zafira, N. (2020). An information security awareness investigation of E-commerce users: A case study of Traveloka. International Journal of Advanced Trends in Computer Science and Engineering, 9(2): 1422-1429. https://doi.org/10.30534/ijatcse/2020/79922020
[23] Adebiyi, R.T., Babalola, O., Amuda-yusuf, G., Rasheed, S.A., Olowa, T.O. (2020). Effect of knowledge and compliance of health and safety information on construction sites workers’ safety in Nigeria. International Journal of Safety and Security Engineering, 10(2): 269-277. https://doi.org/10.18280/ijsse.100215
[24] Munthe, I.R., Purnama, I. (2019). Uji Tingkat Kesadaran Keamanan Informasi Pengguna Smartphone. (Studi Kasus: AMIK Labuhan Batu).; Jurnal Tekinom, 2(2): 156-165. https://doi.org/10.37600/tekinkom.v2i2.113
[25] Afandi, I., Kusyanti, A., Wardani, N. (2017). Analisis Hubungan Kesadaran Keamanan, Privasi Informasi, Perilaku Keamanan Pada Para Pengguna Media Sosial Line. Jurnal Pengembangan Teknologi Informasi dan Ilmu Komputer, 1(9): 783-792.
[26] Mamade, B.K., Dabala, D.M. (2021). Exploring the correlation between cyber security awareness, protection measures and the state of victimhood: The case study of Ambo University's academic staffs. Journal of Cyber Security and Mobility, 10(4): 699-724. https://doi.org/10.13052/jcsm2245-1439.10445
[27] Petroye, O., Lyulyov, O., Lytvynchuk, I., Paida, Y., Pakhomov, V. (2020). Effects of information security and innovations on country’s image: Governance aspect. International Journal of Safety and Security Engineering, 10(4): 459-466. https://doi.org/10.18280/ijsse.100404
[28] Gaol, L., Jimmy, C. (2008). Sistem Informasi Manajemen Pemahaman dan Aplikasi. Grasindo. Jakarta. http://lib.ui.ac.id/detail?id=117612
[29] Asadi, P., Ahmadi, S., Abdi, A., Shareef, O.H., Mohamadyari, T., Miri, J. (2019). Relationship between self-care behaviors and quality of life in patients with heart failure. Heliyon, 5(9). https://doi.org/10.1016/j.heliyon.2019.e02493
[30] Azhari, S. (2017). Sistem Informasi Manajemen: Konsep dan Pengembangan Secara Terpadu. Lingga Jaya. Bandung.
[31] Whitman, M.E., Mattord, H.J. (2016). Management of Information Security. Boston: Cengage.
[32] Hamirul, H. (2016). Pengertian Perilaku. In Inovasi dalam pelayanan publik. Pena Persada. Purwokerto.
[33] Kottler, P., Keller, K.L. (2016). Marketing Management. 15th ed. Essex, England: Pearson Education Limited.
[34] Sitoyo, S., Sodik, A. (2015). Dasar Metodologi Penelitian. Karanganyar: Literasi Media Publishing.
[35] Trihendradi, T. (2012). Step by Step SPSS 20 Analisis Data Statistik. Penerbit Andi. Yogyakarta.
[36] Statistikian.com. (2020). One way anova dalam spss. https://www.statistikian.com/2012/11/one-way-Anovadalam- spss.html, accessed on May 15, 2021.
[37] Siagian, D., Sugiarto, B. (2006). Metode Statistika. Jakarta: PT Gramedia Pustaka Utama.
[38] Hidayat, T. Istiadah, N. (2011). Panduan lengkap menguasai SPSS 19 untuk mengolah data statistik penelitian. Mediakita. Jakarta.