Chairunnisa Noviarini | Ari Rahman | I Wayan Koko Suryawan* | Iva Yenis Septiariva | Sapta Suhardono
© 2022 IIETA. This article is published by IIETA and is licensed under the CC BY 4.0 license (http://creativecommons.org/licenses/by/4.0/).
OPEN ACCESS
During a pandemic, social distancing will affect the occupancy rate of public transportation in DKI Jakarta. The number of usually total passengers is partially occupied. Of course, this can change the carbon footprint generated for each person. For this reason, this research was conducted to determine the carbon footprint and greenhouse gas emissions released during the COVID-19 pandemic. A direct survey has been conducted to determine the occupancy rate of mass rapid transit (MRT) vehicles and Trans Jakarta buses. Online vehicles such as cars and motorbikes were based on government policy. The results show that the MRT occupancy rate was 63±32 passengers, and for Trans Jakarta, it was 21±9 passengers. The carbon footprint from transportation that produces the most negligible CO2 emissions was MRT. The comparison obtained between the MRT and Trans Jakarta Bus's emission values were 0.026 and 0.091 kg CO2 eq/passenger. As for the online taxi transportation mode with four people, it produced the highest CO2 emissions. Therefore, the government needs have planned MRT to improve the quality of public transportation and capacity, especially in the main corridors of DKI Jakarta.
MRT, bus, CO2, global warming, COVID-19
The Special Capital Region of Jakarta (DKI Jakarta) is the capital city of Indonesia. As the country's capital city, DKI Jakarta is a dense megapolitan city because it has a high population growth rate and a high mobility flow, both from people outside the surrounding area and the DKI Jakarta area itself [1, 2]. DKI Jakarta, a business and government center with a population of 10.46 million people and is surrounded by the growing settlements of Bogor, Depok, Tangerang, and Bekasi, requires adequate transportation to support economic activity [3]. The administrative area of DKI Jakarta Province is divided into five administrative cities and 1 (one) administrative district, namely South Jakarta with a land area of 141.27 km2, East Jakarta with a land area of 188.03 km2, Central Jakarta with a land area of 48.13 km2, West Jakarta with a land area of 129.54 km2 and North Jakarta with a land area of 146.66 km2, and the Thousand Islands Administrative District with a land area of 8.70 km2. Transportation activities, especially motorized vehicles, are a significant source of air pollution in urban areas [4-7]. In addition, population growth leads to increased demand for transportation. In the emission inventory activities carried out in DKI Jakarta, Bogor, Depok, Tangerang, and Bekasi in 2013, the transportation sector became the largest emitter of CO2 [8]. The emission inventory is the data collection or recording of air pollutants from various sources located in an area [9]. Emission inventory activities are needed as one of the first steps in dealing with air quality problems [10, 11].
In addition, population growth leads to increased demand for transportation. In the emission inventory activities carried out in DKI Jakarta, Bogor, Depok, Tangerang, and Bekasi in 2013, the transportation sector became one of the contributors to CO2 emissions and other activities [8]. During the massive social distancing of COVID-19 in Jakarta, it was generally agreed that travel should be minimized. Only travel distances were significant or unavoidable. The issue of new maximum occupancy standards due to the physical requirements of the new public transport is a multifaceted challenge used for face mask use, sanitation, and ventilation, among other factors [12]. Several studies have stated that the level of risk from using public transportation correlates with the spread of the COVID-19 virus [13, 14]. The existence of this pandemic causes the need for new habit adaptations. Changes in new habits will cause a difference in the occupancy of public transportation. Therefore, it will indirectly affect the number of emissions issued by the capita.
Based on the Detailed Urban Spatial Plan for the South Jakarta Administration, Senayan will become the Central Business District (CBD). The CBD area causes many activities to arise [15]. The Senayan SCBD area is one of the areas designated as the Transit-Oriented Development (TOD) Area [16], which is a transit-oriented development that is an integrated spatial and transportation management concept [17]. Based on the 2017-2022 PT MRT Jakarta RPJMD, the SCBD Senayan area in Jakarta's golden triangle is synonymous with upscale commercial districts. It is one of the largest business centers in Jakarta. There are various transportation modes, such as Transjakarta, MRT Jakarta, and online motorcycle taxis. Based on the Energy Sector GHG Emission Inventory Data published by the Ministry of Energy and Mineral Resources, the transportation sector dominates the contribution of GHG emissions in Indonesia, especially in South Jakarta.
The implementation of scale social distancing will affect the occupancy of public transportation in Jakarta. For this reason, this study was conducted to determine the current carbon footprint and greenhouse impacts of public transportation in Jakarta. This research is the basis for selecting public transportation for environmentally friendly criteria.
2.1 Research survey
The research process begins with the identification and formulation of the problem. At this initial stage, the determination of the research location and sampling design was carried out. In addition, literature studies were carried out to support this study. In the early stages, literature studies were used to determine the appropriate method for calculating the amount of CO2 emissions produced by MRT Jakarta, Bus Transjakarta, online motorcycle taxis, and online taxis. All survey segments were located in the area of Jalan Jenderal Sudirman, Senayan. The selection was based on the fact that the Senayan area is a TOD area where the TOD area is an area with the concept of integrated spatial management and transportation [17]. Furthermore, it is proven by various transportation modes such as Trans Jakarta and city buses with multiple routes, and the Jakarta MRT.
The average number of occupancy surveys in a segment refers to the Guidelines for Data Collection on Urban Public Transport published by the Ministry of Transportation Directorate General of Land Transportation [18]. The survey method used was a dynamic survey. This survey was carried out by recording the number of passengers in a vehicle in a particular segment. The number of passengers was recorded on weekdays, at least six trips in the morning busy time, six trips during the off-peak time, and six trips in the afternoon busy time.
In this study, the dynamic survey was carried out three days a week, namely on Monday to describe a busy weekday's condition, Thursday to describe the requirement of a reasonably quiet weekday, and Saturday to describe the weekend conditions. As for the selection of time, for rush hour, it was taken from the slice of the provisions f at 07.00 - 09.00 WIB, and the afternoon rush hour at 17.00 - 19.00 WIB, while for off-peak hours taken at 14.00 - 16.00 WIB.
2.2 Calculation of the amount of CO2 emissions
The emission factor method calculates CO2 emission calculations for MRT Jakarta, Transjakarta, and online transportation. Where this emission factor method considers activity data and vehicle emission factors [19] with a general Eq. (1):
GHG Emission = Activity Data × Emission Factor (1)
The emission factor (EF) is the number of emissions per unit of activity shown in a coefficient [19]. Meanwhile, activity data shows the relationship between GHG emissions and the number of human activities [19]. In this study, the activity data used for calculating the amount of CO2 emissions on MRT Jakarta, Transjakarta, and online taxis are the amount of each fuel consumed and the value of the emission factor.
$\mathrm{E}_{\mathrm{CO}_{2}}=\frac{\text { Electricity consumtion } \mathrm{x} \text { segment leght } \mathrm{x} \mathrm{EF} \mathrm{CO}_{2}}{\text { The number of MRT Jakarta occupancy }}$ (2)
The value of MRT electricity consumption was obtained from PT MRT Jakarta's Monthly Electricity Consumption data, which is 2.46 KWh/vehicle.km (Logsheet Energy Consumption MRTJ, 2020). The CO2 emission factor for electricity obtained from the Ministry of Energy and Mineral Resources (ESDM) of the Directorate General of Electricity in 2018, namely the Java-Madura-Bali (Jamali) Interconnection of 0.79 tCO2/MWh [20]. Meanwhile, the number of passengers was obtained from the survey method. The results obtained will show the CO2 emissions produced by 1 MRT Jakarta train passenger in units of KgCO2/person.
In calculating the emissions of Trans Jakarta Buses and online taxis (both motorbikes and cars), the CO2 emission factors based on diesel and premium fuels are 2.2 and 2.6 kg-CO2/L [21]. The daily fuel consumption by large buses, cars, and motorbikes obtained by the Ministry of National Development Planning in 2013 was 0.05, 0.13, and 0.33 L/km, respectively [21]. The number of passengers will be obtained from a dynamic survey method. The results obtained will show the CO2 emissions produced by one occupancy in units of kgCO2/person as in Eq. (3).
$\mathrm{E}_{\mathrm{CO}_{2}}=\frac{\text { Fuel consumtion } \mathrm{x} \text { segment leght } \mathrm{x} \mathrm{FE}_{\mathrm{CO}_{2}}}{\text { Occupancy }}$ (3)
3.1 Occupancy identification
The research was in Jalan Jenderal Sudirman, Senayan, South Jakarta (Figure 1). The MRT Jakarta transportation mode calculation was carried out at Senayan Station to Istora Mandiri Station with 0.841 km. Meanwhile, the calculation of Transjakarta transportation modes was carried out at the Senayan Roundabout Stop to the Polda Metro Jaya Bus Stop with a segment of 1.27 km long. The calculation of online motorcycle taxi transportation modes starts from the Senayan 2 Roundabout Stop to GBK Pintu VII with a segment length of 1.09 km (Table 1).
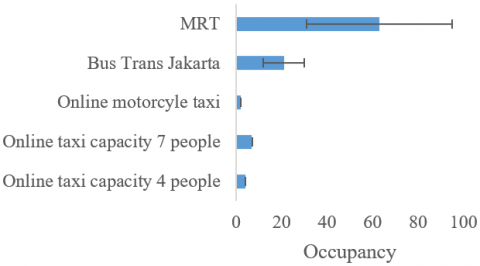
Based on the survey results, the average occupancy for MRT Jakarta is 63±32 passengers, while for Trans Jakarta Buses, it is 21±9 passengers. Meanwhile, online vehicles use the DKI Jakarta Provincial Transportation Agency's regulatory scheme. As for the details of the passenger configuration, two-line taxis are only allowed to carry two passengers with a composition of 1 driver and two passengers behind. As for three-row cars, a maximum of three passengers, with a composition of one driver in front, one passenger in the middle, and one passenger in the back row. In detail, the occupancy of public transportation in this study can be seen in Figure 2.
Figure 1. Research area in determining carbon footprint and greenhouse emissions from public transportation [22]
Table 1. Data collection of segment length
|
Transportation Mode |
Segment |
Length (km) |
|
Mrt Jakarta |
Stasiun Senayan – Stasiun Istora Mandiri |
0.841 |
|
Bus Transjakarta |
Halte Bundaran Senayan – Halte Polda Metro |
1.272 |
|
Online Motorcycle Taxis |
Halte Bundaran Senayan II – Halte Gbk Gate 7 |
1.097 |
|
Online Taxis |
Halte Bundaran Senayan II – Halte Gbk Gate 7 |
1.097 |
Figure 2. Public transportation occupancy in Jakarta
Hadiwardoyo, 2013 describes minibusses, city buses, and trains with occupancy rates of 8, 40, and 1500 passengers, respectively [23]. This shows a decrease in the occupancy rate for each vehicle during the COVID-19 pandemic. However, compared with the occupancy rate in Semarang City, this condition indicates that the value was still in the normal range. In Purwanto and Ismiyati's research [24], in Semarang, the occupancy value of buses is 13 - 45.
Fuel consumption between road-based and rail-based modes of transportation, assuming vehicle occupancy rates (average number of passengers per vehicle). Average fuel consumption per vehicle per kilometer traveled, fuel consumption for passenger cars is 0.037 liter /passenger/km, the highest fuel consumption [23]. This was followed by motorbikes (0.027 liters/passenger/km), angkot/minibus (0.014 liters/passenger/km); and city buses (0.013 liters/ passenger/km) [23]. The lowest fuel consumption was trains transportation (0.002 liters/passenger/km traveled. Thus, fuel consumption for private cars (per passenger per kilometer) is about 17 times higher than fuel consumption [23].
3.2 Carbon footprint based emission
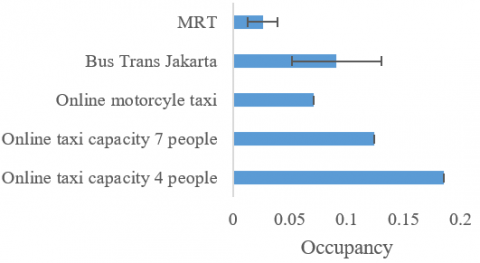
CO2 emissions for the public transportation mode were calculated following equations 1 and 2. Comparison results for each public transportation can be seen in Figure 3. The method of transportation that produced the most negligible CO2 emissions was MRT. As for the online taxi transportation mode with four people, it produced the highest CO2 emissions. The most exciting thing was that the emissions produced by Trans Jakarta buses could exceed those of online taxi taxis. It was because the pandemic occupancy conditions of Trans Jakarta buses were low. Therefore, if the requirements exceed the average use of Trans Jakarta Buses, it can exceed the use of online taxis with a capacity of 7 people.
Figure 3. Carbon footprint public transportation in Jakarta
Efforts to reduce CO2 emissions were required in each mode of transportation. Efforts to reduce CO2 were one way to support Sustainable Development Goals (SDGs) number 13: Addressing Climate Change. MRT Jakarta's effort is to operate MRT Jakarta Phase II immediately. According to Khwan's [25] research, operating the Malaysia MRT with two lines (lines) will reduce 242,200 tCO2-eq/year based on changes in motorized vehicle activity. One of the efforts to reduce CO2 in the Bus Trans Jakarta mode of transportation can be made by adding/extending the duration of the break between buses (headway) during off-peak hours on workdays (weekdays). According to observations during the survey during off-peak hours on workdays (14.00 - 16.00 WIB), Bus Trans Jakarta passengers were far less than the peak hours on workdays. Therefore, adding/extending the headway will reduce the number of buses operating to reduce emissions.
Another effort that can be made to reduce CO2 gas was by vehicles using fuel that has a high-octane number in motorized vehicles, like using Pertalite type fuel with an octane number of 90 and Pertamax with an octane number of 92. The higher the octane value in motorized vehicle fuel, the more perfect and efficient the combustion process [26]. Therefore, the lower the CO2 emissions released.
The concept of road-based public transportation development is planned to serve DKI Jakarta with the priority of BRT buses with support from the LRT and MRT. The following aspects are a system that should be developed to support BRT operations:
1. Development of a public bus system
2. Development of a mass transit system
3. Development of alternative transportation policies
4. Development of supporting the Public Bus System Development policy
The public bus system should be improved through bus route management and rationalization. The strategy includes route restructuring, especially for routes that impact busway operations, and developing feeder buses to support busway operations. For bus rationalization, direct the government to control the number of buses operating in their area. The DKI government plans to periodically develop a mass transit system from 2004 to 2020 [27, 28]. Development includes:
1. Priority Bus Network
2. Light Rapid Transit (LRT)
3. Mass Rapid Transit (MRT)
The priority bus network is in the form of a busway. The government also plans to develop two LRT monorail lines, namely the LRT Blue Line and Green Line. The LRT function is primarily directed at supporting busway operations in DKI Jakarta. In addition, the government planned mass Rapid Transit (MRT) to improve the quality of public transportation and capacity, especially in the main corridors of DKI Jakarta [23]. The advantages of this system are its ability to transport large numbers of passengers quickly and reliably in various situations. The Jakarta monorail train is a mass transit system with a single rail train (monorail) with an elevated line, which is currently under construction in Jakarta.
According to the emission factor method calculations, the MRT Jakarta mode of transportation emits as much as 0.026 kg CO2 eq/passenger, Bus Trans Jakarta of 0.091 kg CO2 eq/passenger, motorcycle taxis online of 0.14 kg CO2 eq/passenger, online taxi capacity four people of 0.185 kg CO2 eq/passenger, online taxi capacity seven people of 0.124 kg CO2 eq/passenger. The result showed that MRT Jakarta has the lowest CO2 emission than other transportation modes. This difference depends on what fuel was used for transportation. For example, the MRT uses electricity, so the emissions generated are also from the electricity used. Trans Jakarta buses and online taxis produce CO2 gas emissions from diesel-based and premium fuels.
Researchers are very grateful to PT. MRT Jakarta and Trans Jakarta Bus Management for the implementation of this research. In addition, this research is also supported by the final project with contract number 0001A/UP-DKN3/SK/I/2020.
[1] Rustiadi, E., Pravitasari, A.E., Setiawan, Y., Mulya, S.P., Pribadi, D.O., Tsutsumida, N. (2021). Impact of continuous Jakarta megacity urban expansion on the formation of the Jakarta-Bandung conurbation over the rice farm regions. Cities, 111: 103000. https://doi.org/10.1016/j.cities.2020.103000
[2] Lathifah, L.N., Hasibuan, H.S., Sodri, A. (2021). Private green open space arrangement through Indonesian building permits. In IOP Conference Series: Earth and Environmental Science, 940(1): 012064. https://doi.org/10.1088/1755-1315/940/1/012064
[3] Putri, R.F., Abadi, A.W., Kafafa, U. (2020). The correlation analysis between urbanization phenomena and landuse change in Jakarta Special Province. In E3S Web of Conferences (Vol. 200, p. 05003). EDP Sciences. https://doi.org/10.1051/e3sconf/202020005003
[4] Scheidel, A., Del Bene, D., Liu, J., et al. (2020). Environmental conflicts and defenders: A global overview. Global Environmental Change, 63: 102104. https://doi.org/10.1016/j.gloenvcha.2020.102104
[5] Glazener, A., Khreis, H. (2019). Transforming our cities: best practices towards clean air and active transportation. Current Environmental Health Reports, 6(1): 22-37. https://doi.org/10.1007/s40572-019-0228-1
[6] Guttikunda, S.K., Nishadh, K.A., Jawahar, P. (2019). Air pollution knowledge assessments (APnA) for 20 Indian cities. Urban Climate, 27: 124-141. https://doi.org/10.1016/j.uclim.2018.11.005
[7] Pietrzak, K., Pietrzak, O. (2020). Environmental effects of electromobility in a sustainable urban public transport. Sustainability, 12(3): 1052-1052. https://doi.org/10.3390/su12031052
[8] Suatmadi, A.Y., Creutzig, F., Otto, I.M. (2019). On-demand motorcycle taxis improve mobility, not sustainability. Case Studies on Transport Policy, 7(2): 218-229. https://doi.org/10.1016/j.cstp.2019.04.005
[9] Liu, S., Hua, S., Wang, K., et al. (2018). Spatial-temporal variation characteristics of air pollution in Henan of China: Localized emission inventory, WRF/Chem simulations and potential source contribution analysis. Science of the Total Environment, 624: 396-406. https://doi.org/10.1016/j.scitotenv.2017.12.102
[10] Pinto, J.A., Kumar, P., Alonso, M.F., et al. (2020). Traffic data in air quality modeling: A review of key variables, improvements in results, open problems and challenges in current research. Atmospheric Pollution Research, 11(3): 454-468. https://doi.org/10.1016/j.apr.2019.11.018
[11] Gulia, S., Nagendra, S.S., Barnes, J., Khare, M. (2018). Urban local air quality management framework for non-attainment areas in Indian cities. Science of the Total Environment, 619: 1308-1318. https://doi.org/10.1016/j.scitotenv.2017.11.123
[12] Tirachini, A., Cats, O. (2020). COVID-19 and public transportation: Current assessment, prospects, and research needs. Journal of Public Transportation, 22(1): 1-20. https://doi.org/10.5038/2375-0901.22.1.1
[13] Zheng, R., Xu, Y., Wang, W., Ning, G., Bi, Y. (2020). Spatial transmission of COVID-19 via public and private transportation in China. Travel Medicine and Infectious Disease, 34: 101626. https://doi.org/10.1016/j.tmaid.2020.101626.
[14] Du, Z., Wang, L., Cauchemez, S., Xu, X., Wang, X., Cowling, B.J., Meyers, L.A. (2020). Risk for transportation of coronavirus disease from Wuhan to other cities in China. Emerging Infectious Diseases, 26(5): 1049-1052. https://doi.org/10.3201/eid2605.200146.
[15] Jahja, S.G.A., Sulistyarso, H. (2020). Strategi Pengembangan Kebijakan Penurunan Emisi Kendaraan di Kawasan Senayan, Jakarta. Jurnal Teknik ITS, 8(2): E114-E120. https://doi.org/10.12962/j23373539.v8i2.47911
[16] Putri, A.F.D.R., Tjung, L.J., Priyendiswara, P.A. (2019). Studi implementasi persebaran stasiun bikeshare pada lokasi eksisting di kawasan scbd senayan, Jakarta. Jurnal Sains, Teknologi, Urban, Perancangan, Arsitektur (Stupa), 1(2): 2287-2300. https://doi.org/10.24912/stupa.v1i2.4602
[17] Priadmaja, A.P., Anisa, A. (2018). Penerapan konsep transit oriented development (TOD) pada penataan kawasan di Kota Tangerang. PURWARUPA Jurnal Arsitektur, 1(2): 53-60.
[18] Darat, D.P. (2002). Pedoman teknis penyelenggaraan angkutan penumpang umum di wilayah perkotaan dalam trayek tetap dan teratur. Surat Keputusan Direktur Jenderal Perhubungan Darat SK.
[19] Ministry of Environment of the Republic of Indonesia, Minister of Environment Regulation No. (2012). Guidelines for Calculation of Emission Burden of Oil and Gas Industry Activities. Jakarta. DKI Jakarta: Indonesian Ministry of Environment. http://menlhk.co.id/simppuh/public/uploads/files/MLH%20P.12%20(3).pdf.
[20] Tim Komunikasi, E.S.D.M. (2018). Kementerian energi dan sumber daya mineral republik indonesia. Retrieved March.
[21] Ministry of National Development Planning Indonesia, Monitoring, Evaluation and Reporting Technical Guidelines (PEP) Implementation of RAD-GRK. 2013. http://ditjenppi.menlhk.go.id/reddplus/images/resources/ws_transperancy_framework/r0_02_bappenas.pdf.
[22] Google Map. (2021). Google Map. https://www.google.com/maps/place.
[23] Indonesian Ministry of Finance, Economic Issues in the Development of Commuter Train Services in the Greater Jakarta Area. DKI Jakarta: Ministry of Finance of Indonesia, 2014. https://www.kemenkeu.go.id/sites/default/files/commuter%20rail%20study%20-%20indonesian_0.pdf.
[24] Purwanto, D., Ismiyati, I. (2015). Pengelolaan Transportasi Berwawasan Lingkungan Sebagai Dampak Perkembangan Perkotaan Tak Terkendali (Studi Kasus Kota Semarang). Media Komunikasi Teknik Sipil, 20(1): 93-101. https://doi.org/10.14710/mkts.v20i1.9250
[25] Kwan, S.C., Tainio, M., Woodcock, J., Sutan, R., Hashim, J.H. (2017). The carbon savings and health co-benefits from the introduction of mass rapid transit system in Greater Kuala Lumpur, Malaysia. Journal of Transport & Health, 6: 187-200. https://doi.org/10.1016/j.jth.2017.06.006
[26] Prayogi, Y., Sinaga, N. (2019). Performance and exhaust gas emission of gasoline engine fueled by gasoline, acetone and wet methanol blends. In IOP Conference Series: Materials Science and Engineering, 535(1): 012013. https://doi.org/10.1088/1757-899x/535/1/012013
[27] Nakamura, K., Hayashi, Y. (2013). Strategies and instruments for low-carbon urban transport: An international review on trends and effects. Transport Policy, 29: 264-274. https://doi.org/10.1016/j.tranpol.2012.07.003
[28] Steinberg, F. (2007). Jakarta: Environmental problems and sustainability. Habitat International, 31(3-4): 354-365. https://doi.org/10.1016/j.habitatint.2007.06.002