Yanuar Wijayanto* | Akhmad Fauzi | Ernan Rustiadi | Syartinilia
© 2022 IIETA. This article is published by IIETA and is licensed under the CC BY 4.0 license (http://creativecommons.org/licenses/by/4.0/).
OPEN ACCESS
The number of passengers on the Indonesian urban rail network (KRL Jabodetabek) continues to increase from year to year, causing problems like passenger overcapacity at stations and on trains. The safety and security of KRL needs to be improved by managing the demand for KRL passengers. This paper aims to predict the number of passengers, trains, and employees, as well as the total income and amount of subsidies required to support rational policymaking for future railway management. The prediction was carried out based on system dynamics modeling, a framework demonstration technique integrating system science with computer simulation. Our system dynamics model was built, and validated on time series data from 2014 to 2020. The results show that, the number of passengers, trains, and employees increased annually from 2014 to 2019, but decreased in 2020, for the human movement is restricted by COVID-19. According to the simulation results, the daily number of electric rail train passengers was projected to reach 1,387,295 in 2035, and 1,365 extra trains would be required to cater to the passengers. The safety and security of trains, which are strongly correlated with the management of urban electric rail passenger demand, would be jeopardized, if the number of passenger requests is out of control. The research provides unique empirical and theoretical materials for academics, and sheds new light on the importance of safety and security enhancement to urban rail network.
Indonesian railway network, system dynamics modeling, urban railway demand prediction
Sixteen out of the 28 most important cities globally are located in Asia. Among them is Jakarta, home to over 10 million citizens, and the destination of 2.5 million from surrounding regions each week. The city’s metro system serves the metropolitan area of Jabodetabek, short for the initials of Jakarta, Bogor, Depok, Tangerang, and Bekasi. Currently, the system radiates a staggering population of 29 million. This figure has been projected to surpass 50 million within the next three decades, making Jabodetabek the world’s second-largest conurbation, only behind the even more prominent Greater Tokyo Area [1].
In Jabodetabek, 11% of the population aged 5 and above are commuters. Furthermore, the majority of the 3.2 million Jabodetabek commuters travel for work activities (80.6%), followed by school activities (19.2%), and course activities (0.2%). 67% of these commuters are males. The main mode of transportation is motorbikes totaling 2,062,546 (63.3%), followed by private cars totaling 288,110 (8.8%), trans-Jakarta buses totaling 110,055 (3.4%), and bicycles as well as online motorcycle taxis totaling 122,860 (3.8%). Meanwhile, the ridership of the electric rail trains on the new commuter line (KRL) is 298,834 (9.1%). In addition, 18% of the commuters use more than one mode of transportation [2, 3].
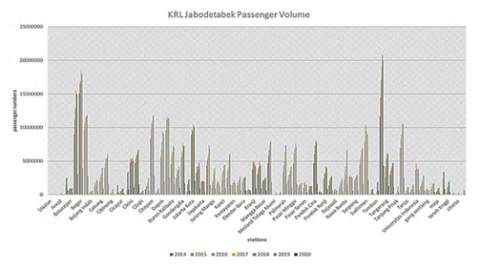
From 2014 to 2019, the number of passengers on the electric rail trains of Jabodetabek commuter line (KRL Jabodetabek) increased from 206,818,513 to 336,274,343 [4]. These passengers now face several challenges, namely, overcapacity on trains, lack of comfort and convenience, and thronged platforms. To optimize the operation of the metro system, there is a need to find the best number of passengers, trains, and employees required in the future, and the most suitable amount of future subsidies, incomes, and expenditures.
Therefore, this paper aims to build and validate a system dynamics model for predicting the formulation of urban rail demand management, and enhance railway safety in the Jabodetabek metropolitan area.
Urban railways have been studied worldwide by scholars in various disciplines, using a dazingly array of approaches. However, only a few have adopted system dynamics modeling. Huang et al. carried out railway research using system dynamics to examine the shift from road freight to rail transport within a reasonable framework, which is driven by taxes on CO2 emissions. But their study is limited to road to rail migration surveys [5]. Lei et al. discovered that the rapid growth of private cars in the urban transportation system of Shanghai, China is essential to CO2 emissions [6]. Yang and Miao [7] described the evolution of the number of passengers of buses, trucks, cars, and taxis from 2004 to 2009, without providing any predictions for the future. Yang et al. explained that the construction of urban rail transit could not reduce the number of cars. The number of cars will increase with the traffic on the urban rail transit. Nonetheless, Chao and Zishan ignored other implications of urban rail transport, such as the recovery of investment and metro business [8]. Wang and Zhang [9] reported that raising fares, investing more in fixed rail assets, and slowing economic growth reduce the supply gap of rail express freight. Yet the elements and scenarios of China’s rail freight system were not combined to explain the reduction mechanism clearly and thoroughly. Zhi [10] predicted the number of passengers on Beijing Subway trains, without considering the variables of the number of commuters, trains, and employees, or the amount of income, expenses, and subsidies. Hu et al. held that the funding and capacity growth of urban rail passenger transport systems significantly alleviate congestion, air pollution, and accident losses. However, they failed to take account of externalities like impact of multimodal transportation on the system, mitigation of truck damage to roads, and the benefits of land conservation [11]. Xue et al. projected that the construction of the transit metropolis would positively impact Nanchang, the seat of southeastern China’s Jiangxi Province. But their system dynamics model merely cover some of the critical indicators of the structure of the transit metropolis, which should be further improved [12].
Overall, these previous studies failed to highlight the relationship between the number of passengers, the number of commuters, the number of trains, the number of employees, the amount of income and expenses, and the number of subsidies. To fill up the gap, this paper aims to predict the number of passengers, trains, and employees, as well as the total income and amount of subsidies required to support rational policymaking for future management of Jabodetabek KRL. The main contribution of this study is to provide railway policymakers with a clear picture of the entire transportation system, and aid Indonesian electric rail train operators (PT KCI) to improve railway safety and security in the future. The research provides unique empirical and theoretical materials for academics, and sheds new light on the importance of safety and security enhancement to urban rail network.
The remainder of this paper is organized as follows: Section 2 outlines the previous railway research, which involves system dynamics; Section 3 presents a system dynamics model, and illustrates its implementation steps; Section 4 establishes the causal loop diagram (CLD), a sub-model of the transportation service of KRL Jabodetabek, and a sub-model of the socioeconomics of KRL Jabodetabek, before analyzing the scenarios and sensitivity of KRL; Section 5 summarizes the research findings and contributions.
The relatively low CO2 emissions of railways allow freight owners to switch from road to rail, which increases the demand for road-to-rail freight, while reducing freight transport and carbon emissions. The release of carbon stimulates the growth of road-to-rail transportation demand, and motivates companies to change transportation methods in consideration of costs [5].
Low-carbon urban transportation calls for proper management of the transportation demand in cities and the number of private cars. Urban CO2 emissions are closely related to the geographical location, industrial structure, and layout of the city [6]. The transport structure that references the modal split can reflect the features of the transport demand, and the functional role of various transportation modes, exerting a direct impact on the composition of limited transportation resources and the efficiency of the urban transportation system. The supply and demand for transportation become unbalanced during urbanization and motorization [7].
Furthermore, Yang et al. found that urban rail transport would significantly reduce traffic congestion and air pollution [8], yet insignificantly affect economic growth. However, the expansion of urban rail transport would kick off a round of fast increase in land prices from 2015 to 2025. It is worth noting that the expansion does not reduce the number of vehicles. Cars would continue to grow, despite the increase of urban rail mileage. Through simulations, Wang and Zhang [9] discovered that the supply-demand gap in high-speed rail transportation could be adequately addressed by raising transportation prices, increasing investment in rail equipment, and slowing economic growth.
In addition, Zhi [10] identified many influencing factors of rail passenger traffic. The most important factor is the supply and demand of transportation. In the dimension of demand, the primary factor is population. In the dimension of supply, the leading factor is investment in rail passenger transport, which affects the capacity of the rail network and the price of rail transport. Hu et al. [11] reported that, with some political support, Beijing Light Rail can attract significant investments and achieve profits during the construction period, and would bring much higher values in the long run. More income and external profit are expected if the network scaling reaches a high level, and the sales is better managed.
All in all, no known studies have applied system dynamics modeling to the Greater Jakarta Area, the world’s second-largest conurbation. To fill up the gap, this paper executes the relevant parameters carefully, and provides new insights into the structure and behavior of the railway framework.
3.1 Collection of data
Drawing on the literature, and written information, Amissah et al. [13] and Forrester [14-16] built mental models through interviews on experts, determined the constituents of the system dynamics model, and compared the model’s behavior with the real-world behavior, using time-series data and other data. After reviewing the earlier studies [5-12], this paper establishes the structure of the Jabodetabek KRL system, and summarizes the written information in the reports from the Indonesian Commuter Railway Company [17-23], as well as the written information from Law No. 23 of 2007 on railways and other regulations. Then, various transportation experts were interviewed to validate whether the framework of the Jabodetabek KRL is legitimate enough to serve the research goal. The interview was carried out following the COVID-19 protocol. The proposed model was simulated with the time series data obtained from the Central Statistics Agency [2, 3], the Indonesian Commuter Railway Company [4, 17-23], and the Ministry of Transportation of the Republic of Indonesia [21]. It is no easy task to acquire time series data amidst the COVID-19 pandemic, for most employees work from home.
3.2 Location
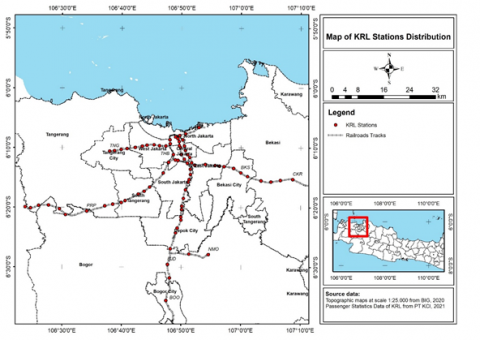
This study was conducted in the Jabodetabek Commuterline electric rail train network, from April 2021 to August 2021 (5 months). Figure 1 shows a map of the study location.
3.3 Data analysis
3.3.1 System dynamics
Data analysis was performed using the Powersim Studio 10, with the system dynamics method. This academic software is officially licensed by the Powersim Software AS company to the natural resources and environmental study program (PSL) IPB University, Bogor Indonesia (license number: PSSTUDIO-103364-HY3RC). Based on framework science and computer recreation procedures, the system dynamics method was created by Jay W. Forrester as a technique of framework demonstration. Since simulation models can provide complex real-world solutions, the system dynamics method is often used to analyze complex issues systematically in problem-solving [14]. The framework flow is premised on framework consideration, a way of thinking and solving apparent world problems based on the primary idea of the frame. In this research, the framework flow refers to the deliberate collection of factors, which links up fragments, and shapes the framework results (purposefulness and inadvertent). It also determines how the framework fits in with the broader environment [13].
The system dynamics methods aims to disclose how a framework produces an energetic design of behavior and the use, focusing the inner capacity of the framework to alter the disturbing slant into an alluring counterpart [15]. Furthermore, a CLD and a stock-flow diagram (SFD) are required to understand system design and behavior, which will aid the formation of a formal quantitative dynamic model. The CLD can be created by connecting the significant causal variables in the system to effect variables. If two variables influence each other, the double arrow would apply [16]. The behavior of the elements in a framework depends on the uniqueness of the demonstration structure, which is decided by the system recreation. In addition, the simulation enables the acquisition of the behavior of a symptom within the system, making it possible to forecast the behavior of the symptom or process in the future. The validation cost of a system is minimized by using the mental model of the modeler. However, a validation test is a must to ensure the scientific level of the dynamics system. There are multiple common techniques for model validation [22]. Whichever the technique being adopted, the following instructions must be followed in a simple validation test:
(1) The CLD must deal with the problem.
(2) The equations, especially the sign plus or minus, must be consistent with those in the CLD.
(3) The model dimensions must be valid.
(4) The model should not product unreasonable values, e.g., negative stock.
(5) The model must behave reasonably, i.e., all occurrences must follow the expectations.
(6) The mass of the model must be balanced, that is, the total input and output quantities must be explainable.
(7) The system dynamics and model should be depicted by three types of variables, namely, stock, flow, and constants.
Figure 1. Locations in the Jabodetabek Electric Railway Network Source: Created by the authors based on Indonesian commuter train company [4]
Knowing the basic theory of dynamic equations makes it easier to understand the nature of long-term equilibrium, which is one of the outputs of the dynamic model. For a single variable, the dynamics of a single variable can be described by an ordinary differential equation (ODE):
$\frac{d x}{d t}=x=f(x, t)$ (1)
where, x is the stock; dx/dt is the flow.
The ODE is generally in the linear form:
$x+a x(t)=b$ (2)
where: a and b are constants.
Formula (2) is a dynamic equation for stock x, aiming to find the value of x for any time (t).
Mathematically, the system dynamics model is equivalent to dynamic equations, and is a dynamical system (DS) implemented in a broader environment. In terms of operation, a system dynamics model works within the framework of a DS, which contains a differential equation or a system of ODEs (SODE) [23].
The time series and regression analysis can make effective predictions on a huge amount of basic data, yet fail to reveal the internal relationships between system structures, or to mirror the impact of the numerous drivers and constraints on KRL Jabodetabek, a complex, dynamic system with many variables, feedback linkages, and fuzzy boundaries. By contrast, system dynamics modeling, a branch of systems theory, can connect natural and social sciences with the dynamic behavior of the complex feedback systems in KRL Jabodetabek. Therefore, this approach has been employed to address highly complex time-varying issues, which involve high-order and interactive variables [9].
This paper uses system dynamics to model and simulate the number of passengers, trains, and employees, as well as the income, cost, and subsidies for KRL Jabodetabek. The exponential model related to passenger growth was subjected to simple regression, multiple regression, and nonlinear regression analysis. Specifically, the amount of train subsidies per passenger was fixed, but the number of passengers was not; the annual amount of subsidies was inevitably affected by the stock or level; the ticket price per kilometer was taken as a variable or auxiliary influencing factor of passengers. In addition, the number of trips was designed as a variable depending on the countless trips on electric trains in Jabodetabek.
Additionally, the KRL Jabodetabek model was proved valid, and the parameter value was estimated through single equation regression, using the aggregated data corresponding to model variables [22]. The other tools of formal parameter estimation were studied by the system dynamics modeler to understand their functions, limitations, and applicable ranges. The general prediction method of ordinary least squares (OLS) is basically unsuitable for system dynamics modeling. Fortunately, some robust methods are available, ranging from the simple generalized least squares (GLS) to the complex Kalman filter. Therefore, the authors tried to select the most suitable method based on the model’s feedback structure, after fully considering the weakness and strengths of each technique [16].
3.3.2 Model validation
The absolute variation error (AVE) must be compared with the absolute mean error (AME) to approve the behavior of the system dynamics model. The AVE refers to the deviation of the reaction from the real system. The AME refers to the approximate error between the standard and the recreation result, with the acceptable error range of <10% [22]. The relevant parameters can be defined as:
$A M E=\left[\frac{\mathrm{Si}-\mathbf{A i}}{\mathbf{A i}}\right]$ (3)
Si = Si N, where S = recreation value
Ai = Ai N, where A = genuine value
N = number of perception periods
$A V E=\left[\frac{\mathrm{Ss}-\mathrm{Sa}}{\mathrm{Sa}}\right]$ (4)
Ss = ((Si - Si) ²N = deviation of the recreation value
Sa = ((Ai - Ai) ²N = deviation of the ground truth value
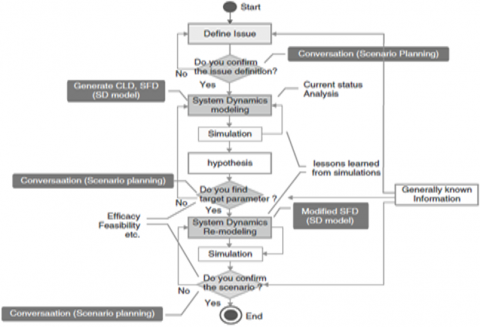
Figure 2 shows the flow of system dynamics modeling. The first step is to identify the issue, including arranging the scenarios through partner discussion. Subsequently, CLDs and SFDs were prepared, and the system was recreated to produce the energetic behavior. This is followed by formulating a theory and distinguishing the target parameters by talking to the partners. Finally, the arranged scenarios were created by recreating the discourse with the partners (Figure 2).
Figure 2. Flow of system dynamics modeling [22]
3.3.3 System boundary and the boundary adequacy
Our system dynamics model intends to predict the number of passengers, trains, and employees, as well as the total income, and amount of subsidies, providing data support to the policy support of KRL Jabodetabek management in the future, and to put the system behavior under control. To this end, all the key and relevant variables of the system were taken into account, and the strategy analysis and the design objectives were included in the system boundary [22].
The endogenous variables of the system were defined as: the number of passengers, trains, and employees, as well as total income, expenses, costs, and subsidies. These relevant variables are responsible for initiating problems with the feedback structure of the entire KRL Jabodetabek system. The exogenous variables of the system, namely, the Jakarta Mass Rapid Transit (MRT), private car riders, and the Jabodetabek population, were excluded from the study, because they are irrelevant to the research purpose.
On this basis, the authors set up a prediction model for the management behavior of Jabodetabek KRL. The range of the system dynamics analysis was limited to focus on the most crucial issues, such as the objectives, time, and the availability of resources.
Next, a boundary adequacy test was performed to examine the structural relationships required to achieve the modeling objectives of KRL Jabodetabek, and assess whether the model aggregation and structure are suitable [22]. The boundary adequacy of KRL Jabodetabek was evaluated based on published reports and studies, expert opinions, and historical system behavior. During the test, dynamic behavior was observed on the system [16]. To make the model more concise and easy-to-explain, only the variables that significantly affect the policy implications of Jabodetabek KRL management were retained [16]. In this way, this paper obtains a complete prediction model that includes all variables and feedback loops influencing the dynamics or policy implications of the KRL Jabodetabek system.
4.1 CLD
Verbal depiction and CLD are suitable for examining a framework. The easiest way to introduce the investigated system is to create a CLD in verbal depiction. In the real world, verbal depiction can qualitatively model a system. The more detailed the description, the easier it is to model the system. The subsystems of the system must be clearly illustrated by the critical subsystems and relationships between them. In addition, the model should only cover the aspects related to the research purpose. The casual loops are often utilized, because they provide an exceptional description of the energetic behavior of the complex system, and present the verbal and mental models clearly through causal and impact connections. In fact, CLDs have been frequently used to organize essential causal instruments into the reference model of the framework behavior [22].
Through the above analysis, this paper prepares a CLD about the phenomenon of KRL Jabodetabek, which reflects the complexity of the service of electric rail trains in the system. In some cases, the criticism circle is a closed chain of causal connections beginning from stock, through a set of choices, rules, physical laws, or activities depending on the stock level, and going back again through a stream to alter the stock [24]. It was discovered that the number of electric rail train passengers is generated from the number of commuters in Jabodetabek, with a share of the new commuter line electric train of 298,834 (9.1%), rather than from the movement of the Jabodetabek population [3].
Since the overall system comprises all the key and relevant variables to address the problem, Bala et al. [22] held that the strategy analysis and the design objectives ought to be included in the system boundary. In the investigated system, the endogenous variables are responsible for initiating problems with the feedback structure of the entire KRL Jabodetabek system. As shown in Figure 3, the key relationships on the CLD of the KRL passenger demand management system depend on the number of commuters in Jabodetabek, who use KRL as a means of transportation. The number of commuters is different from the total population (30 million) in the region. Among the 30 million, only 3.2 million are commuters. Only 9.1% of commuters use Jabodetabek KRL. Therefore, the relationship between the number of KRL commuters and the growth in the number of KRL passengers is a key relationship in our passenger demand management system.
The number of passengers on electric rail trains inevitably affects the number of trains, which in turn affects the frequency of trips, number of employees, and the train maintenance costs. All these factors have an impact on the total cost of the electric rail train. The train cost further influences the ticket price, and thus the number of passengers on the train. In this way, the investigated system has a feedback loop. From this CLD (mental model), the phenomenon of Jabodetabek electric rail train services could be translated into an SFD the fundamental physical structure of the framework from the perspectives of stock and stream. In most cases, the SFD is created after the CLD. The stock deals with the state or condition of the framework, while the stream varies with the system condition. Thus, the stock is the physical structure of the framework, and can be recreated to emulate the energetic behavior of the system. The SFD deals with limited contrast conditions, including the structure of the input loop of the system, and affects the energetic behavior of the system [22]. Furthermore, the variables in the model structure were formulated from the literature in international journals [5-12].
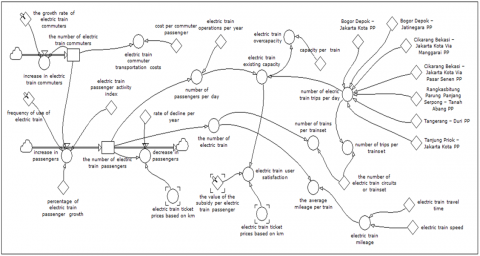
4.2 Sub-model of transportation service
The sub-model of transportation service includes the following variables: the number of Jabodetabek commuters, the number of passengers on electric rail trains, the number of trains, the number of trips on electric rail trains, the number of trainsets, the capacity of the electric rail train, the number of daily passengers on electric rail trains, and the growth rate of commuters.
The term commuter was defined as the individuals who go to work or school, or attend course activities outside their district or city of residence, and routinely return home at the end of each day [2].
Referring to the Law No. 23 of 2007 concerning railways, Government Regulation No. 72 of 2009 concerning railway traffic and transportation, Regulation of the Minister of Transportation PM. No. 63 of 2019 concerning minimum service standards for transportation of people by train, the number of passengers on electric rail trains was defined as the number of Jabodetabek people who use KRL as their mode of transportation for activities.
The number of trains refers to the number of electric rail trains owned and operated by Indonesian state-owned railway companies.
The number of trips on electric rail trains refers to the trips scheduled daily by PT KCI in the Jabodetabek route network.
The number of trainsets refers to the number of trains arranged in a KRL route. Each train series consists of 10-12 trains.
The capacity of the electric rail train was limited to 250 people, 60 of whom are seated passengers. The technical specifications on the trains require that seats must take up 20% of the space on each train, and the density of standing passengers should not surpass 6 people per square meters.
The relationship between the variables in this sub-model is illustrated in Figure 4. Figure 4 shows the relationship between the variables in this sub-model.
The next is to validate the applicability and representativeness of the sub-model of transportation service. Table 1 lists the validation results. During the validation test, the modeled structure was explicitly compared to the expressive information of the fundamental framework structure, and the modeled behavior was contrasted with the natural behavior observed from the framework. Within the approval mode, the sub-model needs to generate real problem signs or practical behavior strategies [22]. In Table 1, the actual data of 2014-2020 were obtained from sources like [2-4, 17-21]. The proposed sub-model produced daily and annual AMEs of 0.05% and 0.05%, respectively, for the number of electric rail train passengers, and generated annual AMEs of 0% and 0.02 %, for the number of Jabodetabek electric rail train commuters, and the number of electric rail trains per year, respectively. In addition, the daily and annual AVEs for the number of electric rail train passengers were 0.01% and 0.01%, respectively. In comparison, the annual AVEs for the number of Jabodetabek electric rail train commuters, and the number of electric rail trains were 0.01% and 0.28%, respectively. All these errors were within the acceptable range of deviation (<10%). Therefore, the sub-model of transportation service can provide good simulation results.
Figure 3. CLD of KRL Jabodetabek
Figure 4. Sub-model of transportation service
Table 1. Performance validation of the sub-model of transportation service
|
Data validation of the number of electric rail train passengers (Passengers/Year) |
Data validation of the number of electric rail train passengers (Passengers/Day) |
||||
|
Year |
Actual |
Simulation |
Year |
Actual |
Simulation |
|
2014 |
206,818,513 |
206,818,513 |
2014 |
566,626 |
566,626 |
|
2015 |
257,530,195 |
232,117,013 |
2015 |
705,562 |
635,937 |
|
2016 |
280,588,767 |
258,351,558 |
2016 |
766,636 |
707,812 |
|
2017 |
315,853,991 |
285,556,781 |
2017 |
865,353 |
782,347 |
|
2018 |
336,798,524 |
313,768,598 |
2018 |
922,736 |
859,640 |
|
2019 |
336,274,343 |
343,024,251 |
2019 |
921,300 |
939,792 |
|
|
|
|
|
|
|
|
Mean |
288,977,388.83 |
273,272,785.85 |
Mean |
791,368.83 |
748,692.56 |
|
AME |
0.05 |
AME |
0.05 |
||
|
Variance |
2,611,118,088,109,720 |
2,597,737,053,825,820 |
Variance |
19,619,392,859 |
19,498,870,736 |
|
AVE |
0.01 |
AVE |
0.01 |
||
|
Data validation of the number of commuters in Jabodetabek Electric Rail trains (Passengers/Year) |
Data validation of the number of electric rail train (Units/Year) |
||||
|
Year |
Actual |
Simulation |
Year |
Actual |
Simulation |
|
2014 |
249,320 |
249,320 |
2014 |
814 |
798 |
|
2015 |
|
|
2015 |
784 |
846 |
|
2016 |
|
|
2016 |
846 |
895 |
|
2017 |
|
|
2017 |
896 |
947 |
|
2018 |
|
|
2018 |
934 |
1,000 |
|
2019 |
298,834 |
298,986 |
2019 |
1100 |
1,056 |
|
|
|
|
2020 |
1150 |
1,113 |
|
Mean |
274,077 |
274,153.02 |
Mean |
932 |
950.81 |
|
AME |
0.00 |
AME |
0.02 |
||
|
Variance |
1,225,818,098 |
1,233,357,391 |
Variance |
20,045.33 |
12,929.37 |
|
AVE |
0.01 |
AVE |
0.28 |
||
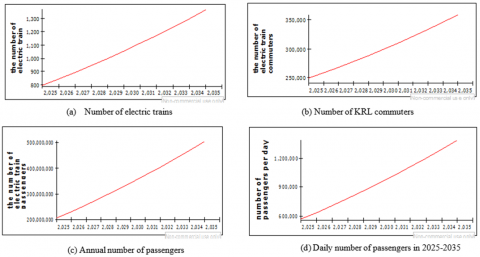
Figure 5. Simulation results of the sub-model of transportation service
Figure 5 displays the simulation results of this sub-model. During the simulation, the actual data of 2014-2020 were obtained from sources like [2-4, 17-21], and utilized. The results show that, the number of passengers increased annually from 2014 to 2019. In 2019, the annual number and average daily number of passengers reached 336,274,343 and 921,300, respectively. This is because 298,834 of Jabodetabek commuters are expected to travel on electric rail trains in that year. If everything goes normally, the number of electric rail train passengers was projected to reach 506,362,985 in 2035, with an average daily number of 1,387,295. The projection was based on the current number Jabodetabek commuters using electric rail trains: 358,545 people.
This increase in the number of passengers calls for more electric rail trains. The number of such trains increased from 814 in 2014 to 1,100 in 2019, and was predicted to reach 1,365 by 2035, under normal conditions. Then, the total number of passengers would be 207,744. As shown in Figure 6, there was a significant reduction in the annual number of passengers (76,034,315) and the daily number of passengers (207,744) in 2020, due to the COVID-19 pandemic [4].
The framework structure is the source of framework behavior, which uncovers itself as an arrangement of occasions over time [24]. The framework behavior is activated by the widespread impacts of the pandemic. For example, the government issued Service of Transportation Direction PM. No. 18 of 2020 concerning transportation control against COVID-19, as well as Service of Transportation Circular No. 14 of 2020 concerning the rules and specialized rules for railway transportation control against COVID-19, which reduce the number of electric rail trains. The pandemic provides an opportunity for Indonesian commuter train operators and the Ministry of Transportation to prepare policies early for the projected growth of passengers and trains in 2035.
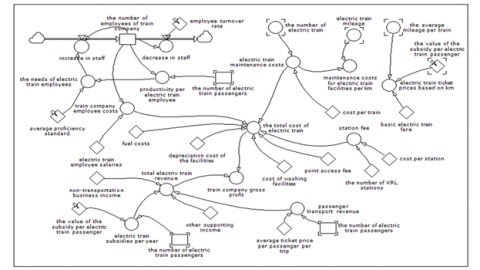
4.3 Sub-model of socioeconomics
The sub-model of socioeconomics covers variables like the number of employees of electric rail trains, the total cost of electric rail trains, the income of passenger transportation, and the subsidies for electric rail trains. Figure 7 below shows the relationship between the variables in this sub-model.
The next is to validate the applicability and representativeness of the sub-model of socioeconomics. Table 2 lists the validation results.
In Table 2, the actual data of 2014-2020 were obtained from sources like [2-4, 17-21]. The proposed sub-model produced AMEs of 0.01%, 0.23%, 0.08%, and 0.17%, respectively, for the annual number of electric rail train employees, the daily subsidies for electric rail trains, the annual income of passenger transportation, and the annual total cost of electric rail trains. In addition, the AVEs were 0.99%, 0.85%, 0.77%, and 0,70%, respectively, for the annual number of electric rail train employees, the daily subsidies for electric rail trains, the annual income of passenger transportation, and the annual total cost of electric rail trains. All these errors were within the acceptable range of deviation (<10%). Therefore, the sub-model of socioeconomics can provide good simulation results.
Figure 6. A behavior of KRL Jabodetabek between 2014 and 2020
Figure 7. Sub-model of socioeconomics
Table 2. Performance validation of the sub-model of socioeconomics
|
Data validation of the number of electric train employees (People/Year) |
Data validation of the number of electric train subsidies (IDR/Year) |
||||
|
Year |
Actual |
Simulation |
Year |
Actual |
Simulation |
|
2014 |
2,123 |
3,028 |
2014 |
524,894,000,000 |
620,455,539,000 |
|
2015 |
3,028 |
2,959 |
2015 |
890,700,000,000 |
696,351,040,200 |
|
2016 |
3,147 |
2,930 |
2016 |
1,079,349,000,000 |
775,054,674,944 |
|
2017 |
3,455 |
2,937 |
2017 |
1,394,775,000,000 |
856,670,344,174 |
|
2018 |
3,621 |
2,973 |
2018 |
1,133,718,000,000 |
941,305,793,166 |
|
2019 |
2,852 |
3,034 |
|
|
|
|
2020 |
2,566 |
3,113 |
|
|
|
|
Mean |
2,970.29 |
|
Mean |
1,004,687,200,000 |
777,967,478,296.90 |
|
AME |
0.01 |
AME |
0.23 |
||
|
Variance |
279,515.87 |
1,983.31 |
Variance |
104,396,604,991,700,000,000,000 |
16,088,321,153,398,500,000,000 |
|
AVE |
0.99 |
AVE |
0.85 |
||
|
Data validation of the number of electric train revenue (IDR/Year) |
Data validation of the total cost of electric trains (IDR/Year) |
||||
|
Year |
Actual |
Simulation |
Year |
Actual |
Simulation |
|
2014 |
634,884,000,000 |
682,501,092,900 |
2014 |
739,417,000,000 |
903,719,563,642 |
|
2015 |
717,926,000,000 |
765,986,144,220 |
2015 |
764,715,000,000 |
929,547,934,408 |
|
2016 |
833,413,000,000 |
852,560,142,439 |
2016 |
786,116,000,000 |
956,730,722,847 |
|
2017 |
1,194,512,000,000 |
942,337,378,592 |
2017 |
923,551,000,000 |
985,239,608,060 |
|
2018 |
1,285,372,000,000 |
1,035,436,372,482 |
2018 |
883,720,000,000 |
1,015,053,032,220 |
|
Mean |
933,221,400,000 |
855,764,226,126.52 |
Mean |
819,503,800,000 |
958,058,172,235.46 |
|
AME |
0.08 |
AME |
0.17 |
||
|
Variance |
84,400,463,234,800,000, 000,000 |
19,466,868,595,581,200, 000,000 |
Variance |
6,369,998,374,700,000, 000,000 |
1,938,631,171,198,760, 000,000 |
|
AVE |
0.77 |
AVE |
0.70 |
||
Figure 8. Simulation results of the sub-model of socioeconomics
Figure 8 shows the simulation results of the sub-model of socioeconomics. During the simulation, the actual data of 2014-2020 were obtained from sources like [2-4, 17-21], and imported to the sub-model. As can be seen from the simulation results, the number of employees of the Indonesian Commuter Railway Company increased year by year from 2014 to 2019. This is a consequence of the annual growth in the number of passengers. In 2019, the Indonesian commuter train companies had 2,852 organic employees, including directors, commissioners, managers, and the general staff, and 8,744 non-organic employees, such as security guards, cleaners, and counters. In 2020, the number of organic employees was reduced to 2,566, and that of non-organic employees to 7,527, due to the impact of COVID-19, as well as retirement, resignation, and dismissals. Under normal conditions, the number of organic employees were projected to reach 3,552 by 2035.
Through transporting passengers on electric rail trains, Indonesian commuter train companies earned more and more money from 2014 to 2019. In 2018, the income stood at IDR 1,285,372,000,000. This was expected to reach IDR 3.34 trillion by 2035, under normal conditions.
Meanwhile, the total cost incurred by train maintenance, station maintenance, operational staff, fuel, line access, and depreciation, showed an increasing trend from 2014 to 2019. In 2018, the total cost amounted to IDR 883,720,000,000. This increase is in line with the variation in the number of travelers, and was projected to reach IDR 1.18 trillion in 2035, under normal conditions.
The closed-loop feedback system determines the behavior of urban electric rail in the world’s second-largest conurbation. The input of the feedback system varies with the output. Besides, the input framework contains a closed-loop structure that returns past activities to control future activities. In the closed framework, the issues are processed step by step, and the results affect the ensuing activities [22]. The numerous connections within the framework are nonlinear. That is, every stock shift in the framework causes their relative quality to shift by an unbalanced sum. Nonlinearity in criticism frameworks occurs in circle dominance and complexity in framework behavior [24].
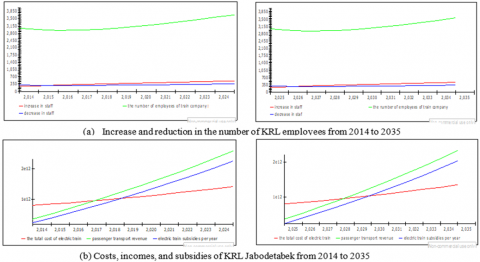
4.4 Scenarios and sensitivity analysis
Given the simulation results on the two sub-models, several strategies must be devised to obtain various alterative policies. Based on current understanding, scenario planning needs to be performed to identify different future possibilities, and consequently, receive the alternative policies [22]. In system dynamics modeling, this is crucial for exploring possible ways to improve Jabodetabek KRL management policy. Therefore, four scenarios were developed, namely, current, pessimistic, moderate, and optimistic states (Table 3), by the “what if” technique, in the light of the actual behavior patterns of Jabodetabek KRL [24].
This was followed by the sensitivity analysis of Jabodetabek KRL management policy. After formulating several questions related to the research purpose, the answers were obtained from the simulation results on the two sub-models. The sensitivity analysis attempts to identify the variables highly sensitive to policy changes. During the analysis, the value of each parameter was changed in turn to capture the parameters the most susceptible to the variation. The parameter variation was implemented upon understanding the behavior patterns with the most impact on the policy changes expected from Jabodetabek KRL [16, 22].
As shown in Table 3, five sensitive policy parameters were discovered, including the frequency of taking electric rail trains, the commuter growth rate, the amount of subsidies per passenger, the standard proficiency of average employees, and the employee turnover rate.
Subsequently, the scenario below was simulated in the four states. The current situation is based on the historical data from 2014 to 2019. This is because the relevant data were not well documented before the major reform in Indonesian Commuter Railway Company in 2013 [4]. The pessimistic state is based on the spread of COVID-19 in Indonesia in March 2020. Expert opinions show that the pandemic would be completely handled by the end of 2022 [25]. The moderate state is based on the hypotheses in McKinsey’s report, which predicts that the COVID-19 pandemic would spread less rapidly by 2023 [26]. The optimistic state is based on the assumptions of previous studies, which expect that the vaccines could be produced and distributed in worldwide markets by 2026 [27]. Figure 9 displays the simulation results of the four scenarios.
As shown in Figure 9, this study focuses on the number of commuters, the number of passengers, the comparison between costs, incomes, and subsidies, and the comparison between the increase and reduction in the number of KRL employees. To the best of our knowledge, these variables were not determined in any known publication.
After these variables were validated, the several scenarios were simulated in search for the best alternative policy for the future (Table 3). The parameter values of each state were not configured based on the existing data, but on the assumptions of planning documents and the expectations of the government and stakeholders (the results of policy sensitivity analysis).
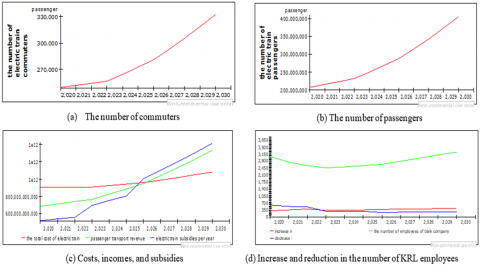
The simulation results suggest that the COVID-19 pandemic reduces the behavior of the Jabodetabek electric rail train service system. In the pessimistic state of 2020-2022, the number of electric rail train passengers were 76,034,315 per year or 208,313 per day in 2020, 84,351,630 per year or 231,100 per day in 2021, and 92,752,118 per year or 254,115 per day in 2022. With the continuous increase in the vaccination against COVID-19, the system was expected to enter the moderate state, with number of electric rail train passengers gradually rising from 101,236,611 per year or 277,360 passengers per day in 2023, and to 137,477,771 per year or 376,651 per day in 2025. The optimistic state was expected to occur in 2026-2030, when the system is predicted to recover. By 2030, the number of electric rail train passengers was expected to reach 277,907,092 per year or 761,389 per day.
The above scenarios have implications for the train company’s income and subsidies. The number of organic employees of Indonesian Commuter Railway Company was bound to experience a decline from 2021 to 1,954 in 2022. Meanwhile, the total income of passenger transportation would fall to IDR 306,081,991,221 in 2022, with the amount of subsidies reaching IDR 185,504,237,104. However, the number of employees was projected to gradually increase in the moderate phase of 2023 to 2025, and recover completely from 2026 to 2030. Therefore, the number of employees was expected to increase to 2,476 in 2030, while the total income and amount of subsidies were estimated to arrive at IDR 917,093,406,458 and IDR 972,674,825,032, respectively.
The above results show that the KRL Jabodetabek urban railway model is valid, considering the small deviation from the historical data. This means the model is suitable for predicting the research variables, including the number of passengers, the number of trains, and the income.
A study in China shows that the rise of train ticket price is bound to suppress the number of train passengers [10]. This view does not apply to Indonesia, because the Indonesian government stabilizes ticket prices by issuing yearly subsidies, despite the constant increase in the number of passengers. This is comparable to the results of a research carried out in Nanchang, the seat of south-eastern China’s Jiangxi Province: the subsidies were found to be a major influencing factor of the relationship between railway construction and sustainable transportation [12]. Better management is crucial to enhancing the safety and security of Jabodetabek KRL, because the growing number of commuter trains stimulates passenger growth, and thus, the income of Indonesian railway companies. This finding is similar to a publication concerning public buses in Bengaluru, India, which proves that commuter trains are the fastest and cheapest approach to achieving sustainable transport [28].
Table 3. Scenario planning
|
Policy Intervention/Strategy |
|
State |
||
|
Current |
Pessimistic |
Moderate |
Optimistic |
|
|
Frequency of use of electric rail train |
365 days |
120 days |
250 days |
365 days |
|
Commuter growth rate |
3.7 %/year |
1 %/year |
3 %/year |
4.3 %/year |
|
The value of the subsidy per passenger |
IDR 3,000/passenger |
IDR 2,500/ passenger |
IDR 3,000/ passenger |
IDR 3,500/ passenger |
|
Standard proficiency of average employees |
300 passengers/employee |
230 passengers/ employee |
300 passengers/employee |
300 passengers/employee |
|
Employee turnover rate |
9.8 %/ year |
19 %/ year |
11 %/ year |
8 %/ year |
|
Applied in years |
2014-2019 |
2020-2022 |
2023-2025 |
2026-2030 |
Figure 9. Simulation results of the four scenarios
The research findings further clarify the factors affecting train safety and security. According to the Law No. 23 of 2007 on railways, safety and security have different meanings in transportation. The former refers to the risk of transportation accidents caused by humans, cars, roads, or the environment, while the latter refers to the state of mind manifested in the smooth functioning of transportation free of disturbances or unlawful activities.
Coppola and Silvestri [29] examined the perception of train users at stations in Italy, and treated security as an issue more threatening than safety, given the high crime risks at the stations. In this study, it was learned that Jabodetabek KRL is experiencing overcapacity, which will endanger the safety and security of KRL users. There is a strongly positive relationship between KRL passenger demand management and safety and security factors. If the number of passenger requests is not regulated well, the train safety and security will be at stake. It is estimated that, by 2030, several strategies will be needed to improve safety and security against this excess capacity, namely, new construction, new trains, and new employees. It is also necessary to increase subsidies and government capital participation for KRL operator PT KCI, in order to boost the financial capacity of state-owned railway enterprises, and to enhance the safety and security of trains.
This study mainly creates a prediction model for the number of passengers, the number of trains, the income, and the amount of subsidies for policymakers to formulate management strategies of Jabodetabek KRL in the future. KRL Jabodetabek is a complex framework, in which interrelated components are coherently organized to achieve a set goal. The organization must go through three stages: interlinking, reasoning, and factor analysis. The factors are the number of trains, the number of passengers, and the number of employees. The interlinking is the regulatory procedure. The purpose of electric trains in KRL Jabodetabek is to provide transportation services for residents and visitors, while gaining profit. The safety and security of KRL passenger demand management have a significant beneficial relation, and may be undermined if the number of passenger requests is not handled well. In this study, a novel prediction model with various features and abundant published data was established for urban demand management. The research results provide new insights into the behavior of the complex urban rail system.
Based on the findings of this research, the government ought to encourage more users to ride commuter trains. Currently, the commuter growth rate is merely 3.7%, which is lower than that of other transportation modes. Besides, the government and PT KCI need to embrace the predicted growth in passengers by developing new railway infrastructure, increasing the number of trains, building new lines, and employing more workers. The government also should maintain and increase the subsidies to the system, such that more commuters would switch from private transportation to rail. Through these measures, the government and Indonesian Commuter Railway Company will be able to implement moderate and optimistic scenarios to restore and enhance the safety and security of the Jabodetabek electric rail train system. However, this requires much effort to simultaneously handle and control the spread of COVID-19 in various sectors.
The main limitation of this research is that only rail safety and security is considered, in the context of the management of future urban rail demand. The future study will investigate other factors affecting rail safety and security, such as rail and platform construction, rail user safety culture, signaling technology, as well as other themes.
The authors are grateful for the LPDP RI scholarship grant and for the assistance of all individuals and parties who helped in the completion of this study, particularly the Indonesian Ministry of Transportation, the Research Advisory Commission, as well as the Central Agency for Human Resources Development of Transportation Apparatus.
[1] Younger, J.S., Parry, D.E., Lubis, H.A., McLernon, A., Wignall, D.J., Hasan, D., Benton, G.G. (2015). Greater Jakarta, the world's second-largest conurbation – part 1. Proceedings of the Institution of Civil Engineers - Municipal Engineer, 168(4): 253-261. https://doi.org/10.1680/jmuen.14.00050
[2] Indonesian Central Bureau of Statistics. (2014). Jabodetabek Commuter Statistics. Jakarta: Indonesian Central Bureau of Statistics.
[3] Indonesian Central Bureau of Statistics. (2019). Jabodetabek Commuter Statistics. Jakarta: Indonesian Central Bureau of Statistics.
[4] Indonesian Commuter Train Company. (2021). Submission of Data on Electric Trains 2013-2020. Jakarta.
[5] Huang, D., Han, M., Jiang, Y. (2021). Research on freight transportation carbon emission reduction based on system dynamics. Applied Sciences, 11(5): 2041. https://doi.org/10.3390/app11052041
[6] Lei, X., Zhang, J., Li, J. (2012). A system dynamics model for urban low-carbon transport and simulation in the City of Shanghai, China. Adv Inf Sci Serv Sci., 4(1): 239-246. https://doi.org/10.4156/AISS.vol4.issue1.31
[7] Yang, C., Miao, Z. (2013). System dynamics model of shanghai passenger transportation structure evolution. Procedia - Social and Behavioral Sciences, 96: 1110-1118. https://doi.org/10.1016/j.sbspro.2013.08.127
[8] Yang, Y., Zhang, P., Ni, S. (2014). Assessment of the impacts of urban rail transit on metropolitan regions using system dynamics model. Transportation Research Procedia, 4: 521-534. https://doi.org/10.1016/j.tIDRro.2014.11.040
[9] Wang, L., Zhang, X. (2017). System dynamic model for simulating demand-supply interaction of railway express freight system. Mathematical Problems in Engineering, 2017: 1-10. https://doi.org/10.1155/2017/8481708
[10] Zhi, X. (2018). Analysis and forecast of railway passenger volume using system dynamics. Proceedings of the 2018 2nd International Conference on Electrical Engineering and Automation (ICEEA 2018), pp. 233-237. https://doi.org/10.2991/iceea-18.2018.51
[11] Hu, W., Dong, J., Hwang, B., Ren, R., Chen, Y., Chen, Z. (2020). Using system dynamics to analyze the development of urban freight transportation system based on rail transit: A case study of Beijing. Sustainable Cities and Society, 53: 101923. https://doi.org/10.1016/j.scs.2019.101923
[12] Xue, Y., Cheng, L., Wang, K., An, J., Guan, H. (2020). System dynamics analysis of the relationship between transit metropolis construction and sustainable development of the urban transportation-case study of Nanchang city, China. Sustainability, 12(7): 3028. https://doi.org/10.3390/su12073028
[13] Amissah, M., Gannon, T., Monat, J. (2020). What is systems thinking? Expert perspectives from the WPI systems thinking colloquium of 2 October 2019. Systems, 8(1): 1-26. https://doi.org/10.3390/systems8010006
[14] Forrester, J.W. (1968). Principles of System. Cambridge: Productivity Press.
[15] Forrester, J.W. (1969). Urban Dynamics. Waltham: Pegasus Communications, Inc.
[16] Sterman, J. (2000). Business Dynamics: System Thinking and Modeling for Complex World. The Mc Graw-Hill Companies.
[17] Indonesian Commuter Train Company. (2016). Annual report 2015: Best Choice for Urban Transport. Jakarta.
[18] Indonesian Commuter Train Company. (2017). Annual report 2016: Towards Excellence Public Service and Beyond. Jakarta.
[19] Indonesian commuter train company. (2018). Annual report 2017: A Transformation for Greater Service. Jakarta.
[20] Indonesian commuter train company. (2019). Annual report 2018: Achieving Success Beyond Boundaries. Jakarta.
[21] Ministry of Transportation. (2020). Transportation Statistics 2019. Jakarta: Pustikom.
[22] Bala, B.K., Arshad, F.M., Noh, K.M. (2018). System Dynamics: Modelling and Simulation. Singapore: Springer. https://doi.org/10.1007/978-981-10-2045-2
[23] Fauzi A. (2019). Sustainability Analysis Techniques. Jakarta, Gramedia.
[24] Meadows DH. (2009). Thinking in Systems. London: Earthscan.
[25] Reuters. (2021). Moderna chief executive sees pandemic over in a year. Available: https://www.reuters.com/business/healthcare-pharmaceuticals/moderna-chief-executive-sees-pandemic-over-year-newspaper-2021-09-23/, accessed on 28 September 2021.
[26] Mckinsey. (2021). When will the Covid 19 pandemic end. Available: https://www.mckinsey.com/industries/healthcare-systems-and-services/our-insights/when-will-the-covid-19-pandemicend#:~:text=At%2Drisk%20countries.&text=Estimates%20of%20their%20overall%20immunity,to%20achieve%20high%20vaccine%20coverage, accessed on 28 September 2021.
[27] Businesswire. (2021). Global Coronavirus COVID-19 Vaccine Market to 2026. Available: https://www.businesswire.com/news/home/20210730005261/en/Global-Coronavirus-COVID-19-Vaccine-Market-to-2026-By-Infection-Type-Vaccine-Type-Product-Type-Route-of-Administration-Patient-Type-End-User-Region, accessed on 28 September 2021.
[28] Harsha, V., Karmarkar, O., Verma, A. (2020). Sustainable urban transport policies to improve public transportation system: A case study of Bengaluru, India. Transportation Research Procedia, 48: 3545-3561. https://doi.org/10.1016/j.trpro.2020.08.097
[29] Coppola, P., Silvestri, F. (2020). Assessing travelers’ safety and security perception in railway stations. Case Studies on Transport Policy, 8(4): 1127-1136. https://doi.org/10.1016/j.cstp.2020.05.006