Nurul Khakhim* | Wahyu Lazuardi | Arief Wicaksono | Dimas N.D. Pratama | Azis Musthofa
© 2021 IIETA. This article is published by IIETA and is licensed under the CC BY 4.0 license (http://creativecommons.org/licenses/by/4.0/).
OPEN ACCESS
Mangrove ecosystems at the estuary of Teleng River, Pacitan Bay, call for preservation, protection, and development as a natural vegetative defense against tsunami impacts. Limited availability of potential land for mangrove growth poses a challenge to sustainable mangrove management. To anticipate land acquisition for another use, it is necessary to study land suitability for mangrove and mangrove conservation priorities in the Pacitan Bay. The land suitability parameters consisted of landform, slope, soil texture, and tidal fluctuation, while the mangrove conservation priority was determined based on several aspects: mangrove land cover reduction, mangrove damage level, beach ridge and riparian zone, and land suitability. The results indicate that lands with high potential for mangroves are distributed along Teleng and Grindulu Rivers but not precisely at the estuary. Based on the suitability results, highly potential and potential lands are proposed for mangrove planting, while existing mangroves are for protection and preservation zones, especially on the sides where relatively young mangroves grow for their roots are not strong enough to withstand river currents.
mangrove density, land degradation, boundaries, land suitability for mangrove, mangrove conservation
A coastal area is a transitional zone between land and marine ecosystems. As such, its condition is dynamic and fluctuating depending on the developments that happen on the land and in the sea. Ecosystems in coastal areas have specifically adapted to the dynamic and fluctuating characteristics; one of the examples is the mangrove ecosystem [1]. Mangroves are one of the coastal resources that have potential as a source in food production and of medicinal raw materials, habitats and nutrient providers, and coastal natural barriers, and for preventing coastal erosion and seawater intrusion, stabilizing sediments, reducing CO2 levels in the atmosphere, and lessening the impact caused by the tsunami [2]. Mangrove ecosystems are one of the coastal features that are often developed because they have high productivity and can easily adapt to tidal areas, estuaries, and lagoons [3]. The current trend of mangrove development leads to its use for ecotourism [4]. Besides providing environmental education to the people, mangrove development also has added value in improving the quality of the surrounding environment [5].
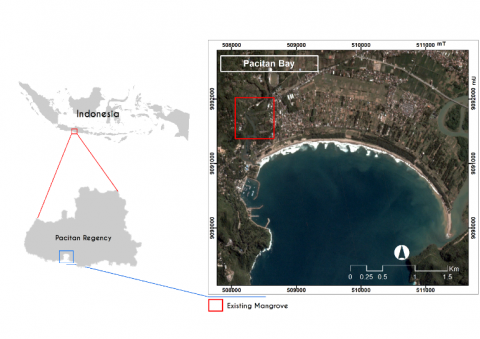
Pacitan Bay is one of the strategic coastal areas that have the potential for natural resources development. However, behind this potential, the bay is also a tsunami hazard zone because it is directly adjacent to the Indian Ocean, which incidentally has an active fault along the southern coast of Java. Therefore, if a megathrust earthquake occurs, it can trigger a tsunami and affect resource availability in the area. There are two large rivers disemboguing into Pacitan Bay, namely Teleng River in the west and Grindulu River in the east of Pacitan Bay. A river can act as an entry point of tsunami propagation towards the mainland. There are already green belts of beach pines (Casuarina equisetifolia) in Pacitan Bay, which is located on the sandy beach that directly faces the ocean. Although there is none on the estuary, the existing mangrove ecosystem is environmentally potential for green belts, providing that preservation, protection, and development are properly realized. This is aimed at developing a natural vegetative defense to mitigate the impact of tsunamis.
One of the biggest challenges in mangrove development is that the potential land available for the growth of this ecosystem is limited and that most are already utilized for other land uses. For these reasons, mangrove development can only be performed in a limited manner. To overcome this problem, it is necessary to carry out sustainable mangrove management, especially determining potential land as a priority for accurately-targeted mangrove management, development, and conservation [6]. This is also to anticipate land acquisitions for other uses. Therefore, mangrove ecosystems are very important to manage to improve environmental quality and community welfare [7].
One of the efforts to identify potential land effectively and efficiently is to utilize Geographical Information System (GIS) technology [8]. This technology can integrate multiple data to produce the latest information, especially prioritized potential land for mangrove development [9]. Based on this, the study aimed to map the potential land that can be prioritized for mangrove development on the estuary of Pacitan Bay. The research question is “Which areas have the potential for mangrove planting, and what are the efforts to protect them?”. Producing spatial information of this prioritized potential land can make it easier for stakeholders, policymakers, and conservation actors to manage mangrove ecosystems. Therefore, planning for mangrove management and conservation can be put as a priority and conducted more precisely. The novelty of this research lies in the procedures for preparing mangrove mitigation directions that are still absent in Pacitan Bay as an addition to tsunami disaster mitigation efforts.
2.1 Study area
Pacitan Bay is part of the Pacitan Regency in East Java Province with various coastal potentials (Figure 1) in terms of resources like mangrove ecosystems, tourism, and even tsunami threats. The prospect of the bay’s coast needs to be preserved and protected to increase its use-value for the surrounding community. To date, one of the steps taken for this purpose is the development of a green belt (Casuarina equisetifolia). Apart from minimizing the possible impact of tsunamis or storms, a green belt can be a tourist attraction and supporting feature—a place for tourists to take shelter (shade).
The potential of mangroves in Pacitan Bay also needs to be developed because it can act as a green belt buffer to help minimize the impact of a tsunami propagating through the river inlet to the mainland. Mangrove development in this area will offer substantial benefits, which, in addition to reducing disaster impacts, can bring advantage to many environmental aspects, biodiversity, and edu-ecotourism facilities resulting in positive implications to the local economy. Therefore, increasing mangrove development requires support from the community and government to manage, conserve, and protect the ecosystem from the threat of damage.
2.2 Satellite image data
The images used in this study were the 2006 QuickBird (2.4 m) and the 2020 PlanetScope (3m) (Table 1). Using images captured in different years was intended to see the mangrove development trend occurring between 2006 and 2020. Both imageries were geometrically corrected by the first-order polynomial image-to-image registration method (RMSE < 1.5 m) to minimize their geolocational errors, making them show almost uniform geometries. Each image was also corrected atmospherically to reduce noise from atmospheric aerosol particles that affect image clarity and obtain a higher correction level, at-surface reflectance. Therefore, the image pixel already represents the bottom of object reflectance. These two images were then visually interpreted to identify mangrove areas in 2006 and 2020.
Table 1. Characteristics of QuickBird and PlanetScope images
|
|
QuickBird |
PlanetScope |
|
Spatial Resolution |
2.4 |
3 |
|
Spectral Band |
4 |
4 |
|
Blue |
430–545 nm |
420–530 nm |
|
Green |
466–620 nm |
500–590 nm |
|
Red |
590–710 nm |
610–700 nm |
|
NIR |
715–918 nm |
770–900 nm |
|
Radiometric Resolution |
11-bit |
11-bit |
2.3 Mangrove identification
Because the used images have a fairly detailed spatial resolution, mangroves can be quickly identified with visual interpretation, especially with the help of near-infrared (NIR) channels that are sensitive to vegetation types [10], including mangrove trees. Then, on-screen digitization was performed on each image scene to see the spatial distribution of mangroves in 2006 and 2020. Change detection analysis was carried out to determine if and to what extent the size of the mangrove areas had decreased or increased.
Figure 1. Study area
2.4 Mangrove damage level identification
The mangrove damage level can be measured by integrating data on land use, mangrove canopy density, and soil resistance to abrasion [11]. These criteria were selected based on their significance for the existence of mangroves. Each was weighted to create spatial integration. The criteria in question and their respective weights and scores are presented in Table 2.
Each criterion or variable was processed using a simple mathematical equation to produce the total score (Eq. (1)), which was then subdivided according to the condition of each mangrove damage level presented in Table 3. This division is regulated by the Directorate General of Land Rehabilitation and Social Forestry (2005).
Total Score = (LU Score * 45) + (MD Score * 35) + (SR Score * 20) (1)
Table 2. Criteria for mangrove damage level assessment
|
No |
Criteria |
Weights |
Scores |
|
1 |
Land Use type (LU) |
45 |
3: forest |
|
2: fish pond, mixed-crop plantation, cropland |
|||
|
1: settlement, industry, paddy field, bare land |
|||
|
2 |
Mangrove Density (MD) |
35 |
3: dense (>70%) |
|
2: medium (50–69%) |
|||
|
1: sparse (<50%) |
|||
|
3 |
Soil Resistance to Abrasion (SR) |
20 |
3: clay |
|
2: mixture |
|||
|
1: sand |
Table 3. Score criteria for mangrove damage levels
|
Total Score |
Damage Level |
|
100–166 |
Heavily Damaged |
|
167–233 |
Damaged |
|
234–300 |
Not Damaged |
Source: Directorate General of Land Rehabilitation and Social Forestry (2005)
2.5 Mangrove forest suitability analysis
The land suitability for mangrove development was analyzed by creating land units to determine the parameter location in land suitability observation units. The land unit integrated the land suitability parameters: landform, land use, slope, tides, height, and frequency of inundation. Landform and land use data were obtained through image interpretation. The slope was obtained from the DEMNAS data processing results. Soil texture was derived from geological and landform information. Tides were secondary data obtained from the Tide Records collected and organized by BIG (Indonesian Geospatial Information Agency) (http://tides.big.go.id/pasut/index.html), which are the predictive model of tides from the tide measurement stations in Pacitan from 1990 to 2020 that has been generated using the least square method. The criteria for each of these parameters are presented in Table 4.
These parameters were mathematically summed to produce a total score (Eq. (2)) that represented land suitability, which was divided into four levels of potential using regular class intervals (Table 5).
Table 4. Criteria for land suitability parameters for mangroves
|
No |
Landform |
Weight |
No |
Soil Texture |
Weight |
|
1 |
Delta |
5 |
1 |
Clay |
5 |
|
2 |
Mudflat |
5 |
2 |
Silty Clay |
5 |
|
3 |
Salt Marsh |
5 |
3 |
Silty Loam |
4 |
|
4 |
Coastal Alluvial Plain |
3 |
4 |
Clay Loam |
4 |
|
5 |
Back Swamp |
2 |
5 |
Sandy Loam |
3 |
|
6 |
Alluvial Plain |
2 |
6 |
Loam |
3 |
|
7 |
Floodplain |
2 |
7 |
Sand |
1 |
|
8 |
Beach |
2 |
|
|
|
|
9 |
Natural Levee |
1 |
No |
Land Use |
Weight |
|
10 |
Beach Ridge |
1 |
1 |
Bare land |
5 |
|
|
|
|
2 |
Bush |
5 |
|
No |
Tidal Fluctuation |
Weight |
3 |
Mangrove |
5 |
|
1 |
>4.00 |
5 |
4 |
Grassland |
4 |
|
2 |
3.01–4.00 |
4 |
5 |
Fish pond |
3 |
|
3 |
2.01–3.00 |
3 |
6 |
Paddy field |
2 |
|
4 |
1.01–2.00 |
2 |
7 |
Cropland |
2 |
|
5 |
0.1–1.00 |
1 |
8 |
Mixed-crop |
2 |
|
|
|
|
9 |
Settlement |
1 |
|
No |
Slope (%) |
Weight |
|
|
|
|
1 |
<3 |
5 |
|
|
|
|
2 |
3-8 |
3 |
|
|
|
|
3 |
>8 |
1 |
|
|
|
Total Value = Landform + Slope + Soil Texture + Tidal Fluctuation + Land Use (2)
Table 5. Classification of land potentials for mangrove
|
No |
Class |
|
1 |
Highly Potential |
|
2 |
Potential |
|
3 |
Less Potential |
|
4 |
Not Potential |
2.6 Mangrove conservation management analysis
The mangrove conservation directions were analyzed by involving several variables, namely: 1) The damage level of mangroves, 2) Changes in mangrove land cover, 3) Land suitability for mangroves; and 4) Coastal and river buffer zones (source). These variables were then adjusted to the criteria for conservation priority levels (Table 6), and coastal and river boundary data were added to the conservation directions analysis because both the coast and river are protected areas and often have mangrove cover, playing a crucial role in mangrove development and site resilience to adversities. Each adjusted variable was assigned a score and a weight value and then analyzed using Eq. (3) to produce a total score.
Total Score = (Mangrove Damage Level * 30) + (Mangrove Loss * 30) + (Buffer Zone * 25) + (Land Suitability for Mangroves * 15) (3)
The four criteria or variables above were overlaid, and the total score of each unit of analysis was then grouped according to the priority level. There are three priority levels: Priority 1, Priority 2, and Priority 3. Each has a different form of activity, depending on which unit is preferred (Table 7).
Table 6. Criteria for parameters of mangrove conservation priorities
|
Variables |
Score |
Weight |
|
Mangrove Loss |
|
30 |
|
Area Reduction |
2 |
|
|
No Area Reduction |
1 |
|
|
Mangrove Damage Level |
|
30 |
|
Heavily Damaged |
3 |
|
|
Damaged |
2 |
|
|
Not Damaged |
1 |
|
|
River and Beach Buffer Zone |
|
25 |
|
Buffer Zone |
2 |
|
|
Non-Buffer Zone |
1 |
|
|
Land Potentials for Mangroves (Suitability) |
|
15 |
|
Highly Potential |
2 |
|
|
Potential |
1 |
Table 7. Criteria for mangrove conservation priorities
|
Total Score |
Priority Scale |
Description |
|
166 – 230 |
Priority I |
Emphasis is placed on mangrove protection and preservation, such as planting new seedlings (rehabilitation), prohibiting the harvest of mangrove parts and trees and other economic purposes that potentially decrease and degrade the mangrove area, and prohibiting activities other than mangrove conservation. |
|
100 – 165 |
Priority II |
Emphasis is placed on the controlled use of mangroves or the combination of mangrove and non-mangrove spatial use where the latter is conducted at a lower intensity than the former. |
|
<165 |
Priority III |
Emphasis is placed on mangrove area development or the combination of mangrove and non-mangrove spatial use with a higher intensity than Priority II. |
3.1 Mangrove identification
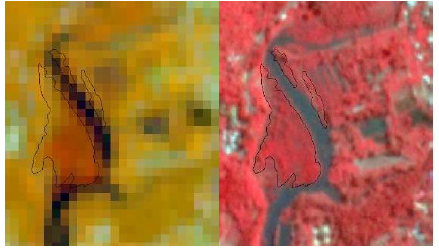
QuickBird and PlanetScope imagery used in mangrove identification has been geometrically corrected. Mangrove appearances in the PlanetScope image were delineated with the help of Sentinel-2A imagery, namely by applying the 8A114 composite that spectrally sharpens and makes a suspected mangrove object appear dark orange and easy to distinguish from other vegetation objects. Then, mangrove digitization on the 2006 QuickBird image and the PlanetScope image in 2017-2020 followed the mangrove boundaries derived in the previous delineation (Figure 2). This process adopted several provisions: the mangrove digitization started with the 2006 QuickBird image, then the resulting mangrove boundaries were reused with adjustments to mangrove conditions from 2017 to 2020. Thus, the derived mangrove changes occurring between these years are not caused by the digitization and geometric differences between the images.
Figure 2. Dark orange mangroves on Sentinel-2a 8A114 composite image (left) and mangrove digitization results on 2020 PlanetScope image (right)
Several studies regarding the visual identification of mangroves are as follows. Umroh et al. [12] used the composite 564 of Landsat 8 imagery to delineate mangroves on Pongok Island, Bangka Belitung. Purwanto et al. [13, 14] used the composite 564 of Landsat 8 image to outline mangrove boundaries in Segara Anakan, Cilacap. Sulong et al. [15] distinguished the types of mangrove forests along estuaries and riverbanks through interpretation based on hue and texture in black and white aerial photographs then classified digitally based on pixel values. The Landsat 5 TM images used in visual interpretation were in the composite 453. Purwanto and dan Asriningrum [14] conducted a study to determine the optimal composite of several images for mangrove identification in Segara Anakan, Cilacap, using the OIF method, and it was known that the best composites were 564 in Landsat 8 images, 8A114 in Sentinel 2A images, and 341 in SPOT 6, with the near-infrared (NIR) and far-infrared (SWIR) channels playing major roles in differentiating between mangrove and non-mangrove vegetation.
Some of the characteristics of mangroves that are used as keys to remote sensing interpretation are mangrove location, zoning patterns, canopy texture characteristics, and canopy’s spectral reflectance characteristics [16]. Heenkenda et al. [17] stated that there are two challenges in mapping wetland vegetation (including mangroves) using remote sensing techniques. First, accurately separating the boundaries of mangrove communities is challenging because of their high spectral and spatial variability. Second, the spectral reflectance value of wetland vegetation is often mixed with wet soil and water bodies. Wet soil and water bodies will weaken the reflection at NIR and SWIR wavelengths, lowering the mapping accuracy. Therefore, selecting data sources in mangrove mapping needs to consider the ideal spatial and spectral resolution. Xia et al. [18] stated that tides periodically inundate mangrove forests, and, thus, remote sensing methods that only use one-time data recording tend to underestimate the spatial distribution of mangrove forests, especially when images are recorded during high tide. The research by Green et al. [19] that compared Landsat 5 TM, CASI, and SPOT XS images in mangrove mapping recommends using Landsat TM images to map mangrove and non-mangrove vegetation in a large study area and CASI to distinguish mangrove species. Meanwhile, SPOT XS was unable to separate mangrove and non-mangrove vegetation properly. Medium-resolution satellites such as Landsat are quite reliable in mapping the distribution of mangrove forests and their dynamics. Mapping and monitoring of mangroves at higher spatial resolution is needed in the future to produce detailed information on land covers, such as species composition, ecosystem shifts, waterways, infrastructure, and development areas. High-spatial resolution imagery is suitable for obtaining single stands of newly grown mangroves, small-island mangroves, and relatively small, fragmented, and elongated mangrove stands that cannot be identified using Landsat images with a spatial resolution of 30 m [20].
Based on the results of previous research on mangrove identification using remote sensing data, a PlanetScope image with a resolution of 3 m (high resolution) was used to delineate the existing mangroves in an area of about 2 hectares in the Teleng River. Because the PlanetScope imagery was not available until 2017, the mangrove monitoring started from 2017 to 2020, while the QuickBird imagery (spatial resolution of 2.4 m) was used to identify mangroves in 2006. The choice of wavelength in PlanetScope imagery is limited (only visible and NIR), and the radiometric inconsistency of the image requires the mangrove identification process to be carried out visually with the help of Sentinel-2A images in the composite 8A114, as proposed by Purwanto and dan Asriningrum [14]. It is equivalent to the composite 564 in Landsat 8 images [11, 13, 14, 21]. The entire image was recorded during low tides (Table 8).
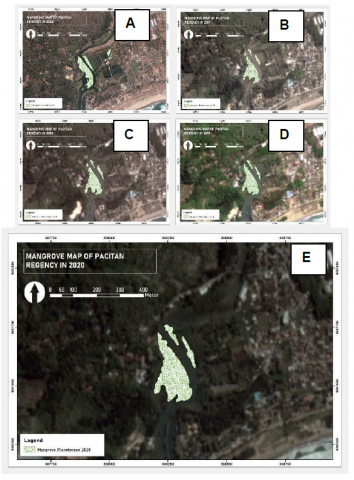
Figure 3. Mangrove distribution maps in the Teleng River, Pacitan Bay in 2006 (A), 2017 (B), 2018 (C), 2019 (D), and 2020 (E)
Table 8. Mangrove extents and tide levels in 2006 and 2017-2020
|
Image Acquisition Date |
Area (Ha) |
Z (m) |
|
September 29, 2006 |
2.141 |
-0.492 (ebb) |
|
May 19, 2017 |
2.143 |
-0.116 (ebb) |
|
May 04, 2018 |
2.500 |
-0.898 (ebb) |
|
May 18, 2019 |
2.633 |
-0.356 (ebb) |
|
May 24, 2020 |
2.678 |
-0.852 (ebb) |
*Z is the tide level relative to MSL.
The mangrove distribution maps resulting from image-based identification in 2006 and 2017-2020 are presented in Figure 3. Mangroves were found on the bank of the Teleng River 600 m from the river mouth in Pacitan Bay. The mangrove development formed a trend, that is, towards the south, which is influenced by the supply of fresh and salty water and riverbed sediments suitable for mangrove growth. From year to year, mangroves consistently increased in area, although not significantly, as seen in Table 8. Further, they were located relatively close to residential areas. It can be seen in the 2006 image that there were ponds in the eastern part of the mangroves and that mangroves located on the pond embankments acted as a barrier to riverbank erosion. However, since 2017, ponds have no longer been visible around the mangrove forests.
3.2 Mangrove damage level identification
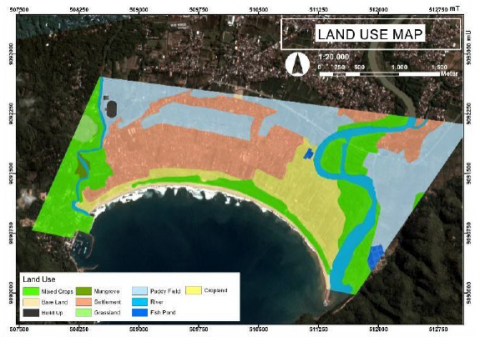
3.2.1 Land use type
Land use data were obtained by detailing Indonesian top cover on a scale of 1:25,000 through visual interpretation of PlanetScope imagery. The results of the land use interpretation and extents are presented in Figure 4 and Table 9 respectively.
Figure 4. Land use map
Table 9. Division of the study area by land use
|
Land Use |
Area (Ha) |
|
Mixed-crop plantation |
165.3 |
|
Bare land |
17.07 |
|
Build up |
2.88 |
|
Mangrove |
2.95 |
|
Settlement |
190.7 |
|
Grassland |
6.91 |
|
Paddy field |
199.09 |
|
River |
52.31 |
|
Fish pond |
5.06 |
|
Cropland |
91.88 |
Most of the land uses situated directly adjacent to the river were mixed-crops, which were also directly adjacent to the mangrove area west of Pacitan Bay. Paddy fields, settlements, mixed-crop plantations, and bare land also bordered the rivers but were not directly adjacent to the mangrove area. Settlements and dry-farming fields were about 200 meters from the mangrove area. In the context of mangrove damage level, mixed-crop plantations contributed a score of influence of 2 out of 3, whereas settlements and dry-farming fields contributed a score of 1. The smaller the score, the higher the mangrove damage level. The damage level indicates the combination of predetermined parameters that potentially damage the mangrove area.
3.2.2 Mangrove canopy density
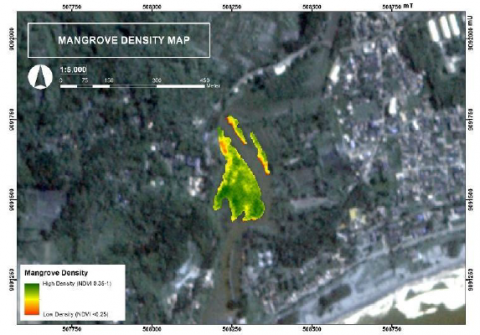
Mangrove canopy density data were obtained by classifying the results of PlanetScope image transformation, NDVI (Normalized Difference Vegetation Index). In the pre-processing stage, the PlanetScope image pixels were first converted from integer data into float data by dividing the value of each pixel by 10,000. The NDVI values were then classified according to the Regulation of the Minister of Forestry No. 12/2012 with adjustments (Table 10). The derived mangrove canopy density is presented in Figure 5.
Table 10. Mangrove density classification based on NDVI
|
NDVI |
Description |
|
0.351 – 1.00 |
Dense canopy |
|
0.251 – 0.35 |
Medium canopy |
|
-0.5 – 0.25 |
Sparse canopy |
Source: Regulation of the Minister of Forestry No. 12 of 2012 on Second Amendment to Regulation No. P.32/Menhut-II/2009 on Procedures for Preparing Rehabilitation Engineering Plans for Forests and Land in Watersheds (RTk RHL-DAS)
Figure 5. Mangrove density map in 2017-2020
Table 11. Mangrove densities and their respective areas
|
Mangrove Density |
Area (Ha) |
|
Dense |
2.67 |
|
Medium |
0.000402 |
Table 11 shows that a large share of the mangrove area was densely covered, whereas only a small part had medium density. The southern (west of the river) and southwestern parts (east of the river) had a lower canopy density than other parts. This can be attributed to the young mangroves in the two locations whose leaves are not as thick as those of mature mangroves. Young mangrove trees are at higher risk of damage by events or activities in their surrounding environments. Therefore, mangroves with a low canopy density had a smaller score, which, in this case, is moderate density (score = 2 out of 3).
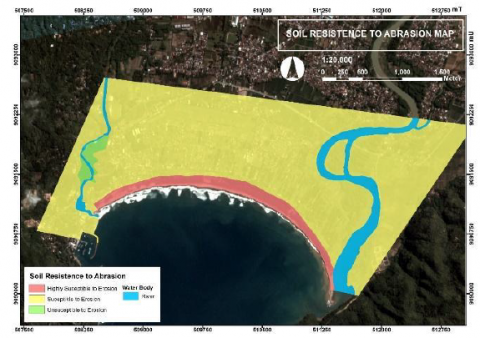
3.2.3 Soil resistance to abrasion
Data on soil resistance to abrasion were obtained by applying the soil texture approach, while the soil texture data were derived from landform interpretation. Soil types that are not susceptible to abrasion have the texture of clay. On the contrary, soils with mixed texture and sand texture are, respectively, susceptible and very susceptible to abrasion. The classification results of soil resistance to abrasion and extents are presented in Figure 6 and Table 12 respectively.
Figure 6. Map of soil resistance to abrasion
Table 12. Soil resistance levels to abrasion and their respective areas
|
Soil Resistance to Abrasion |
Area (Ha) |
|
Highly Susceptible to Abrasion |
44.828 |
|
Susceptible to Abrasion |
620.037 |
|
Unsusceptible to Abrasion |
9.758 |
Soils that are prone to abrasion contain dynamic materials that can easily change positions. Therefore, mangroves planted on these soils can have unstable rooting and are prone to damage, especially in young mangroves. For this reason, land consisting of these soils is not suitable for mangrove growth. Soils with high susceptibility to abrasion were identified along the coast, whereas most soils sensitive to abrasion were found in almost all the study area. Soils unsusceptible to abrasion were located west of the bay and directly adjacent to the river, covering an area of 9,758 ha. This type of soil was scored 3 out of 3, meaning that the mangroves grown on it tend to have a low potential for damage.
3.3 Mangrove forest suitability analysis
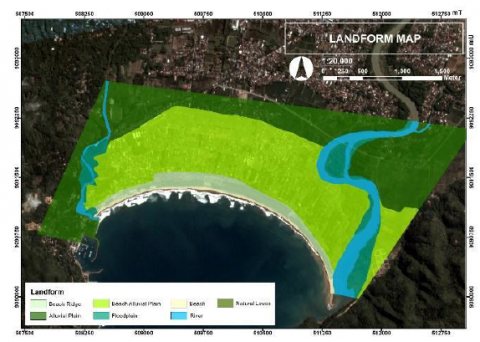
3.3.1 Landform
The landforms, as presented in Figure 7, were delineated through visual interpretation by considering geology, slope, and genesis. Pacitan Bay is a shaky beach flanked by two large rivers. Its landforms, influenced by fluvio-marine processes, consist of pocket hides, shoals, alluvial plains, coastal alluvial plains, floodplains, and natural embankments. The landform type and area are described in Table 13.
Table 13. Division of the study area by landform
|
Landform |
Area (Ha) |
|
Beach Ridge |
44.56 |
|
Alluvial Plain |
270.57 |
|
Beach Alluvial Plain |
307.11 |
|
Floodplain |
41.08 |
|
Beach |
8.59 |
|
River |
55.14 |
|
Natural Levee |
2.68 |
Figure 7. Landform map
3.3.2 Slope
Slope data were obtained from DEMNAS BIG in the form of DSM, which requires conversion into DTM. In this process, the slope value of the terrain filter in the PCI Geomatica program was set at 2 degrees. The slope classification results and extents are presented in Figure 8 and Table 14 respectively. It shows that the study area mainly had <3% slopes scattered along the bay, while the >8% slopes were found in karst hills abutting the western side of Pacitan Bay. These hills were also randomly scattered along the bay.
Figure 8. Slope map
Table 14. Division of the study area by slope
|
Slope |
Area (Ha) |
|
>8% |
238.9 |
|
3–8% |
335.37 |
|
<3% |
391.43 |
3.3.3 Soil texture
Soil texture data were derived through landform interpretation. The soil in the study area was mainly loam because of the combination of the marine deposition process, which brings more sand resulting from erosion on ancient volcanoes and karst hills, and the fluvial process that carries clay sediments onto the bay. The soil textures and their respective areas are presented in Table 15, and the classification results are presented in Figure 9.
Table 15. Soil textures and their respective areas
|
Soil Texture |
Area (Ha) |
|
Loam |
586.027 |
|
Clay Loam |
0.656 |
|
Clay |
9.758 |
|
Sandy Clay |
33.354 |
|
Sand |
44.828 |
Figure 9. Soil texture map
3.3.4 Tidal fluctuation
The tide point data were obtained from the tide predictive model provided by the BIG’s Tide Records at two locations in the river mouth (Location 1: X = -8,224 and Y = 111,0751; Location 2: X: -8,234 and Y = 111,1012) starting from 1990 until 2020 (for 30 years). At Location 1, the minimum tide is 1.356 m, and the maximum tide is 2.613 m, while the tide at Location 2 ranges between 1.358 m and 2.616 m. The classification results of the tidal fluctuation are presented in Figure 10 and Table 16.
Figure 10. Tidal fluctuation map
Table 16. Area of tidal fluctuation
|
Tidal Fluctuation |
Area (Ha) |
|
2.01‒3 m |
720.51 |
3.3.5 Land use
Land use data were obtained by detailing the Indonesian top cover on a scale of 1:25,000 through visual interpretation of PlanetScope imagery. The results of the land use interpretation are presented in Figure 11. Parts of Pacitan Bay were dominantly used for paddy fields and settlements. Mixed-crop plantations were found around the existing mangroves, which allows for human intervention by two routes: land and river. The distance between the mangrove forest from the nearest residential area was about 250 m. Although the existing land use conditions indicate that it is still possible to expand the mangrove area, it is also necessary to study the land suitability for mangroves based on other land and water physical parameters.
Figure 11. Land use map
3.4 Mangrove conservation management analysis
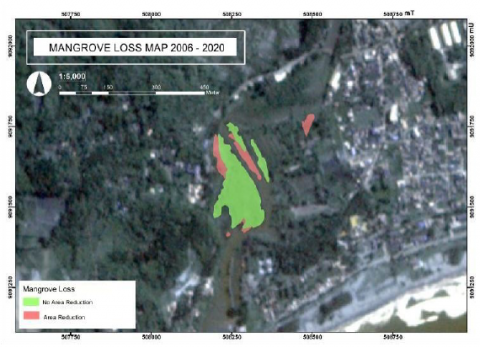
3.4.1 Reduction of mangrove land cover
Mangrove land cover reduction was determined by overlaying the 2006 (oldest) and 2020 (most recent) mangrove land cover maps. Any detected addition to the mangrove area was categorized into the no-reduction class. Changes in mangrove land cover are presented in Figure 12. A decrease in mangrove covers was scattered in the north and south, and the total area of reduction is shown in Table 17. These mangrove cover dynamics can be related to Cempaka Tropical Cyclone on November 22, 2017, and a flash flood on November 28, 2017, that hit Pacitan Bay, changing the river and land morphology at the bay.
Table 17. Mangrove losses and their respective areas
|
Mangrove Loss |
Area (Ha) |
|
Area Reduction |
0.702 |
|
No Area Reduction |
2.661 |
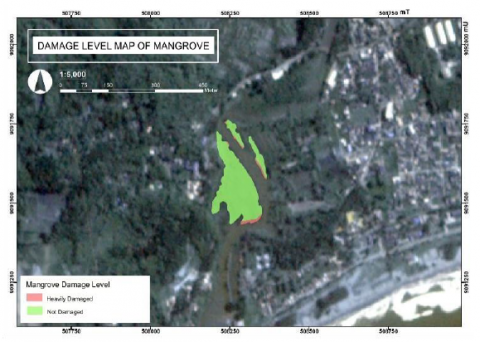
3.4.2 Mangrove damage levels
The model of the mangrove damage level was built by overlaying several parameters: land-use type, canopy density, and soil resistance to abrasion. The modeling results are presented in Figure 13.
A small part of the mangrove forest area, about 0.119 ha, was severely or heavily damaged (Table 18). It is located in the southern part (west of the river) and the southwestern part of the mangrove area (east of the river). Here, the mangroves had a low canopy density, which can be attributed to the age of mangrove plants, i.e., young or at the development stage to maturity. Being directly adjacent to the river, these young mangroves are exposed to river dynamics. For instance, the water level rise following a heavy can submerge these mangroves—mangroves can grow the water conditions only inundate the roots not submerge the trees.
Figure 12. Mangrove degradation map in 2006‒2020
Table 18. Mangrove damage levels and their respective areas
|
Mangrove Damage Level |
Area (Ha) |
|
Heavily Damaged |
0.119 |
|
Not Damaged |
2.55 |
Figure 13. Map of mangrove damage levels
Figure 14. Map of river and beach buffer zones
3.4.3 Beach and River Buffer Zones
Data on the beach and river buffers (beach ridge and riparian zone), as presented in Figure 14 and Table 19, were obtained through visual interpretation of the 2020 PlanetScope imagery. In spatial planning, these buffers are part of the local protected areas; therefore, the permitted uses are only those related to the provision of green open space.
Table 19. Buffer zones and their respective areas
|
Buffer Zone |
Area (Ha) |
|
Non-Buffer Zone |
549.44 |
|
Buffer Zone |
190.72 |
3.4.4 Land suitability and potential for mangroves
The land suitability model for mangroves was generated by overlaying several parameters: landform, slope, soil texture, tides, and land use. The lands with potential for mangrove growth and development based on the suitability model are presented in Figure 15. Their respective areas are presented in Table 20.
Table 20. Land potentials for mangroves based on suitability results and their respective areas
|
Land Potentials |
Area (Ha) |
|
Highly Potential |
14.472 |
|
Potential |
583.929 |
|
Less Potential |
97.189 |
|
Not Potential |
23.881 |
Figure 15. Distribution of land potentials for mangroves based on the suitability results
Mangrove forests in Southeast Asia, including Indonesia, can be found in areas associated with shrimp ponds (aquaculture). For this reason, previous research found indications of mangrove deforestation and environmental degradation. As an example, the regulations in Yogyakarta and Central Java, regulations that are not firmly applied, and when coupled with the high market demand for shrimp, it encourages the governments to choose between economic growth and environmental sustainability [22].
However, shrimp farming benefits from the existence of mangroves. Mangrove ecosystems indirectly play a role in providing habitats that can increase production stability and minimize diseases in shrimp. Shrimp farmers who understand this beneficial relationship should take part in preserving the mangrove forest ecosystem, particularly because it is profitable in the long term and allows farmers to harvest the wood selectively.
In this research, the mangrove land suitability shows that the lands suitable and, thus, potential for mangroves are evenly distributed throughout the study area. The closer the land to the river and the beach, the lower the land suitability for mangroves. The mangrove-suitable land is spread unevenly along the river in coastal alluvial plains, alluvial plains, and flood plains. The existence of mangroves in some part of the study area adds to the land suitability because the established habitat or condition indicates and allows for mangrove development. Further, a developed mangrove ecosystem was found west of the river, and this area can be designated for conservation activities, including mangrove planting and development.
3.5 Mangrove conservation priority
Mangrove conservation priority was based on the model that overlaid mangrove damage level, parameters contributing to mangrove land cover reduction, beach and river boundaries, and land potential for mangroves. The derived mangrove conservation priorities are presented in Figure 16. Most of the existing mangroves in the Teleng River are designated for conservation with Priority 2 (Table 21), which highlights controlled mangrove use or the combination of mangrove and non-mangrove spatial use where the latter is conducted at a lower intensity than the former. Priority 1 includes mangroves in the outermost part, which are relatively young and have less stable roots, whereas Priority 2 is for relatively more mature mangroves.
Mangrove forest ecosystems are located in relatively small choppy areas or are protected from large and strong waves and influenced by tides and freshwater input from the land; therefore, rivers play an essential role in supporting mangrove growth. Various mangrove species have different adaptability to certain inundation conditions and salinity [23]. For example, Rhizopora and Bruguiera dominate in areas with a lot of fresh water supply and low water salinity, while Avicennia cannot grow in these conditions [24].
The causes of damage to mangrove ecosystems include illegal logging [25] and conversion into settlements and fish ponds [26]. Mangrove forests susceptible to conversion into other uses are located near settlements and rivers where land clearing activities are carried out through waterways [27]. Coastal areas that meet the requirements for mangrove growth need to be conserved and developed as protected areas [28, 29]. Incorporating prohibition zones into spatial planning to forbid all forms of activities that disturb mangrove ecosystems is a form of government's commitment to maintaining the ecological function of mangroves [30].
There has been no other research scrutinizing mangrove conservation in Pacitan Bay because Casuarina equisetifolia trees have been planted as part of disaster mitigation measures in this pocket beach; therefore, this research can be used as an initial reference in mangrove conservation in the bay, especially the existing mangroves on the Teleng River that create a barrier against tsunami waves that propagate through the river mouth. Another research [31] has planned mangrove rehabilitation strategies using several parameters, namely mangrove density (obtained from NDVI), mangrove habitat distribution (obtained from land systems and geomorphology), and area functions. Rehabilitation was proposed for areas with dense mangroves and unproductive land in the mangrove habitat. Unproductive land means any land suitable for mangrove growth that is currently occupied by non-mangrove objects. Rehabilitation efforts were carried out based on a priority scale through enrichment and planting of local species in the entire prioritized areas.
Several other actions that need to be taken in the future include evaluating the land suitability in the mangrove rehabilitation area, including what types of mangrove species that are suitable for planting in said area [32]. It is essential to evaluate the carrying capacity of the environment on a regular basis and, if necessary, re-zone the observed areas to reduce the risk of pond expansion and accommodate the interests of the local community around the mangrove. Land suitability for mangrove conservation uses parameters of important value for species, mangrove species, mangrove density and thickness, main substrate, tides, pH, current velocity, and salinity [25]. If the mangrove cover grows more extensively and there is a demand for tourism, a study on the suitability of mangrove tourism can also be carried out by making a mangrove tourism suitability index consisting of mangrove thickness, mangrove density, mangrove species, tides, accessibility, flora and fauna characteristics, and area characteristics.
Table 21. Mangrove conservation priorities and their respective areas
|
Mangrove Conservation Priority |
Area (Ha) |
|
Priority 1 |
0.119 |
|
Priority 2 |
2.558 |
Figure 16. Mangrove conservation priority map
The dynamics of mangrove cover in Pacitan Bay are influenced by the Cempaka Tropical Cyclone on November 22, 2017, and the flash flood on November 28, 2017, which changed the morphology of the river and bay. Mangrove forests with a high damage level are located in the south and southwest. Mangroves in the study area have a low canopy density because of the age of the mangrove trees, which are still young and, thus, have less strong roots to withstand river currents. Mangrove conservation in Pacitan Bay is divided into two priorities, namely Priority I, emphasizing mangrove protection and preservation activities, such as planting new seeds (rehabilitation), and Priority 2 (dominant class), which concerns more on the controlled use of mangroves or the combination of mangrove and non-mangrove spatial use at low intensity. Furthermore, lands with high potential for mangrove growth and development need to be designated as a local protection zone and prioritized in the rehabilitation program (planting new mangrove seedlings) as an effort to mitigate the impact of tsunamis. Further research can be directed at evaluating the land suitability for mangrove rehabilitation, monitoring the use of mangroves for local communities, and modeling the effect of mangroves on the propagation of tsunami waves through rivers in Pacitan Bay.
This research was funded by the Faculty of Geography, Gadjah Mada University, through the Independent Grant Scheme 2020 (Dean's Decree No: 1291/UN1/FGE/KPT/SETD/2020). The authors would like to thank Yanuar Sulistyaningrum, S.Pd., M.Sc., for her assistance in research administration.
[1] Lewis III, R.R. (2005). Ecological engineering for successful management and restoration of mangrove forests. Ecological Engineering, 24(4): 403-418. https://doi.org/10.1016/j.ecoleng.2004.10.003
[2] Wicaksono, P., Danoedoro, P., Hartono, Nehren, U. (2016). Mangrove biomass carbon stock mapping of the Karimunjawa Islands using multispectral remote sensing. International Journal of Remote Sensing, 37(1): 26-52. https://doi.org/10.1080/01431161.2015.1117679
[3] Wardhani, M.K. (2011). Kawasan konservasi mangrove: Suatu potensi ekowisata. Jurnal Kelautan, 4(1): 60-76. https://doi.org/10.21107/jk.v4i1.891
[4] FAO. (2007). The world's mangrove 1980–2005: A thematic study prepared in the framework in the Global Forest Resources Assessment 2005. Rome: Food and Agriculture Organization of the United Nations.
[5] Schaduw, J.N.W. (2019). Struktur komunitas dan persentase penutupan kanopi mangrove pulau salawati kabupaten kepulauan raja ampat provinsi papua barat. Majalah Geografi Indonesia, 33(1): 26-34. https://doi.org/10.22146/mgi.34745
[6] Ong, J.E., Gong, W.K. (2013). Structure, function and management of mangrove ecosystems. ISME Mangrove Educational Book Series No. 2. International Society for Mangrove Ecosystems (ISME), Okinawa, Japan, and International Tropical Timber Organization (ITTO), Yokohama, Japan.
[7] Kamali, B., Hashim, R. (2011). Mangrove restoration without planting. Ecological Engineering, 37(2): 387-391. https://doi.org/10.1016/j.ecoleng.2010.11.025
[8] Hessel, R., Berg, J.V.D., Kaborec, O., Kekem, A.V., Verzanvoort, S., Dipama, J., Diallo, B. (2009). Linking participatory and GIS-based land use planning methods: A case study from Burkina Faso. Land Use Policy, 26(4): 1162-1172. https://doi.org/10.1016/j.landusepol.2009.02.008
[9] Hirata, Y., Tabuchi, R., Patanaponpaiboon, P., Poungparn, S., Yoneda, R., Fujioka, Y. (2014). Estimation of aboveground biomass in mangrove forests using high-resolution satellite data. Journal of Forest Research, 19(1): 34-41. https://doi.org/10.1007/s10310-013-0402-5
[10] Zhu, Y., Liu, K., Liu, L., Myint, S.W., Wang, S., Liu, H., He, Z. (2017). Exploring the potential of WorldView-2 red-edge band-based vegetation indices for estimation of mangrove leaf area index with machine learning algorithms. Remote Sensing, 9(10): 1060. https://doi.org/10.3390/rs9101060
[11] Winarso, G., Purwanto, A.D. (2014). Evaluation of mangrove damage level based on Landsat 8 image. International Journal of Remote Sensing and Earth Sciences, 11(2): 105-116. https://doi.org/10.30536/j.ijreses.2014.v11.a2608
[12] Umroh, Adi, W., Sari, S.P. (2016). Detection of mangrove distribution in Pongok Island. Procedia Environmental Sciences, 33: 253-257. https://doi.org/10.1016/j.proenv.2016.03.076
[13] Purwanto, A.D., Asriningrum, W., Winarso, G., Parwati, E. (2014). Analisis Sebaran dan Kerapatan Mangrove Menggunakan Citra Landsat 8 di Segara Anakan, Cilacap. Seminar Nasional Penginderaan Jauh 2014. Jakarta: Lapan, 12(1): 232-241.
[14] Purwanto, A.D., dan Asriningrum, W. (2019). Identification of mangrove forests using multispectral satellite imageries. International Journal of Remote Sensing and Earth Sciences, 16(1): 63-86. https://doi.org/10.30536/j.ijreses.2019.v16.a3097
[15] Sulong, I., Mohd-Lokman, H., Mohd-Tarmizi, K., Ismail, A. (2002). Mangrove mapping using landsat imagery and aerial photographs: Kemaman District, Trengganu, Malaysia. Environment, Development and Sustainability, 4: 135-152. https://doi.org/10.1023/A:1020844620215
[16] Kamal, M. (2015). Remote sensing for multi-scale mangrove mapping. Thesis. Queensland: School of Geography, Planning and Environmental Management, University of Queensland.
[17] Heenkenda, M.K., Joyce, K.E., Maier, S.W., Bartolo, R. (2014). Mangrove species identification: Comparing WorldView-2 with aerial photographs. Remote Sensing, 6: 6064-6088. https://doi.org/10.3390/rs6076064
[18] Xia, Q., Qin, C., Li, H., Huang, C., Su, F. (2018). Mapping mangrove forests based on multi-tidal high-resolution satellite imagery. Remote Sensing, 10(9): 1-20. https://doi.org/10.3390/rs10091343
[19] Green, E.P., Clark, C.D., Mumby, P.J., Edwards, A.J., Ellis, A.C. (1998). Remote sensing techniques for mangrove mapping. International Journal of Remote Sensing, 19(5): 935-956. https://doi.org/10.1080/014311698215801
[20] Giri, C. (2016). Remote Sensing of Mangrove Wetlands. In Remote Sensing Handbook Volume 3: Remote Sensing of Water Resources, Disasters, and Urban Studies (Thenkabail, P.S). Boca Raton: CRC Press.
[21] Purwanto, A.D., Ardli, E.R. (2020). Development of a simple method for detecting mangrove using free open source software. Jurnal Segara, 16(2): 71-82. http://dx.doi.org/10.15578/segara.v16i2.7512
[22] Armitage, D., Johnson, D. (2006). Can resilience be reconciled with globalization and the increasingly complex conditions of resource degradation in Asia coastal regions? Ecology and Society, 11(2): 1-19.
[23] Poedjirahajoe, E. (2007). Dendrogram Zonasi Pertumbuhan Mangrove Berdasarkan Habitatnya Di Kawasan Rehabilitasi Pantai Utara Jawa Tengah Bagian Barat. Jurnal Ilmu Kehutanan, 1(2): 10-21. https://doi.org/10.22146/jik.1551
[24] Irpan, F.B., Manurung, T.F., Muflihati. (2017). Komposisi dan Struktur Vegetasi Penyusun Zonasi Hutan Mangrove Tanjung Prapat Muda, Tanjung Bakau, Kabupaten Kubu Raya. Jurnal Hutan Lestari, 5(1): 104-112.
[25] Sulistyorini, I.S., Poedjirahajoe, E., Faida, L.R.W., Purwanto, R.H. (2018). Analisis Kesesuaian Lahan bagi Konservasi Mangrove Berdasarkan Daya Dukung Lingkungan (Kasus: Teluk Lombok Taman Nasional Kutai, Kalaimantan Timur, Indonesia). Prosiding Seminar Nasional Membangun Hutan sebagai Ekosistem Unggul Berbasis DAS: Jaminan Produksi, Pelestarian, dan Kesejahteraan 2018. Yogyakarta: Fakultas Kehutanan Universitas Gadjah Mada dan Direktorat Jenderal Pengelolaan DAS dan Hutan Lindung Kementerian Lingkungan Hidup dan Kehutanan, 86-93.
[26] Kunarso, A., Tubagus A.A., Syabana, F., Azwar, Bastoni. (2015). Mangrove rehabilitation using Silvofishery system in Telang protection forest, south Sumatra: Opportunities and challenges. Proceedings: The International Conference of Indonesia Forestry Researchers III. Bogor, 21-22 October 2015.
[27] Budiarsa, A.A., dan S. Rizal. (2013). Pemetaan dan Analisis Tingkat Kerusakan Hutan Mangrove di Taman Nasional Kutai Berdasarkan Data Citra Setelit Landsat ETM dan Kerapatan Vegetasi. Jurnal Ilmu Perikanan Tropis., 19(1): 5461.
[28] Suprakto, B., Soemarno, Marsoedi, Arfiati, D. (2014). Development of mangrove conservation area based on land suitability and environmental carrying capacity (Case study from Probolinggo Coastal Area, East Java, Indonesia). International Journal of Ecosystem, 4(3): 107-118. https://doi.org/10.5923/j.ije.20140403.02
[29] Hakim, L., Siswanto, D., Nakagoshi, N. (2017). Mangrove conservation in East Java: The ecotourism development perspectives. The Journal of Tropical Life Science, 7(2): 277-285. http://dx.doi.org/10.11594/jtls.07.03.14
[30] Lukman, K.M., Quevedo, J.M.D., Kakinuma, K., Uchiyama, Y., Kohsaka, R. (2019). Indonesia Provincial Spatial Plans on mangroves in era of decentralization: Application of content analysis to 27 provinces and “blue carbon” as overlooked components. Journal of Forest Research, 24(6): 341-348. https://doi.org/10.1080/13416979.2019.1679328
[31] Rusdiyatmoko, A. (2015). Perencanaan Rehabilitasi Mangrove Menggunakan Citra MODIS di Kecamatan Kumai, Kalimantan Tengah. In Bab 14 Bunga Rampai Mangrove: Citra Penginderaan Jauh dan Identifikasinya. Jakarta: Lembaga Penerbangan dan Antariksa Nasional.
[32] Nurlailita. (2015). Evaluasi Kesesuaian Lahan Areal Rehabilitasi Mangrove di Kecamatan Birem Bayeum dan Kecamatan Rantau Selamat, Aceh Timur. Thesis. Bogor: Pascasarjana Institut Pertanian Bogor.