Gian Marco Contessa* | Nadia Cherubini | Giada Gandolfo | Luigi Lepore | Giuseppe A. Marzo | Romolo Remetti
© 2021 IIETA. This article is published by IIETA and is licensed under the CC BY 4.0 license (http://creativecommons.org/licenses/by/4.0/).
OPEN ACCESS
Portable neutron generators are one of the most widespread sources of fast neutrons for different applications, from activation analysis to quantitative estimation of fissile and fertile materials in radioactive waste packages. New techniques based on these devices have been developed for homeland security, e.g. neutron interrogations of packages suspected of containing substances such as explosives.
When using portable generators determination of radiation protection quantities is affected by a series of boundary conditions that could differ from an experimental set-up to another, and Radiation Protection Experts cannot assess operator exposure without the aid of time-expensive Monte Carlo simulations. As it is impossible to foresee all kind of scenarios involving such applications, and time is often a critical variable, safety assessment requires faster, even if less accurate, tools for exposure evaluation.
In this article experimental measurements of dose rates in a real scenario involving a D-T neutron generator are considered, to validate the Monte Carlo model developed.
Consequently, it was possible to demonstrate that the calibration factor at 14 MeV for a neutron dosimeter provides conservative dose estimates and to propose a stand-alone, fast, and easy-to-use calculation tool which is usable on field by the Radiation Protection Expert without full Monte Carlo calculations.
Monte Carlo simulation, neutron dosimeter, neutron generator, occupational safety
Portable neutron generators are one of the most widespread sources of fast neutrons for different kind of analytical applications, ranging from classic activation analysis [1] to the quantitative estimation of the fissile and fertile materials in radioactive waste packages [2, 3]. Recently, new techniques based on neutron generators have been developed for homeland security, for instance neutron interrogations of containers suspected of containing illicit substances, such as explosives or drugs [4-6].
Current research activities carried out at ENEA involve neutron generators applications for Differential Die Away-time Analysis (DDAA) [7, 8], fissile and fertile recognition and quantification [9, 10], and Fast Neutron Analysis [4, 11] for explosive detection. As such techniques require fast neutrons mainly, the generator is used unshielded, inside an appropriate bunker or, when necessary, in open field situations. Under these conditions, the neutron flux and its energy spectrum at the point of interest is strictly dependent on the generator emission and the surrounding environment.
Neutron radiation field dosimeters are commonly based on the classical Andersson-Braun rem-meter [12]. A thermal neutron detector, typically a proportional counter tube filled with 3He, is inserted inside a moderator with material and geometry properly chosen for obtaining a response function which reproduces the variation of the neutron fluence to dose equivalent conversion coefficient against the energy. Original design was based on the old concept of maximum dose equivalent, but the transition to the current ambient dose equivalent H*(10) did not require substantial modifications [13].
Ideal neutron dosimeters should have a response, per unit dose equivalent, that is independent of neutron energy, but devices currently available are far from being ideal. The 3He(n,p)3H cross section varies from about 5400 barn at thermal energies to about 1 barn at 1 MeV and 0.2 barn at 10 MeV. Moreover, as neutron energy increases in the MeV region, the cross section of the elastic scattering of 3He nuclei becomes more and more important, and corresponding voltage pulses interfere with those ones produced by the (n,p) reaction. In summary, the count rate of uncharacterized neutron fields cannot directly be correlated with neutron dose, unless special detector design and fast electronics, capable to discriminate the 3He recoil pulses, are available. Special application for accelerator facilities have been developed for neutrons up to hundred MeV, as described by Jagerhofer et al. [14, 15] but conventional rem-meters give satisfactory estimation of H*(10) in the 100 keV - 6 MeV energy range only [13].
A very interesting work by Kim et al. [16] compares six commercial rem-meters, Berthold LB6411, FHT762 WENDI-2, NRD-9, SNOOPY NP-2, DINEUTRON, and REM-500, and gives evidence of substantial dose underestimation for neutron energies in the 10 MeV region.
As a general recommendation, rem-meters should be calibrated in a spectrum which is either similar to the one of the environment of interest or giving at least similar calibration factors [17], but usually the calibration procedures are carried out by putting radionuclide sources such as 252Cf, or 241Am-Be near the detector and minimizing the so-called “room return”, i.e. thermal neutrons scattered from the environment and entering the counter. Due to high (n,p) reaction cross section at thermal energies, room return scattering, in real situations, can significantly affect H*(10) evaluation.
When using commercial rem-counters such as the Berthold LB6411, the user can choose to modify default setting previously obtained by 252Cf calibration simply multiplying the neutron count rate by proper conversion factors, which, obviously, vary with neutron energy. Choosing the right conversion factors requires proper characterization of neutron spectrum at the point of interest, and this is generally obtained by means of preliminary Monte Carlo calculations which consider also the environment where the measurement is performed, so as to account for the room return scattering. Nevertheless, when prompt evaluations are required, as when using D-T neutron generators for homeland security, preliminary Monte Carlo calculations are not suitable. Here, evidence will be provided that conservative evaluation of the ambient dose equivalent H*(10) can be obtained by using conversion factors at 14 MeV both for open-field situations or confined geometries.
The neutron generator considered in this work is the D-T Thermo Scientific MP-320. This system is very compact, portable and light in weight. It is based on a deuterium-tritium sealed source and is designed for laboratory and field applications. It generates a maximum of 108 s-1 neutron emission and is capable of continuous or pulsed output, the latter ranging from 500 Hz to 20 kHz. More details about the device and its capabilities can be found in ref. [18, 19].
The rem-meter Berthold LB6411 consists of a polyethylene (PE) moderator sphere (250 mm diameter) with a composite 3He recoil proton proportional counter tube at its center. The instrument is calibrated with the fission spectrum of 252Cf showing a “fluence response” of 1.09 cm2 and 1.27 µSv h-1 cps-1 “dose calibration factor”. The dose calibration factor is the conversion coefficient between ambient dose equivalent H*(10) rate and neutron count rate. Table 1 gives its variation vs. energy in the 0.1 MeV - 14 MeV region.
The manufacturer assumes 1.27 µSv h-1 cps-1 cps-to-dose conversion coefficient as default value, whatever the neutron energy spectrum monitored. This is obtained by 252Cf calibration in free air, without any assumption on room return scattering. Consequently, the H*(10) rate shown on the instrument display is always relative to it. When different neutron spectra are involved, the User’s Manual advises the user to calculate the H*(10) rate by multiplying the measured neutron count-rate by a proper conversion coefficient as in Table 1. Listed coefficients cover the region 0.001 eV - 20 MeV [20].
However, in order to choose the best conversion coefficient, it is necessary to know the actual neutron energy distribution.
Currently, the most efficient method for simulating neutron radiation fields is the Monte Carlo simulation. Monte Carlo approach consists in generating several independent particles and follow each one through all their possible paths (each path is called “particle history”). Then, all the histories are tallied to provide the physical dimension of interest. This is obtained by means of random samplings from all the probability density functions ruling the involved physical phenomena. Very complex geometries can be reproduced, and high accurate results can be obtained. As regards calculation precision, a sufficient computational power should be available for running a statistically significant number of histories within an acceptable time interval. In this work the MCNPX (Monte Carlo N-Particle eXtended) code has been used, in its version MCNPX 2.7.0. An accurate MCNPX model of the MP-320 neutron generator was adopted [21].
Table 1. Variation vs. neutron energy of conversion coefficient between H*(10) rate and count rate
|
Energy [MeV] |
Dose Calibration Factor [µSv (h cps)-1] |
Δ% respect to 252Cf 1.27 µSv (h cps)-1 |
Δ% respect to 241Am-Be 1.21 µSv (h cps)-1 |
|
0.1 |
1.62 |
27.6 |
33.9 |
|
1.0 |
1.34 |
5.5 |
10.7 |
|
2.0 |
1.06 |
-16.5 |
-12.4 |
|
5.0 |
1.04 |
-18.1 |
-14.0 |
|
10.0 |
1.67 |
31.5 |
38.0 |
|
14.0 |
2.46 |
93.7 |
103.3 |
Figure 1. MCNPX-3D-view (left) and MCNPX-horizontal cross-section (right) of the neutron bunker. The neutron generator is in green
In order to test the neutron generator Monte Carlo model, measurements of the neutron emission were carried out in a neutron bunker. The building is shown in Figure 1. The main room is 4 m large, 8 m deep and 3 m high, and the antechamber is 4 m large, 4 m deep and 3 m high. All walls and ceilings are 30 cm thick concrete slabs, while concrete basement is assumed to be 60 cm thick, lying on a terrain bank. A metal fence defines a 3 m respect area from each external walls of the building.
Preliminary to measurements, an accurate model of the building was reproduced in the Monte Carlo simulation. The neutron generator model included in the simulation was derived by Remetti et al. [21]. The simulation of the Berthold LB6411 neutron counter was carried out including its response-curves, taken from the device manual, as multiplicative factors to be used to convert the neutron fluxes in Monte Carlo calculations.
The Monte Carlo model has been used also for radiation protection purposes and different simulations that have been run to assess the exposures of people in the bunker main room, in the antechamber, and outside.
In such a context, a fundamental phase of the work was the Monte Carlo characterization of the neutron radiation field at different positions inside the bunker main room, to evaluate the “quality” of neutron spectra and choose the adequate cps-to-dose conversion coefficient.
3.1 Measurement campaign and Monte Carlo simulations of the bunker
A measurement campaign has been carried out at specific positions inside a neutron bunker by recording the experimental count rates for 15 seconds live-time; uncertainties have been calculated by applying 1-sigma-Poisson statistics. For each measurement the corresponding MCNPX simulation was carried out.
A 1 m squared-mesh grid was identified in the bunker main room, and 21 positions have been defined, as shown in Figure 1. Each position is numbered with an [i,j] index, “i” standing for the row, and “j” for the column. Position [4,2] corresponds to the center of the room.
During a first set of measurements, the neutron generator was maintained at [i,j]=[1,2] position, i.e. the bottom wall of the neutron bunker, and at its minimum power, set at 40 kV accelerator voltage, 20 µA deuteron beam, 500 Hz frequency, and 10% duty factor, for a minimum neutron yield in 106 s-1.
The rem-counter was sequentially placed at the remaining 20 positions. For each one of the 20 positions, the neutron count rate was measured by Berthold LB6411, and the corresponding MCNPX simulation was carried out.
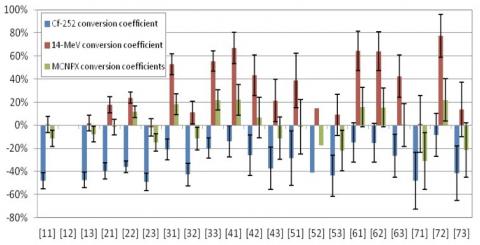
Table 2 compares, for each [i,j] position, the H*(10) rate obtained by MCNPX calculations, the experimental neutron count rate recorded by the rem-counter, and the H*(10) rates obtained by multiplying the count rate by the following three different conversion values:
The same data are represented in Figure 2.
It is evident that significant dose rate underestimations could happen when the Berthold LB6411 count-rate to dose-rate default conversion coefficient is used.
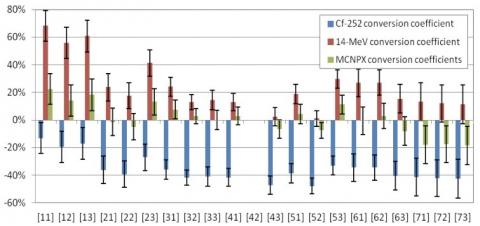
Table 3 and Figure 3 show the results of a second set of measurements obtained by placing the neutron generator at [i,j] =[4,2] position, i.e. at the center of the room. Also in this case, significant dose rate underestimations could happen when the Berthold LB6411 count-rate to dose-rate default-value, 1.27 µSv h-1 cps-1, is used.
In particular, averaged underestimation of about 32% are obtained for the first set of measurements, and about 36% for the second one.
The 14 MeV conversion coefficient, 2.46 µSv h-1 cps-1, produces conservative results at each position, overestimating of about 31% for the first set of measurements and 24% for the second one. In both cases the MCNPX-weighted coefficient produces both underestimations or overestimations, the averaged deviation being about 1%.
Table 2. Dose rates calculated with the MCNPX model for the neutron bunker vs. experimental values (neutron generator near a wall)
|
Probe position [i; j] |
MCNPX calculated H*(10) [µSv h-1] |
Measured count rate [cps] |
H*(10) with default conversion coefficient 252Cf [µSv h-1] |
H*(10) with 14 MeV conversion coefficient [µSv h-1] |
MCNPX-weighted conversion coefficient [µSv (h cps)-1] |
H*(10) with MCNPX-weighted conversion coefficient [µSv h-1] |
|
[1,1] |
32.8 |
13.4 |
17.0 $(\pm 7 \%)$ |
33.0 $(\pm 7 \%)$ |
2.17 |
29.1 $(\pm 7 \%)$ |
|
[1,2] |
neutron generator position |
|||||
|
[1,3] |
34.0 |
14.1 |
17.9 $(\pm 7 \%)$ |
34.6 $(\pm 7 \%)$ |
2.23 |
31.4 $(\pm 7 \%)$ |
|
[2,1] |
28.6 |
13.7 |
17.4 $(\pm 7 \%)$ |
33.6 $(\pm 7 \%)$ |
2.06 |
28.2 $(\pm 7 \%)$ |
|
[2,2] |
55.6 |
28.0 |
35.6 $(\pm 5 \%)$ |
68.9 $(\pm 5 \%)$ |
2.22 |
62.2 $(\pm 5 \%)$ |
|
[2,3] |
29.6 |
11.8 |
15.0 $(\pm 8 \%)$ |
29.1 $(\pm 8 \%)$ |
2.13 |
25.2 $(\pm 8 \%)$ |
|
[3,1] |
13.3 |
8.3 |
10.5 $(\pm 9 \%)$ |
20.4 $(\pm 9 \%)$ |
1.90 |
16.7 $(\pm 9 \%)$ |
|
[3,2] |
15.7 |
7.1 |
9.0 $(\pm 10 \%)$ |
17.4 $(\pm 10 \%)$ |
1.96 |
13.9 $(\pm 10 \%)$ |
|
[3,3] |
13.5 |
8.5 |
10.8 $(\pm 9 \%)$ |
21.0 $(\pm 9 \%)$ |
1.93 |
16.5 $(\pm 9 \%)$ |
|
[4,1] |
7.5 |
5.1 |
6.5 $(\pm 11 \%)$ |
12.5 $(\pm 11 \%)$ |
1.80 |
9.2 $(\pm 11 \%)$ |
|
[4,2] |
8.1 |
4.7 |
6.0 $(\pm 12 \%)$ |
11.6 $(\pm 12 \%)$ |
1.83 |
8.6 $(\pm 12 \%)$ |
|
[4,3] |
7.5 |
3.7 |
4.7 $(\pm 13 \%)$ |
9.1 $(\pm 13 \%)$ |
1.80 |
6.7 $(\pm 13 \%)$ |
|
[5,1] |
4.8 |
2.7 |
3.5 $(\pm 16 \%)$ |
6.7 $(\pm 16 \%)$ |
1.75 |
4.8 $(\pm 16 \%)$ |
|
[5,2] |
5.0 |
2.3 |
3.0 $(\pm 17 \%)$ |
5.8 $(\pm 17 \%)$ |
1.77 |
4.1 $(\pm 17 \%)$ |
|
[5,3] |
4.8 |
2.1 |
2.7 $(\pm 18 \%)$ |
5.3 $(\pm 18 \%)$ |
1.76 |
3.8 $(\pm 18 \%)$ |
|
[6,1] |
3.4 |
2.3 |
2.9 $(\pm 17 \%)$ |
5.6 $(\pm 17 \%)$ |
1.73 |
4.0 $(\pm 17 \%)$ |
|
[6,2] |
3.5 |
2.3 |
3.0 $(\pm 17 \%)$ |
5.8 $(\pm 17 \%)$ |
1.73 |
4.0 $(\pm 17 \%)$ |
|
[6,3] |
3.4 |
2.0 |
2.5 $(\pm 18 \%)$ |
4.9 $(\pm 18 \%)$ |
1.73 |
3.4 $(\pm 18 \%)$ |
|
[7,1] |
2.7 |
1.0 |
1.4 $(\pm 25 \%)$ |
2.7 $(\pm 25 \%)$ |
1.69 |
1.8 $(\pm 25 \%)$ |
|
[7,2] |
2.7 |
2.0 |
2.5 $(\pm 18 \%)$ |
4.8 $(\pm 18 \%)$ |
1.69 |
3.3 $(\pm 18 \%)$ |
|
[7,3] |
2.6 |
1.2 |
1.5 $(\pm 24 \%)$ |
3.0 $(\pm 24 \%)$ |
1.70 |
2.0 $(\pm 24 \%)$ |
Figure 2. Neutron generator near a wall. Deviations from Berthold LB6411's dose rates vs. MCNPX dose rates
Figure 3. Neutron generator at the center of the room. Deviations from Berthold’s dose rates vs. MCNPX dose rates
Table 3. Dose rate calculated with MCNPX model for the bunker vs. experimental values (neutron generator at center)
|
Probe position [i; j] |
MCNPX calculated H*(10) [µSv h-1] |
Measured count rate [cps] |
H*(10) with default conversion coefficient 252Cf [µSv h-1] |
H*(10) with 14 MeV conversion coefficient [µSv h-1] |
MCNPX-weighted conversion coefficient [µSv (h cps)-1] |
H*(10) with MCNPX-weighted conversion coefficient [µSv h-1] |
|
[1,1] |
7.9 |
5.4 |
6.9 $(\pm 11 \%)$ |
13.3 $(\pm 11 \%)$ |
1.79 |
9.7 $(\pm 11 \%)$ |
|
[1,2] |
8.2 |
5.2 |
6.6 $(\pm 11 \%)$ |
12.8 $(\pm 11 \%)$ |
1.80 |
9.4 $(\pm 11 \%)$ |
|
[1,3] |
7.7 |
5.0 |
6.4 $(\pm 12 \%)$ |
12.4 $(\pm 12 \%)$ |
1.81 |
9.1 $(\pm 12 \%)$ |
|
[2,1] |
13.3 |
6.7 |
8.5 $(\pm 10 \%)$ |
16.4 $(\pm 10 \%)$ |
1.96 |
13.1 $(\pm 10 \%)$ |
|
[2,2] |
15.3 |
7.3 |
9.3 $(\pm 10 \%)$ |
18.0 $(\pm 10 \%)$ |
1.99 |
14.6 $(\pm 10 \%)$ |
|
[2,3] |
13.0 |
7.5 |
9.5 $(\pm 9 \%)$ |
18.4 $(\pm 9 \%)$ |
1.97 |
14.7 $(\pm 9 \%)$ |
|
[3,1] |
28.1 |
14.2 |
18.0 $(\pm 7 \%)$ |
34.9 $(\pm 7 \%)$ |
2.13 |
30.2 $(\pm 7 \%)$ |
|
[3,2] |
50.6 |
23.2 |
29.5 $(\pm 5 \%)$ |
57.1 $(\pm 5 \%)$ |
2.24 |
52.0 $(\pm 5 \%)$ |
|
[3,3] |
28.4 |
13.2 |
16.8 $(\pm 7 \%)$ |
32.5 $(\pm 7 \%)$ |
2.15 |
28.4 $(\pm 7 \%)$ |
|
[4,1] |
35.7 |
16.4 |
20.8 $(\pm 6 \%)$ |
40.3 $(\pm 6 \%)$ |
2.24 |
36.7 $(\pm 6 \%)$ |
|
[4,2] |
neutron generator position |
|||||
|
[4,3] |
36.1 |
15.0 |
19.1 $(\pm 7 \%)$ |
36.9 $(\pm 7 \%)$ |
2.25 |
33.8 $(\pm 7 \%)$ |
|
[5,1] |
28.4 |
13.7 |
17.4 $(\pm 7 \%)$ |
33.7 $(\pm 7 \%)$ |
2.16 |
29.6 $(\pm 7 \%)$ |
|
[5,2] |
50.4 |
20.7 |
26.3 $(\pm 6 \%)$ |
50.9 $(\pm 6 \%)$ |
2.25 |
46.6 $(\pm 6 \%)$ |
|
[5,3] |
27.7 |
14.6 |
18.5 $(\pm 7 \%)$ |
35.9 $(\pm 7 \%)$ |
2.11 |
30.8 $(\pm 7 \%)$ |
|
[6,1] |
13.0 |
6.7 |
8.5 $(\pm 10 \%)$ |
16.5 $(\pm 10 \%)$ |
1.93 |
12.9 $(\pm 10 \%)$ |
|
[6,2] |
15.3 |
7.9 |
10.0 $(\pm 9 \%)$ |
19.4 $(\pm 9 \%)$ |
1.99 |
15.7 $(\pm 9 \%)$ |
|
[6,3] |
13.3 |
6.2 |
7.9 $(\pm 10 \%)$ |
15.3 $(\pm 10 \%)$ |
1.96 |
12.2 $(\pm 10 \%)$ |
|
[7,1] |
7.7 |
3.5 |
4.5 $(\pm 14 \%)$ |
8.7 $(\pm 14 \%)$ |
1.78 |
6.3 $(\pm 14 \%)$ |
|
[7,2] |
8.2 |
3.7 |
4.7 $(\pm 13 \%)$ |
9.2 $(\pm 13 \%)$ |
1.81 |
6.8 $(\pm 13 \%)$ |
|
[7,3] |
7.5 |
3.4 |
4.3 $(\pm 14 \%)$ |
8.4 $(\pm 14 \%)$ |
1.80 |
6.1 $(\pm 14 \%)$ |
3.2 Simulated building scenarios
Having found a good agreement between experimental and simulated results, MCNPX was also utilized as a tool for radiation protection considerations inside two typical industrial buildings of larger dimensions than those of the bunker, which can be potential scenarios for homeland security applications.
Hence, simulations of two typical industrial buildings have been conducted for homeland security applications:
Four sets of simulations have been carried out by combining those two geometries with two different positions for the neutron generator, one at room-center, the other near a perimetric wall. In both geometries considered, 1 m squared-mesh grid has been used, with 48 and 168 positions evaluated respectively, the “central value” of this matrix corresponding to the geometrical center of the room considered.
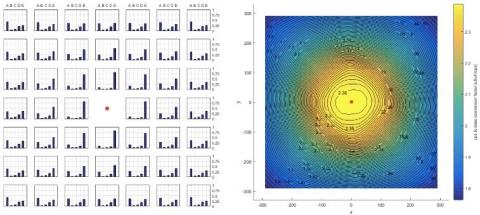
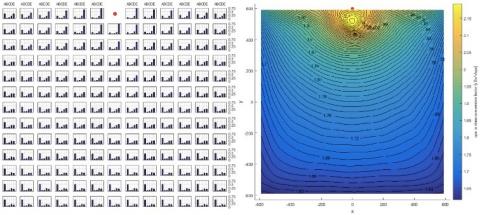
Figure 4. Large bunker: conversion coefficient vs position; neutron generator (red dot) at center. Simulated neutron spectra vs. spatial position (left) and MCNPX weighted count-rate to dose-rate conversion factor (right)
Moreover, at each position, the response of the Berthold LB6411 detector was simulated, and the neutron spectrum and the MCNPX-weighted count-rate to dose-rate conversion coefficient for LB6411 have been evaluated for radiation protection purposes.
The Berthold LB6411 count-rate to dose-rate conversion coefficients vs. neutron energy from the manufacturer has been used as multiplier in the appropriate function of the Monte Carlo input deck. Results are reported in Figures 4 - 7.
Simulated neutron spectra are shown at each position of the 1 m squared-mesh grid point, and are regrouped in the following neutron energy windows:
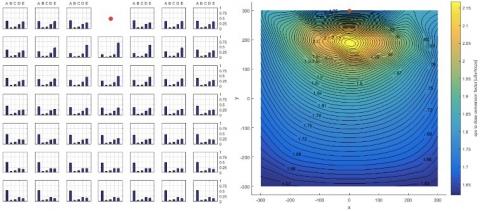
For both large and very large buildings, the highest value of the simulated weight for count-rate to dose-rate conversion coefficients is obtained when the neutron generator is placed at the center of the room.
This is due to the minor importance of scattering phenomena (Figure 4 and Figure 6) with respect to the case when the neutron generator is near the wall (Figure 5 and Figure 7). When neutron spectra low-tails dominate with respect to 14 MeV, i.e. when a significant “room return” is present, conversion coefficients assume lower values; when the 10 to 15 MeV neutrons-bin dominates, conversion coefficients assume higher values.
Figure 5. Large bunker: conversion coefficient vs position; neutron generator (red dot) near a wall. Simulated neutron spectra vs. spatial position (left) and MCNPX weighted count-rate to dose-rate conversion factor (right)
Figure 6. Very large bunker: conversion coefficient vs position; neutron generator (red dot) at center. Simulated neutron spectra vs. spatial position (left) and MCNPX weighted count-rate to dose-rate conversion factor (right)
However, whatever the position considered, the MCNPX-weighted count-rate to dose-rate conversion coefficients appear higher than the 1.27 µSv h-1 cps-1 default value (corresponding to the 252Cf self-fission ISO-neutron spectrum), and lower than the 2.46 µSv h-1 cps-1 value (corresponding to the hypothesis of monoenergetic 14 MeV neutrons).
In summary, in both experimental campaigns, and in the four simulated test cases, the Radiation Protection Expert could determine the H*(10) by the Berthold LB6411 rem-counter by assuming, as a conservative hypothesis, the 14 MeV count-rate to dose-rate conversion coefficient.
Figure 7. Very large bunker: conversion coefficient vs. position; neutron generator (red dot) near a wall. Simulated neutron spectra vs. spatial position (left) and MCNPX weighted count-rate to dose-rate conversion factor (right)
4.1 Derived calculation tool based on Monte Carlo simulations
As shown in Figures 4-7, the neutron spectrum at the point of interest where the exposure has to be evaluated is strictly dependent on the distance from the source point, and on scattering phenomena caused by moderating structures that may be present in the real-life scenario. Here are the results used forward for radiation protection purposes:
Formally, the proposed approach can be summarized in the equation below. The effective dose rate, $\dot{\mathrm{E}}$, can be split into the 14 MeV “direct-component” contribution (DC), plus the “scattered-component” contribution (SC) due to “scattered-neutrons”:
$\dot{\mathrm{E}}=\frac{\dot{\mathrm{N}}}{4 \pi \mathrm{R}^{2}} \cdot \mathrm{CF}_{\mathrm{DC}}+\mathrm{SC} \cdot \mathrm{CF}_{\mathrm{SC}}$ (1)
where:
Figure 8. Effective dose rate from Eq. (2) vs. distance R between the neutron generator target and the evaluation point (neutron yield: 108 s-1)
According to previous assumptions, and having assumed conservatively CFDC = CFSC = 500 pSv cm2, Eq. (1) can be re-formulated as Eq. (2), giving the effective dose rate related to the neutron emission $\dot{\mathrm{N}}$ and the distance between the neutron generator and the point of interest R. A factor of 3600/106 is applied to convert $\dot{\mathrm{E}}$ [pSv s-1] in $\dot{\mathrm{E}}$ [Sv s-1].
$\dot{\mathrm{E}}=\left(\frac{\dot{\mathrm{N}}}{4 \pi \mathrm{R}^{2}}+10 \frac{\dot{\mathrm{N}}}{4 \pi \mathrm{R}^{2}}\right) \cdot 500 \cdot \frac{3600}{10^{6}}=19.8 \frac{\dot{\mathrm{N}}}{4 \pi \mathrm{R}^{2}}$ (2)
In Figure 8 the graphical representation of Eq. (2), $\dot{\mathrm{E}}$ vs. R, is shown, considering $\dot{\mathrm{N}}$=108 s-1 emission from the neutron generator.
4.2 Exposure evaluations
Calculations presented hereafter are intended to give the order of magnitude of the radiation protection quantities of interest, and to demonstrate the conservativeness of the approach. Both bunker and open field cases are discussed.
4.2.1 Exposure evaluations in the bunker scenario
A bunker scenario is here considered where a D-T neutron generator is operated. The case study involves operations in controlled environments using a neutron generator, e.g. for laboratory applications. Geometries, materials, surrounding structures, etc., are known a priori: conservative assumptions of the general approach in Eq. (2) can be removed and a more accurate evaluation of the specific case can be done.
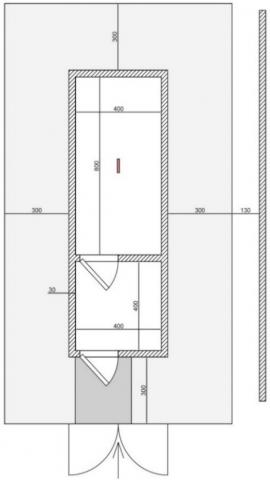
The “bunker” here considered is the same discussed in Figure 1. Specific information about the layout of the bunker is reported in Figure 9.
The bunker has been reproduced in the MCNPX code for evaluating effective dose rates outside the building. It should be noted that simulations are run considering the main room and the antechamber as empty spaces, without any presence of further shielding material. Results are reported in Figure 10, assuming the maximum neutron generator yield of 108 s-1.
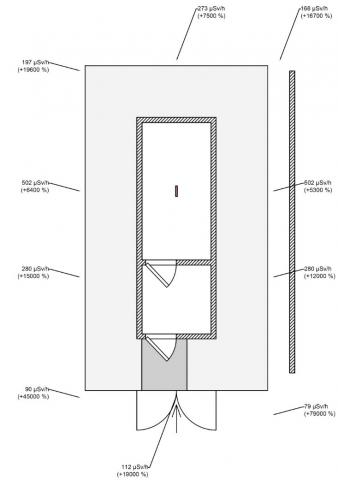
Such a case study, and its results in Figures 10 and 11, can be useful to estimate the conservativeness of the approach proposed by Eq. (2). Figure 11 reports the effective dose rates outside the bunker, calculated by Eq. (2) without considering the shielding effects of the concrete walls. As expected, dose rates are overestimated in comparison with values from MCNPX simulation (shown in Figure 10) which, on the contrary, account for the presence of shielding walls. Dose rates are overestimated by two orders of magnitude, showing that the shielding effect of a single 30 cm thick concrete slab reduces effective dose rates by a factor of 50 at least, when using the approach in Eq. (2).
Figure 9. Geometry of the neutron bunker analyzed in this study (in cm). The red cell represents the position of the neutron generator
Figure 10. Effective dose rates at 30 cm from the walls outside the neutron bunker hosting the neutron generator (neutron yield: 108 s-1): results from MCNPX simulations
In this case study,
the annual effective dose is:
700 µSv h-1 ∙ 200 h y-1 ∙ (1/16) ∙ (1/50) = 175 µSv y-1.
Figure 11. Effective dose rates at 30 cm from the walls outside the neutron bunker hosting the neutron generator: results from Eq. (2); percentages show the order of magnitude of the overestimations
Regarding the public, annual effective dose from a practice can usually be optimized choosing a criterion between 10 and 300 µSv y-1.
If a member of the public is involved, having chosen 300 µSv y-1 as optimization criterion, the practice is compliant.
If the 10 µSv y-1 criterion is chosen, the practice is not compliant. In such a case, 1/20 further reduction is needed. Such a reduction can be achieved by one of the following correction actions:
4.2.2 Exposure evaluations in the open-field scenario
In order to quantify the effective dose conferred to exposed workers and members of the public in case of homeland security applications, a case study regarding the exposure to D-T neutrons in an open-field operation is considered. Such a case study simulates the on-field investigation of an isolated container to check the presence of potential explosive or harmful substances.
The following scenario can be considered:
While measurement is running, the operator must wait at a safer position, e.g. behind a shielding wall. In these experimental conditions the total exposure time at R=10 m is ~33 h y-1. As shown in Figure 8, the effective dose rate at R=10 m is ~158 µSv h-1, and the effective dose received by the worker is ~5.3 mSv y-1.
Regarding the public, annual effective dose from a practice can usually be optimized choosing a criterion between 10 µSv y-1 and 300 µSv y-1. The neutron generator in the previous scenario is run for 200 day per year, 4 h per day: using Eq. (2), if the lowest bound (10 µSv y-1) for the effective dose constraint is selected, from the equation $\dot{\mathrm{E}}$ ∙ 800 ≤ 10 µSv y-1 with $\dot{\mathrm{N}}$ = 108 s-1, an exclusion zone of radius R=1200 m is obtained. If the upper bound for the effective dose constraint is selected, 300 µSv y-1, from the equation $\dot{\mathrm{E}}$ ∙ 800 ≤ 300 µSv y-1 with $\dot{\mathrm{N}}$ = 108 s-1, an exclusion zone of radius R=40 m is obtained.
It should be considered, however, that the approach is conservative, having not accounted for any particular configuration of the environment, i.e. any scattered component. Moreover, it does not involve any shielding structure that may be present in real scenarios, and then the calculated effective dose can actually be interpreted as a maximum value. For instance, the presence of a 30 cm concrete wall along the 14 MeV neutrons pathway from the generator to the exposed person may reduce the effective dose rate in Eq. (2) by a factor of 50 at least.
The emission of a neutron generator has been simulated in different scenarios related to laboratory and homeland security applications, characterizing the neutron spectra.
The comparison between experimental data and simulated values suggested a procedure for a practical use of the Berthold LB6411 neutron counter as a reliable dosimeter, without the need of former Monte Carlo simulations for calculating the best conversion factors for each specific scenario the dosimeter could be used in. As expected, the operating procedure proved to give conservative results for the evaluation of dose rates.
As an important outcome of the presented experimental campaign validated against Monte Carlo simulations, a stand-alone and fast calculation tool for planning D-T neutrons experimental exposures was proposed and implemented.
The results of two experimental measurements with a Berthold LB 6411 neutron detector in a neutron bunker were presented, together with the reconstructionist modeling in the MCNPX 2.7.0 virtual world, and validation of simulated data vs experimental data.
Having such model validated, four Monte Carlo simulations with two wider buildings were carried out, to characterize neutron spectral distributions against positioning. The purpose was to evaluate the most appropriate count-rate to dose-rate conversion coefficient for Berthold LB6411.
Results show that the default conversion coefficient for LB6411, calibrated as default with the 252Cf spectrum, should not be used for D-T neutrons exposure evaluation purposes because, in some cases, it would lead to important underestimations. On the contrary, for an adequate, though conservative, estimate, there is evidence that the best solution is to use the conversion coefficient that assumes a monoenergetic neutron spectrum at 14 MeV, whatever the environment and geometry of the experimental setup are. Actually, it is worth reminding that in real scenarios neutrons at each point of interest are distributed over the entire energy range, from thermal neutrons (0.025 eV) to D-T fusion neutrons (14.1 MeV); the monoenergetic spectrum at 14 MeV is only a conservative assumption to evaluate dose-rates to workers in field scenarios.
Finally, a stand-alone and fast calculation tool for planning experimental exposures was proposed. Such utility tool provides the Radiation Protection Expert with a direct, even though conservative, estimation of the effective dose rate when a neutron generator is operated, taking into account mainly the neutron yield of the device and the distance to the point of interest. The tool assumes the sole presence of air between the neutron generator and the target person at the point of interest. However, any presence of a shielding structure can be taken into account by a scaling factor to be applied to effective dose rates.
Two case-studies were discussed and analyzed as examples of evaluation of the effective dose-rates to exposed workers and members of the public:
Given the non-specificity of the considered scenarios, these conclusions are general in nature. The method was developed for first, rough but conservative, exposure evaluations under environmental conditions whose effects on neutrons spectra at the point of interest are not a priori predictable, i.e. complex irradiation scenarios on field, as a shipping port, research facilities, etc. The proposed approach simplifies the assessment, suggesting a procedure for obtaining conservative results without the need of time-expensive Monte Carlo simulations.
The authors would like to express special thanks to Dr. Mario Pillon (ENEA) for his disposability in dialogue and his technical competences in discussing the radiographic data of the Thermo Scientific MP-320 neutron generator.
Thanks go to the Institute of Radiation Protection of ENEA for providing the calibrated Berthold LB6411 neutron counter used in the experimental campaigns.
A special thanks goes to all ENEA-UTICT technicians working on HPC system used in this work. The computing resources and the related technical support were provided by the CRESCO/ENEAGRID High Performance Computing infrastructure and its staff [23]. CRESCO/ENEAGRID High Performance Computing infrastructure is funded by ENEA and by Italian and European research programs, see http://www.cresco.enea.it/english for information.
[1] Csikai, G.J. (1987). CRC Handbook of Fast Neutron Generators, vol. 1. Boca Raton, Florida, United States: CRC Press.
[2] Raoux, A.C., Lyoussi, A., Passard, C., Denis, C., Loridon, J., Misraki, J., Chany, P. (2003) Delayed neutron measurement, Prompt neutron measurement, Waste characterisation, Monte Carlo uncertainties. Nuclear Instruments and Methods in Physics Research Section B: Beam Interactions with Materials and Atoms, 207(2): 186-194. https://doi.org/10.1016/S0168-583X(03)00451-8
[3] Gozani, T. (1981). Active nondestructive assay of nuclear materials: Principles and applications. Washington, D.C., United States, U.S. Nuclear Regulatory Commission, NUREG/CR-0602.
[4] Buffler, A. (2004). Contraband detection with fast neutrons. Radiation Physics and Chemistry, 71(3-4): 853-861. https://doi.org/10.1016/j.radphyschem.2004.04.110
[5] Aleksandrov, V.D., Bogolubov, E.P., Bochkarev, O.V., Korytko, L.A., Nazarov, V.I., Polkanov, Y.G., Ryzhkov V.I, Khasaev, T.O. (2005). Application of neutron generators for high explosives, toxic agents and fissile material detection. Applied Radiation and Isotopes, 63(5-6): 537-543. https://doi.org/10.1016/j.apradiso.2005.05.002
[6] Bogolubov, Y.P., Korotkov, S.A., Korytko, L.A., Morukov, V.G., Nazarov, V.I., Polkanov, Y.G., Khasaev, T.O. (2004). Method and system based on pulsed neutron generator for fissile material detection in luggage. Nuclear Instruments and Methods in Physics Research Section B: Beam Interactions with Materials and Atoms, 213: 439-444. https://doi.org/10.1016/S0168-583X(03)01751-8
[7] Cherubini, N., Dodaro, A., Gandolfo, G., Lepore, L., Marzo, G.A., Piccinelli, E., Remetti, R. (2016). Field prototype of the ENEA neutron active interrogation device for the detection of dirty bombs. Challenges, 7(2): 17. https://doi.org/10.3390/challe7020017
[8] Remetti, R., Gandolfo, G., Lepore, L., Cherubini, N. (2017). In field application of differential Die-Away time technique for detecting gram quantities of fissile materials. Nuclear Instruments and Methods in Physics Research Section A: Accelerators, Spectrometers, Detectors and Associated Equipment, 870: 123-130. https://doi.org/10.1016/j.nima.2017.07.033
[9] Jordan, K.A., Gozani, T. (2007). Pulsed neutron differential die away analysis for detection of nuclear materials. Nuclear Instruments and Methods in Physics Research Section B: Beam Interactions with Materials and Atoms, 261(1-2): 365-368. https://doi.org/10.1016/j.nimb.2007.04.294
[10] Jordan, K.A., Gozani, T., Vujic, J. (2008). Differential die-away analysis system response modeling and detector design. Nuclear Instruments and Methods in Physics Research Section A: Accelerators, Spectrometers, Detectors and Associated Equipment, 589(3): 436-444. https://doi.org/10.1016/j.nima.2008.02.039
[11] Vourvopoulos, G., Womble, P.C. (2001). Pulsed fast/thermal neutron analysis: A technique for explosives detection. Talanta, 54(3): 459-468. https://doi.org/10.1016/S0039-9140(00)00544-0
[12] Andersson, I.O. (1963). Neutron rem-counter with uniform sensitivity from 0.025 eV to 10 MeV. In Proc. IAEA Symp. on Neutron Dosimetry, Vienna, 2: 87-95.
[13] Birattari, C., Ferrari, A., Nuccetelli, C., Pelliccioni, M. Silari, M. (1990). An extended range neutron rem counter. Nuclear Instruments and Methods in Physics Research Section A: Accelerators, Spectrometers, Detectors and Associated Equipment, 297(1-2): 250-257. https://doi.org/10.1016/0168-9002(90)91373-J
[14] Jagerhofer, L., Feldbaum, E., Forkel-Wirth, D., Theis, C., Vincke, H., Iwamoto, Y., Hagiwara, M., Satoh, D., Iwase, H., Yashima, H., Matsumoto, T., Mmasuda, A., Nishiyama, J., Nakamura, T., Sato, T., Nakane, Y., Nakashima, H., Sakamoto, Y., Tamii, A., Hatanaka K. (2011). Characterization of the WENDI-II REM counter for its application at MedAustron. Prog. Nucl. Sci. Technol, 2: 258-262.
[15] Jägerhofer, L., Feldbaumer, E., Theis, C., Roesler, S., Vincke, H. (2012). A new method to calculate the response of the WENDI-II rem counter using the FLUKA Monte Carlo Code. Nuclear Instruments and Methods in Physics Research Section A: Accelerators, Spectrometers, Detectors and Associated Equipment, 691: 81-85. https://doi.org/10.1016/j.nima.2012.05.097
[16] Kim, S.I., Kim, B.H., Chang, I., Lee, J.I., Kim, J.L., Pradhan, A.S. (2013). Response of six neutron survey meters in mixed fields of fast and thermal neutrons. Radiation Protection Dosimetry, 156(4): 518-524. https://doi.org/10.1093/rpd/nct103
[17] Schwartz, R.B., Eisenhauer, C.M. (1979). The design and construction of a D2O-Moderated 252Cf source for calibrating neutron personnel dosimeters used at nuclear power reactors. US Nucl Reg Com Doc. 1980 Jan. NUREG/CR-1204.
[18] Contessa, G.M., Cherubini, N., Dodaro, A., Lepore, L., Marzo, G.A., Sandri, S. (2015). Caratterizzazione teorica e sperimentale del fascio neutronico di un generatore di neutroni del tipo D-T e conseguente analisi dosimetrica - Theoretical and experimental characterization of the neutron beam of a D-T neutron generator and consequent dosimetric analysis. Proceedings of XXXVI National Congress of Radiation Protection – Italian Radiation Protection Association. https://www.airp-asso.it/?page_id=731.
[19] MP320 Neutron Generator - Operation Manual. (2014). Thermo Fisher Scientific, Waltham, USA. https://assets.thermofisher.com/TFS-Assets/CAD/Specification-Sheets/D10497~.pdf.
[20] LB6411 Neutron Probe - Operation Manual. (1995). Berthold Technologies GmbH, Vienna, Austria. https://www.berthold.com/en/radiation-protection/products/dose-and-dose-rate/neutron-dose-rate-probe-lb-6411/.
[21] Briesmeister, J.F. (1993). MCNP-A general purpose Monte Carlo code for neutron and photon transport. Manual Version C, 4.
[22] Petoussi-Henss, N., Bolch, W.E., Eckerman, K.F., Endo, A., Hertel, N., Hunt, J., Pelliccioni, M., Schlattl, H., Zankl, M. (2010). Conversion coefficients for radiological protection quantities for external radiation exposures. Annals of the ICRP, 40(2-5): 1-257. https://doi.org/10.1016/j.icrp.2011.10.001
[23] Iannone, F., Ambrosino, F., Bracco, G., De Rosa, M., Funel, A., Guarnieri, G., Migliori, S., Palombi, F., Ponti, G., Santomauro, G., Procacci, P. (2019). CRESCO ENEA HPC clusters: a working example of a multifabric GPFS Spectrum Scale layout. In 2019 International Conference on High Performance Computing & Simulation (HPCS), 1051-1052. https://doi.org/10.1109/HPCS48598.2019.9188135