Marco Carbonelli* | Laura Gratta
© 2021 IIETA. This article is published by IIETA and is licensed under the CC BY 4.0 license (http://creativecommons.org/licenses/by/4.0/).
OPEN ACCESS
This work is the result of a research activity started in 2012 to deploy a method for risk assessment to be applied by the Italian Civil Protection and Civil Defence to protect critical infrastructures. The here presented Multi-Risk Assessment Method (MRAM), illustrates the complete approach, provided by this research activity, suitable to estimate both impact and risk in qualitative, semi-quantitative and quantitative fashion for catastrophic or calamitous events, including terrorist non-conventional CBRNe attacks.
In the paper a vulnerability reduction assessment methodology is also hinted with an analysis of the relation of MRAM with the USA RAMCAP approach adopted by Department of Homeland Security.
The MRAM provides a method for risk assessment, and was also recently implemented in forecasting software tools by some Italian local administrations.
risk assessment, impact assessment, vulnerability, exposure, qualitative method, quantitative method, vulnerability reduction
Risk assessment is a forecasting activity that has been challenging the modern societies since a long time. The more our societies get complex and interconnected, the more they are exposed to several, different - and possibly new - risks. The current pandemic that is spreading since the beginning of 2020 is a dramatic example of this trend.
Although we are generally aware that there are risks, very often the evaluation ex-ante of these risks appears so complex and overwhelming that we give up, restricting ourselves to occasional strengthening of the security measures in place, without actually knowing who and why is more exposed to risks.
In the last 15 years, several national and international institutions have deployed standards and strategies [1-8] to face risk assessment in different contexts. Many companies have developed accurate, but very ‘narrowband’ risk assessment tools, based on the specific aspect of risk they face.
The effort presented in this paper is to deploy a general risk and impact assessment technique that can be adopted in whatever operating scenario, and in presence of almost whatever threat or hazard, but that can provide a sufficiently accurate estimate of the risk in a simple fashion. The method allows to manage different kinds of risk (all-hazards/threats approach) and results useful for identifying a rank of risks in a given portion of territory, and for prioritizing actions and investments in preparedness, protection and resilience of critical areas and critical infrastructures.
In section 2 we introduce the background for the methodology; in section 3 we set the scales for the risk and impact evaluation, while in section 4 we deepen the analysis of the vulnerability parameter, that is usually the only one that can be controlled and possibly reduced by the technical experts adopting risk reduction measures. In section 5 an analysis of the relation of the proposed method MRAM with the USA RAMCAP approach adopted by Department of Homeland Security is carried out. Finally, in section 6 the software implementation of the MRAM approach is illustrated for a case study, in the case of an emergency plan of an Italian local administration.
Since 2012 the authors of this work proposed in the Italian academic arena [9] a first essential method for risk assessment to be applied for the Italian Civil Protection and Civil Defence applications. The here presented Multi-Risk Assessment Method (MRAM), illustrate the complete approach, refined during these last years, suitable to estimate both impact and risk in qualitative, semi-quantitative and quantitative fashion for catastrophic or calamitous events, including terrorist non-conventional CBRNe attacks.
Drawing part of the inspiration from methods proposed in the USA for Critical Infrastructures protection and for the management of natural/terrorist disasters [10-13], the MRAM presents the following characteristics:
It is important to highlight that MRAM applies logarithmic scales for the following reasons:
Observe that for the logarithmic scale to base 3, tripling criterion or power of 3 criterion holds, and so on for the value of the base increasing.
For the application of the MRAM the following definitions of fundamental quantities are adopted:
In the following sections we will see how the estimate of these three quantities can lead to an effective and coherent risk assessment.
In order to compare different risk scenarios in a multi-hazard approach and to display results with a more suitable granularity and easier interpretation a logarithmic scale is adopted.
In the following analysis the complete version of the MRAM method, structured on logarithm to base 2, has been described and the upper values of the intervals in the arrays are evaluated according to the powers of 2 law. So each level corresponds to the exponent in the power of 2, and the amplitude of the range, as discussed before, doubling the value moving from one level to the successive level.
The range of the first level is set on the basis of the minimal desired granularity. In Table 1 this aspect for the threat levels is of evidence in the threat probability columns, designed for assuming a minimum probability value of 10-3.
3.1 Scale design examples
Threat probability scale has to be suitably tuned according to the minimum probability scenario. MRAM method proposed, for example, a threat scale (see Table 1) with 11 levels, reasonably assuming a minimum probability like 1/1024. Events with lower probability of occurrence need a deeper scale, for example, for a probability of occurrence around 1/10,000 (that is once every 10,000 years) a scale of 14 threat levels could be adopted [14].
Table 1. Example of MRAM threat scale
|
Threat level |
from > |
to <= |
Threat probab. Min |
Threat probab. Max |
|
11 |
0.5 |
1 |
1/2 |
1 |
|
10 |
0.25 |
0.5 |
1/4 |
1/2 |
|
9 |
0.125 |
0.25 |
1/8 |
1/4 |
|
8 |
0.0625 |
0.125 |
1/16 |
1/8 |
|
7 |
0.0313 |
0.0625 |
1/32 |
1/16 |
|
6 |
0.0156 |
0.0313 |
1/64 |
1/32 |
|
5 |
0.0078 |
0.0156 |
1/128 |
1/64 |
|
4 |
0.0039 |
0.0078 |
1/256 |
1/128 |
|
3 |
0.00195 |
0.0039 |
1/512 |
1/256 |
|
2 |
0.001 |
0.002 |
1/1024 |
1/512 |
|
1 |
<0.001 |
<1/1024 |
||
Vulnerability scale has to be suitably tuned according to the minimum vulnerability scenario. For an effective vulnerability analysis in [14], a 18 levels scale was suggested (vulnerability value up to roughly 10-5), as in Table 2.
Table 2. Example of MRAM vulnerability scale
|
Vulnerability level |
from > |
to <= |
Vulnerability probab. min |
Vulnerability probab. max |
|
18 |
0.5 |
1 |
1/2 |
1 |
|
17 |
0.25 |
0.5 |
1/4 |
1/2 |
|
16 |
0.125 |
0.25 |
1/8 |
1/4 |
|
15 |
0.0625 |
0.125 |
1/16 |
1/8 |
|
14 |
0.0313 |
0.0625 |
1/32 |
1/16 |
|
13 |
0.0156 |
0.0313 |
1/64 |
1/32 |
|
12 |
0.0078 |
0.0156 |
1/128 |
1/64 |
|
11 |
0.0039 |
0.0078 |
1/256 |
1/128 |
|
10 |
0.00195 |
0.0039 |
1/512 |
1/256 |
|
9 |
0.001 |
0.002 |
1/1,024 |
1/512 |
|
8 |
0.00049 |
0.001 |
1/2,048 |
1/1,024 |
|
7 |
0.00024 |
0.00049 |
1/4,096 |
1/2,048 |
|
6 |
0.00012 |
0.00024 |
1/8,192 |
1/4,096 |
|
5 |
0.00006 |
0.00012 |
1/16,384 |
1/8,192 |
|
4 |
0.00003 |
0.00006 |
1/32,768 |
1/16,384 |
|
3 |
1.5E-05 |
0.00003 |
1/65,536 |
1/32,768 |
|
2 |
7.6E-06 |
1.5E-05 |
1/131,072 |
1/65,536 |
|
1 |
<7.6E-06 |
<1/131,072 |
||
Exposure scale has to be suitably tuned according to maximum exposure scenario (see Table 3). In this example, an exposure array with 14 levels could be managed, assuming to perform risk analysis for an area in which the maximum exposure scenario was around 100,000 people exposed. Areas with higher exposure need a deeper array [14].
Table 3. Example of MRAM exposure scale
|
Exposure level |
Number of people |
|
14 |
>102400 |
|
13 |
51200 – 102400 |
|
12 |
25601 – 51200 |
|
11 |
12801 – 25600 |
|
10 |
6401 – 12800 |
|
9 |
3201 – 6400 |
|
8 |
1601 – 3200 |
|
7 |
801 – 1600 |
|
6 |
401– 800 |
|
5 |
201– 400 |
|
4 |
101– 200 |
|
3 |
51 – 100 |
|
2 |
26 – 50 |
|
1 |
1 – 25 |
3.2 Introducing the “level” simplification
Under the hypothesis of independence of the three variables T, V and E, a well known [14] risk formula can be applied
R = T ∙ V ∙ E (1)
Wherein we remember that:
R stands for the risk associated probability,
T stands for the threat associated probability,
V stands for the vulnerability associated probability,
E stands for the exposure.
The four variable above can be translated in the log2 domain, introducing the concept of “levels, that is:
LR= log2(R) = Risk level;
LT= log2(T) = Threat level;
LV= log2(V) = Vulnerability level;
LE= log2(E) = Exposure level.
Then the risk formula can be re-written as a risk level formula, i.e.:
LR = LT + LV +LE (2)
Evaluations can be executed also for the Impact adopting levels. Therefore [14], the Level of Impact LI is calculated by summing the value of the level of exposure LE (using the designed exposure scale) with the value of the vulnerability level LV (using the designed vulnerability scale), as shown in the following:
LI = LV + LE (3)
Assuming to have a 18 levels vulnerability scale (Table 2) and 14 levels exposure scale (Table 3) a semi-quantitative impact matrix can be created as shown in Table 4. As discussed before, in this matrix the doubling criterion (or power of 2 criterion) applies for each increment of 1 in the level value.
The use of colors and the definition of an appropriate scale allows us to pass from a 31 levels scale to a qualitative scale (see Tables 4 and 5).
The following meaning is associated to the qualitative levels and colors:
• Very high impact, dark blue color (high probability of hundreds-thousands of dead/seriously injured);
• High impact, blue color (high probability of tens-hundreds of dead/seriously injured);
• Medium impact, light blue color (high probability of units-tens of dead/seriously injured);
• Low impact, pale blue color (low probability of dead/seriously injured);
• Very Low impact, white color (very low probability of dead/seriously injured).
For a qualitative and semi-quantitative estimate of risk, the Level of Risk LR is calculated by summing the value of the level of impact LI and the value of the level of probability of the threat LT.
LR = LT + LI (4)
Table 4. Example of MRAM semi-quantitative impact matrix
|
|
18 |
19 |
20 |
21 |
22 |
23 |
24 |
25 |
26 |
27 |
28 |
29 |
30 |
31 |
32 |
|
|
17 |
18 |
19 |
20 |
21 |
22 |
23 |
24 |
25 |
26 |
27 |
28 |
29 |
30 |
31 |
|
|
16 |
17 |
18 |
19 |
20 |
21 |
22 |
23 |
24 |
25 |
26 |
27 |
28 |
29 |
30 |
|
|
15 |
16 |
17 |
18 |
19 |
20 |
21 |
22 |
23 |
24 |
25 |
26 |
27 |
28 |
29 |
|
V |
14 |
15 |
16 |
17 |
18 |
19 |
20 |
21 |
22 |
23 |
24 |
25 |
26 |
27 |
28 |
|
u |
13 |
14 |
15 |
16 |
17 |
18 |
19 |
20 |
21 |
22 |
23 |
24 |
25 |
26 |
27 |
|
l |
12 |
13 |
14 |
15 |
16 |
17 |
18 |
19 |
20 |
21 |
22 |
23 |
24 |
25 |
26 |
|
n |
11 |
12 |
13 |
14 |
15 |
16 |
17 |
18 |
19 |
20 |
21 |
22 |
23 |
24 |
25 |
|
e |
10 |
11 |
12 |
13 |
14 |
15 |
16 |
17 |
18 |
19 |
20 |
21 |
22 |
23 |
24 |
|
r |
9 |
10 |
11 |
12 |
13 |
14 |
15 |
16 |
17 |
18 |
19 |
20 |
21 |
22 |
23 |
|
a |
8 |
9 |
10 |
11 |
12 |
13 |
14 |
15 |
16 |
17 |
18 |
19 |
20 |
21 |
22 |
|
b |
7 |
8 |
9 |
10 |
11 |
12 |
13 |
14 |
15 |
16 |
17 |
18 |
19 |
20 |
21 |
|
i |
6 |
7 |
8 |
9 |
10 |
11 |
12 |
13 |
14 |
15 |
16 |
17 |
18 |
19 |
20 |
|
l |
5 |
6 |
7 |
8 |
9 |
10 |
11 |
12 |
13 |
14 |
15 |
16 |
17 |
18 |
19 |
|
i |
4 |
5 |
6 |
7 |
8 |
9 |
10 |
11 |
12 |
13 |
14 |
15 |
16 |
17 |
18 |
|
t |
3 |
4 |
5 |
6 |
7 |
8 |
9 |
10 |
11 |
12 |
13 |
14 |
15 |
16 |
17 |
|
y |
2 |
3 |
4 |
5 |
6 |
7 |
8 |
9 |
10 |
11 |
12 |
13 |
14 |
15 |
16 |
|
|
1 |
2 |
3 |
4 |
5 |
6 |
7 |
8 |
9 |
10 |
11 |
12 |
13 |
14 |
15 |
|
|
|
1 |
2 |
3 |
4 |
5 |
6 |
7 |
8 |
9 |
10 |
11 |
12 |
13 |
14 |
|
Exposure |
|||||||||||||||
Assuming to have a 31 levels Impact array LI (Table 4) and 11 levels threat scale LT (Table 1) a semi-quantitative risk matrix can be created as shown in Table 6.
Table 5. Example of MRAM qualitative impact matrix
|
Impact level |
Qualitative scale |
Qualitative level |
|
from 26 to 32 |
Dark blue |
Very High |
|
from 20 to 25 |
Blue |
High |
|
from 14 to 19 |
Light blue |
Medium |
|
from 8 to 13 |
Pale blue |
Low |
|
form 2 to 7 |
White |
Very Low |
Table 6. Example of MRAM semi-quantitative risk matrix
|
|
32 |
33 |
34 |
35 |
36 |
37 |
38 |
39 |
40 |
41 |
42 |
43 |
|
|
31 |
32 |
33 |
34 |
35 |
36 |
37 |
38 |
39 |
40 |
41 |
42 |
|
|
30 |
31 |
32 |
33 |
34 |
35 |
36 |
37 |
38 |
39 |
40 |
41 |
|
|
29 |
30 |
31 |
32 |
33 |
34 |
35 |
36 |
37 |
38 |
39 |
40 |
|
|
28 |
29 |
30 |
31 |
32 |
33 |
34 |
35 |
36 |
37 |
38 |
39 |
|
|
27 |
28 |
29 |
30 |
31 |
32 |
33 |
34 |
35 |
36 |
37 |
38 |
|
|
26 |
27 |
28 |
29 |
30 |
31 |
32 |
33 |
34 |
35 |
36 |
37 |
|
|
25 |
26 |
27 |
28 |
29 |
30 |
31 |
32 |
33 |
34 |
35 |
36 |
|
|
24 |
25 |
26 |
27 |
28 |
29 |
30 |
31 |
32 |
33 |
34 |
35 |
|
|
23 |
24 |
25 |
26 |
27 |
28 |
29 |
30 |
31 |
32 |
33 |
34 |
|
|
22 |
23 |
24 |
25 |
26 |
27 |
28 |
29 |
30 |
31 |
32 |
33 |
|
I |
21 |
22 |
23 |
24 |
25 |
26 |
27 |
28 |
29 |
30 |
31 |
32 |
|
m |
20 |
21 |
22 |
23 |
24 |
25 |
26 |
27 |
28 |
29 |
30 |
31 |
|
p |
19 |
20 |
21 |
22 |
23 |
24 |
25 |
26 |
27 |
28 |
29 |
30 |
|
a |
18 |
19 |
20 |
21 |
22 |
23 |
24 |
25 |
26 |
27 |
28 |
29 |
|
c |
17 |
18 |
19 |
20 |
21 |
22 |
23 |
24 |
25 |
26 |
27 |
28 |
|
t |
16 |
17 |
18 |
19 |
20 |
21 |
22 |
23 |
24 |
25 |
26 |
27 |
|
|
15 |
16 |
17 |
18 |
19 |
20 |
21 |
22 |
23 |
24 |
25 |
26 |
|
|
14 |
15 |
16 |
17 |
18 |
19 |
20 |
21 |
22 |
23 |
24 |
25 |
|
|
13 |
14 |
15 |
16 |
17 |
18 |
19 |
20 |
21 |
22 |
23 |
24 |
|
|
12 |
13 |
14 |
15 |
16 |
17 |
18 |
19 |
20 |
21 |
22 |
23 |
|
|
11 |
12 |
13 |
14 |
15 |
16 |
17 |
18 |
19 |
20 |
21 |
22 |
|
|
10 |
11 |
12 |
13 |
14 |
15 |
16 |
17 |
18 |
19 |
20 |
21 |
|
|
9 |
10 |
11 |
12 |
13 |
14 |
15 |
16 |
17 |
18 |
19 |
20 |
|
|
8 |
9 |
10 |
11 |
12 |
13 |
14 |
15 |
16 |
17 |
18 |
19 |
|
|
7 |
8 |
9 |
10 |
11 |
12 |
13 |
14 |
15 |
16 |
17 |
18 |
|
|
6 |
7 |
8 |
9 |
10 |
11 |
12 |
13 |
14 |
15 |
16 |
17 |
|
|
5 |
6 |
7 |
8 |
9 |
10 |
11 |
12 |
13 |
14 |
15 |
16 |
|
|
4 |
5 |
6 |
7 |
8 |
9 |
10 |
11 |
12 |
13 |
14 |
15 |
|
|
3 |
4 |
5 |
6 |
7 |
8 |
9 |
10 |
11 |
12 |
13 |
14 |
|
|
2 |
3 |
4 |
5 |
6 |
7 |
8 |
9 |
10 |
11 |
12 |
13 |
|
|
|
1 |
2 |
3 |
4 |
5 |
6 |
7 |
8 |
9 |
10 |
11 |
|
Threat |
||||||||||||
As discussed before, in this matrix the doubling criterion (or power of 2 criterion) applies for each increment of 1 in the risk level value.
Again, the use of colors and the definition of an appropriate scale allows us to pass from a 41 levels scale to a qualitative scale as shown in the following Table 7.
Table 7. Example of MRAM qualitative risk matrix
|
Risk level for people |
Qualitative scale |
Qualitative level |
|
from 36 to 43 |
Red |
Very High |
|
from 28 to 35 |
Orange |
High |
|
from 19 to 27 |
Yellow |
Medium |
|
from 10 to 18 |
Green |
Low |
|
form 3 to 10 |
Dark green |
Very Low |
The following meaning is associated to the qualitative risk levels and colors:
The MRAM method’s scalability and modularity presented in this example allows to perform a multi-hazard risk analysis using an appropriate risk array.
In the case of an insufficient length of the exposure array (i.e. number of people exposed more than 100.000), the introduction of a new exposure array with the desired length is advised.
As a consequence, the creation of a new impact and risk arrays becomes necessary for re-implementing the MRAM method with the new arrays.
The same procedure applies if different threats and vulnerability scales are to be adopted.
The only requirement for applying a multi-risk comparison procedure is to implement the risk assessment with the same scales and arrays for the basic risk parameters.
The application of the MRAM is strictly conditioned in the obtained results by the capability of selected Risk assessment experts in charge of the analysis to interpret the considered scenarios and to select the appropriate levels of the risk parameters. For these reasons, the method can be applied only under the strict control of experts in the field of interest for the risk evaluation. Many decisions have to be taken on the basis of experience, with a holistic vision of the scenario, in particular, as we will discuss in the following, for the Vulnerability parameter.
In order to help risk assessment experts in the MRAM application, the method proposes an in-depth analysis and distinguishes two different kinds of Vulnerability: Internal Vulnerability and External Vulnerability.
Internal Vulnerability (Vi) represents the statistical weakness of a human being (in case of damage to population) with respect to a given threat. Internal Vulnerability values are expressed in the range 0 ≤ Vi ≤1, as in the case of a probability. Example: humans are defenceless against lethal viruses (i.e. Ebola) as their immune system is inadequate to face them. This is a case of internal vulnerability and, for example, Vi =0.8 is the statistical probability to die after the infection.
External Vulnerability (Ve) represents (in case of damage to population) the weakness of structures with respect to a given threat (i.e. in case of an earthquake) or the effectiveness of the attack (i.e. in case of a terrorist attack). Even External Vulnerability values are expressed in the range 0 ≤ Vi ≤1, as in the case of a probability. Example: a lethal virus can be spread by aerosol or spread in the water pipes or in an air conditioning system. The three methods imply different infection probabilities, and therefore different external vulnerabilities.
Overall (or Total) Vulnerability (Vt) is computed as a function of Vi and Ve . Assuming that Vi and Ve are independent variables (that is almost always true), then
Vt = Vi.Ve
If a dependence exists between Vi and Ve , the conditional probability can be calculated through Bayes theorem.
Setting a value for the measure of the Vulnerability is one of the most delicate phases of the MRAM.
The same criticality is true, in general, for every risk assessment method, and on this issue ISO 31010 [2] proposes three major different approaches:
historical records in order to extrapolate the probability of success of the attacks;
probability forecasts using predictive techniques such as fault tree analysis and event tree analysis;
expert judgments based on analytical, statistical methods and previous experiences.
As far as the measure of the Threat probability, the MRAM proposes to refer for natural disasters to Civil Protection historical records and for terrorist attacks to refer to Intelligence evaluations of the different threat scenarios, updated to current evolving national and international context.
Finally, MRAM proposes the use of a numerical factor, so called Vulnerability Reduction Factor (VRF) to evaluate the amount of reduction of the vulnerability obtained by means of the countermeasures.
The scale of this factor is expressed as a set of classes. Ten or two factor scales are proposed.
In Table 8 a ten factor is proposed: stepping from a class to the successive one, the VRF increases by a factor equal to 10.
Table 8. Vulnerability reduction factor
|
Vulnerability reduction scale |
Value of the Vulnerability reduction factor (VRF) |
|
Class 6 |
10-6 |
|
Class 5 |
10-5 |
|
Class 4 |
10-4 |
|
Class 3 |
10-3 |
|
Class 2 |
10-2 |
|
Class 1 |
10-1 |
|
Class 0 |
100 = 1 |
With reference to Table 8, a Class 2 countermeasure allows a vulnerability reduction equivalent to dividing by 100 (i. e. multiplied by 10-2) its original value, while a Class 0 countermeasure is completely ineffective, as it corresponds to a division by 1 (i. e. 100) of the original vulnerability value.
The same applies, with the power of 2 instead of 10, in Table 9.
Table 9. Vulnerability reduction factor classes (Two factor)
|
Vulnerability reduction scale |
Value of the Vulnerability reduction factor (VRF) |
|
Class 10 |
2-10 = 1/1024 |
|
Class 9 |
2-9 = 1/512 |
|
Class 8 |
2-8 = 1/256 |
|
Class 7 |
2-7 = 1/128 |
|
Class 6 |
2-6 = 1/64 |
|
Class 5 |
2-5 = 1/32 |
|
Class 4 |
2-4 = 1/16 |
|
Class 3 |
2-3 = 1/8 |
|
Class 2 |
2-2 = 1/4 |
|
Class 1 |
2-1 = 1/2 |
|
Class 0 |
20 = 1 |
When multiple countermeasures are applied to face the same vulnerability Total Vulnerability Reduction Factor (VRFtot) can be determined:
If the countermeasures are independent - as it generally occurs - VRFtot is the product of VRFx associated to the single countermeasures;
If there is a dependence among countermeasures, VRFtot must be computed as a combined or conditioned probability.
Once evaluated VRFtot starting from the Original Vulnerability Vo (with no countermeasures applied that is often set to 1) we can calculate the Residual Vulnerability Vr as
Vr = Vo.VRFtot .
Starting from the Residual Vulnerability we can re-apply the MRAM and evaluate the Residual Risk that remains after the risk treatment (i.e. after the introduction of countermeasures for the vulnerability reduction).
As last practical advice, the MRAM method can be integrating with the creation of a Catalogue of countermeasures in which at any countermeasures is associated, by experts, a possible set of values of Vulnerability Reduction Factors, in order to make the risk management treatment phases faster and, possibly, easier.
As discussed before, the MRAM has been proposed to deploy a general risk and impact assessment technique that can be adopted in whatever operating scenario, and in presence of almost whatever threat or hazard, but that can provide a sufficiently accurate estimate of the risk in a simple fashion. In fact, in last decades many companies have developed accurate, but very ‘narrowband’ risk assessment tools, based on the specific aspect of risk they face. The results of the different risk assessment tools are typically not comparable and It is impossible to build a coherent rank for different kind of risks, being this rank more and more often required by politicians and technical decision makers.
So, the fundamental question is to manage different kinds of risk (all-hazards/threats approach) and results useful for identifying a rank of risks in a given portion of territory, and for prioritizing actions and investments in preparedness, protection and resilience of critical areas and critical infrastructures.
A first assessment method studied to achieve these goals was proposed in the USA by the ASME Innovative Technologies Institute, with the Risk Analysis and Management for Critical Asset Protection – RAMCAP [15-17] process for threats due to terrorism, naturally occurring events and interruptions of supply chains on which they are dependent to carry out their essential functions.
The RAMCAP technical development was initiated in response to the USA recommendation of a 2002 White House Conference concerning the protection of the Nation’s critical infrastructure. In fact, the Conference highest fundamental results were to implement an objective, consistent and efficient method for assessing and reducing infrastructure risks in terms directly comparable among different type of risks.
In 2005 the first version of RAMCAP was proposed and successively adopted by the USA Department of Homeland Security (DHS) as a reference framework [18] for Decision Support System (DSS), satisfying the DHS baseline criteria for risk assessment with an ‘all threats and hazards’ approach. This proprietary tool was applied by DHS for Critical Infrastructure cross-sector risk assessment.
Due to this very important adoption in USA, RAMCAP was considered for long years, in the research on Critical Infrastructure protection and risk management, a reference tool at international level.
In particular, RAMCAP application, since 2005 up to 2011, supported the USA DHS in the attempt to allocate in a rational way a finite amount of economic resources to protect the most important and vulnerable infrastructure assets of the USA. Three successive versions of the RAMCAP, for seven critical sectors and subsectors, were completed up to 2011.
In the RAMCAP [RAM1] approach was introduced, for the first time in this kind of technical issue, a scale of bins for characterizing consequences (i.e. economic, fatalities), threats/hazards and vulnerabilities. At the same time, in RAMCAP every fundamental mathematical parameter of the approach was described with a logarithmic based scale - in particular log2(x) - so that:
risk could be estimated using a limited number of levels in the representation (a linear model would become increasingly heavy);
risk could be estimated by adding threat level, consequence level and vulnerability level, to provide the decision-maker with easy to interpret results.
In Table 10 an example of the vulnerability scale adopted in RAMCAP is shown.
Table 10. Example of RAMCAP Likelihood, for Vulnerability evaluation, scale [17]
|
Likelihood (L) of ‘Attack success Scale’ |
|||
|
Bin |
from > |
to <= |
Success per attempts |
|
5C |
0.9 |
1 |
9/10<L<1 |
|
5B |
0.75 |
09 |
3/4<L<9/10 |
|
5A |
0.5 |
0.75 |
1/2<L<3/4 |
|
4 |
0.25 |
0.5 |
1/4<L<1/2 |
|
3 |
0.125 |
0.25 |
1/8<L<1/4 |
|
2 |
0.0625 |
0.125 |
1/16<L<1/8 |
|
1 |
0.0312 |
0.0625 |
1/32<L<1/16 |
|
0 |
<0.0312 |
L<1/32 |
|
The RAMCAP proprietary approach details and the specific results obtained by the DHS with the application of this approach on several critical sectors are not yet completely public and, for some aspects, probably this information are classified.
The MRAM described in this paper is an attempt to provide the basic elements of a non-proprietary-method to apply when complex technical and political decisions have to be taken in different operating scenarios and in presence of almost whatever threat or hazard.
It is easy to understand that the major level of criticality in the application of the MRAM, as in the RAMCAP, is in the selection of the vulnerability and threat levels for each risk. For this reason, in the analysis of each type of risk, it is necessary to engage in the Assessment Team experts of the specific risk considered and of the intelligence field for the vulnerability level and the threat level evaluations, respectively.
The MRAM has been during the years interested by software implementation of tool. Example of software available on the shelf that adopted the MRAM are: Self Safety Planner (SSP), Gestione dei Piani di Emergenza Comunali (GPEC) and TEGIS provided by the Italian firms Servizi Professional Innovative srl, http://www.servizipi.it/.
Hence; the first application of this medod has been proposed several years ago in Self Safety Planner – SSP - that is a Decision Support System for territorial risk classification and assessment.
These tools aim to facilitate the cooperation of all the Italian actors involved in risk management and supports municipalities, Ministry of Interior authorities and Civil Protection organizations in risk assessment processes, through the preparation and dissemination of municipal emergency plans. The tolls in practice are a Decision Support System for territorial risk classification and assessment.
The application allows us to list risks which the territory is exposed to, by using MRAM for the risk assessment.
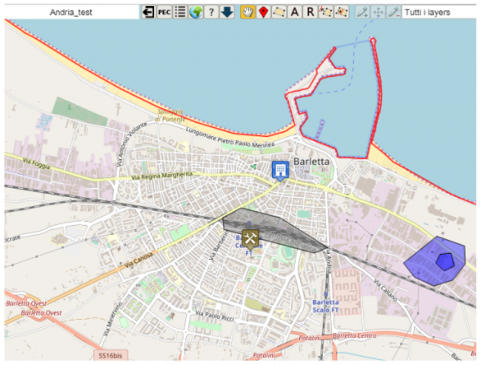
SSP is a software as a service tool accessed via a web browser. It is developed with Java language and uses, inter alia, the freely available Open Street Map (OSM) geodata: in Figure 1 a simple application of the SW for the Barletta city (Apulia, Italy) is shown. In fig.1 the different Critical Areas are depicted in the Barletta old town and in the industrial area of the city. In any Critical Area it is possible to characterize a potential risk.
Figure 1. Example of software window for city of Barletta, Italy
The software, based on MRAM approach, evaluates the qualitative value of the risk level of more than 60 different possible threats on the identified Critical Areas.
Threats are mapped and risk priorities are highlighted through a chromatic classification, as presented in the previous sections.
The qualitative risk level and impact level, respectively, are directly calculated by the system on the basis of risk assessment expert data input and MRAM algorithm.
As an example of practical application of the MRAM approach and of the creation of a rank of risks in a specific part of a territory, we can highlight the Civil Protection Plan of Marino town (Rome, Italy) [19] in which the MRAM is adapted [20] for civil protection application to the territory creating after the analysis in [19], page 105, a rank for 21 different risks that are incumbent in the municipality and that are distributed from the higher level of risk (level 17) to the lower (risk level 6) in the rank.
The Multi-Risk Assessment Method was presented and illustrated. The method is suitable to estimate both impact and risk in qualitative, semi-quantitative and quantitative fashion for catastrophic or calamitous events, including terrorist non-conventional CBRNe attacks.
The MRAM allows to manage and analyze different kinds of risk (all-hazards/threats approach) being useful for identifying and prioritizing actions and investments in preparedness, protection and resilience of critical areas and critical infrastructures.
The method is focused on the safety of the population (fatalities and casualties), although a similar approach can be adopted to estimate even the economic risk.
A vulnerability reduction assessment approach was presented as well.
Finally, an analysis of the relation of the proposed method MRAM with the USA RAMCAP approach adopted by Department of Homeland Security was carried out and the software implementation of the MRAM approach was illustrated the case of an Italian local administration emergency plan.
MRAM=Multi-Risk Assessment Method
CBRNe=Chemical Biological Radiological Nuclear explosive
DHS=Department of Homeland Security
ISO=International Standard Organization
VRF=Vulnerability Reduction Factor
|
R |
Risk (consequence/time) |
|
I |
Impact (consequence/event) |
|
T |
Threat probability (event/time) |
|
E |
Exposure (total asset/event) |
|
V |
Vulnerability (dimentionless 0≤V≤1) |
[1] ISO 31000. (2018). Risk management -- Principles and guidelines, International Organization for Standardization. Last edition
[2] ISO 31010 Standard (2019). Risk management — Risk assessment techniques
[3] DHS. (2006). National Infrastructure Protection Plan. Homeland Security Dept. https://www.hsdl.org/?abstract&did=464612.
[4] United Nation Office for Disaster Risk reduction. (2017). National Disaster Risk Assessment: Governance System, Methodologies, and Use of Results. Consultative Version. https://www.unisdr.org/files/globalplatform/591f213cf2fbe52828_wordsintoactionguideline.nationaldi.pdf.
[5] European commission staff working paper (2010). Risk Assessment and Mapping Guidelines for Disaster Management. Brussels. https://ec.europa.eu/echo/files/about/COMM_PDF_SEC_2010_1626_F_staff_working_document_en.pdf.
[6] DHS. (2013). NIPP 2013 Partnering for Critical Infrastructure Security and Resilience. https://www.cisa.gov/publication/nipp-2013-partnering-critical-infrastructure-security-and-resilience.
[7] DHS. (2013). NIPP2013 Supplemental Tool: Executing A Critical Infrastructure Risk Management Approach. https://www.cisa.gov/publication/nipp-2013-ci-risk-management-approach.
[8] Poljanšek, K., Marin Ferrer, M., De Groeve, T., Clark, I. (2017). Science for disaster risk management 2017: knowing better and losing less. EUR 28034 EN. Publications Office of the European Union, Luxembourg. https://doi.org/10.2788/842809
[9] Carbonelli, M, Gratta, L. (2014). Risk management Part 2: The GC method for Risk Assessment and Impact Analysis. Lecture document of CBRNe Master Course 2014, University of Tor Vergata, Rome.
[10] Federal Emergency Management Agency. (2005). Risk Assessment: A How-To Guide to Mitigate Potential Terrorist Attacks Against Buildings. Risk Management Series, FEMA 452. https://www.fema.gov/media-library-data/20130726-1524-20490-7497/fema452_cov_toc.pdf.
[11] ASME. (2005). Risk Analysis and Management for Critical Asset Protection: executive summary, ASME Innovative Technologies Institute, Washington (US).
[12] ASME. (2005). Risk Analysis and Management for Critical Asset Protection: the framework, ASME Innovative Technologies Institute, Washington (US).
[13] ASME. (2009). Prioritizing Critical Infrastructures Using the RAMCAP Plus Approach, ASME Innovative Technologies Institute, Washington (US).
[14] Carbonelli, M. (2019). Terrorist attacks and natural/anthropic disasters: risk analysis methodologies for supporting security decision making actors. Aracne CBRN Series, Rome.
[15] ASME Innovative Technologies Institute, Washington (US). (2005). Risk Analysis and Management for Critical Asset Protection: executive summary.
[16] ASME Innovative Technologies Institute, Washington (US). (2009). Prioritizing Critical Infrastructures Using the RAMCAP Plus Approach.
[17] ASME Innovative Technologies Institute, Washington (US). (2005). Risk Analysis and Management for Critical Asset Protection: the framework.
[18] DHS. (2006). National Infrastructure Protection Plan. 36.
[19] Marino Municipality Emergency Plan. (2016). Piano di Emergenza Comunale. https://www.comune.marino.rm.gov.it/sites/default/files/1-pecmarino2016-11-15-finale.pdf.
[20] Marino Municipality Emergency Plan. (2016). Annex H: Metodologia speditiva per la valutazione del rischio. https://www.comune.marino.rm.gov.it/sites/default/files/9-pec2016-all_h.pdf.