Walid Attia | Sherif Elwan | Ismail Kotb*
© 2021 IIETA. This article is published by IIETA and is licensed under the CC BY 4.0 license (http://creativecommons.org/licenses/by/4.0/).
OPEN ACCESS
Evaluating the performance of several types of reinforced concrete barrier walls subjected to blast loads is the target of this research paper. A parametric study is carried out for nine RC barrier wall systems with different geometries modelled in the three dimensions with different configurations and variable parameters. ANSYS Autodyn software version 18.2 is used to model and analyse these systems using three-dimensional explicit dynamics analysis. The nine systems are studied under the effect of several parameters, such as explosive charge weight (W) and the stand-off distance from the explosion source to the wall (R). Their effect on the wall damage and its deformations and the pressure-induced at different locations are analysed. Eighteen reinforced concrete barrier wall models are studied to achieve this research goal. Comparisons between the results showed the deformation performance of the 60° concave face with planar back walls and the walls with the constant base of 1.0-meter-thick up to 0.5-meter-high with a face hunch up to 2.0-meter-high are better than all other studied walls. However, the concave face-convex back wall that has 70° curvature mitigate the pressure behind the wall by 10% regardless of its deformation.
explosion, blast waves, ANSYS Autodyn®, explicit dynamic finite element analysis, reinforced concrete barrier walls, TNT
1.1 General
Structures are mainly designed to endure various types of the considered static and dynamic loads as the main design concept to make buildings safe and prevent them from collapsing. The economic constraints on constructing structures control the design philosophy of the loads to be considered through the design process. The principle of designing structures to withstand natural disasters is well-recognised in the design codes. There is a plethora of historical and numerical statistics and probability correlated with the frequency, period, and severity of natural disasters. On the other hand, one of the unconsidered loads during the ordinary design processes is the blast load, which can be only considered in the critical structures (e.g., governmental buildings, embassies, police stations, and power plants). These structures are designed based on contextual criteria determining organisational needs, response operations and impacts, and damage.
The philosophy of a blast-resistant design is that a structure should resist blast load waves without collapse but with some damages to assure a veritable and frugal design. Consistent with this philosophy, the structure behaviour and material status would be changed during and after the action of the blast load. The study of blast loading had attracted significant attention during World War II, especially when the nuclear bomb invention went out to the light. These studies were established and first introduced by Taylor [1], who was the first to explain the nuclear test (Trinity) of the first atomic bomb, which has exploded in the desert near Alamogordo in New Mexico in 1945. Taylor’s research was concerned with analysing the energy released from the blast using the numerical solution and experimental data. After that, Sedov [2] derived a model of blast wave propagation from a source and a gas surrounding medium. Also, Neumann [3] analysed and proposed a general formulation for the propagation of the blast waves.
Since these times, the twentieth century has faced a rise of terrific and catastrophic explosion events worldwide. There was not a reliable or detailed criterion for designing protective facilities until the endings of the 1960s. The defence department of the U.S.A. set up the Unified Facilities Criteria program to design and construct structures to resist explosions and to protect human souls, public facilities, and private properties. The first publishing of “Structures to Resist the Effects of Accidental Explosions” [4] reference was printed in 1969 to provide clear design guidelines using reinforced concrete as the primary construction material. After the first publication, continuous research and comprehensive developments were made to publish other manuals like [5], to develop newer editions of the original manual [6], and to introduce different explosive resistant materials in the last edition [7]. Besides, the U.S.A. Department of Homeland Security also published the manual FEMA 426 [8], aiming to reduce physical harm to humans and destroy facilities because of terrorist attacks.
1.2 Problem statement
The technological development facilitated the circulation of open-access information about the manufacture of explosive devices in the hands of public usage. These open sources attracted terrorist groups to misuse them to manufacture remote-controlled explosive devices and explosives-laden vehicles that significantly threaten facilities and terrorise citizens. Accidental explosions are also a part of the blast load, posing a risk to structures, although these are less likely to occur. As a result, installing protective structures to provide sufficient stand-off distance (anti-ram barriers, wall barriers, bollards) become the most common solution to neutralise these hazards. One restraint to execute this scenario is the dense urban environments, as increasing vehicle stand-off distance is difficult to achieve. Consequently, the usage of barrier walls for blast effects mitigation will reduce the required stand-off distance and save the costs of blast retrofit requirements for structures.
One option to protect vital structures is to provide reinforced concrete barrier walls on their physical perimeter. Concrete is commonly used in infrastructure and defensive structures because of its prominent energy absorption characteristics against high-stress levels. Concrete barriers have also been used in many constructions because of their economic cost, good quality, and fast installation. It is crucial to fulfil suitable design criteria and specifications when developing a protective structure and recognise potential threats consequences for ensuring the pattern of the applied design load.
The widely used type of barrier wall to protect structures is reinforced concrete barrier wall. The geometry of this barrier wall should be heavy and rely on its mass to maintain its stability to withstand the impact of blast loads, as it is installed directly by fixing it into the ground or resting it over the surface of the ground. It is crucial to investigate the response and behaviour of different geometries of blast-resistant barrier walls under the effect of different weights of explosive charges when considering their stability under the influence of hemispherical charge explosion over the surface of the ground.
1.3 Literature survey
Many researchers have researched the blast loading resistant structures that focused on the types and behaviour of reinforced concrete structures under the effect of explosions. Yusof et al. [9] presented an analytical study to examine the behaviour of blast-resistant reinforced concrete walls that are subjected to blast loadings using ANSYS AUTODYN. These walls were exposed to four different charge weights of TNT (5, 50, 400, and 1500 kg) at a fixed stand-off distance of 2 meters. The researchers selected four control points on the wall to measure outputs. The analysis results showed that these walls are safe to face 5-and 50-kg of TNT explosions. On the other hand, they will be destroyed due to 400-and 1500-kg of TNT explosions. Nonetheless, these walls were not designed to be indestructible to any size of explosions, as they can only endure a portion of the damage, or they can be destroyed for the greater good of saving human lives and structures safety.
Ramanujan and Lekshmi [10] conducted an analytical study to investigate the effect of blast loadings on the response of blast-resistant walls using ANSYS AUTODYN 3D finite element software. The studied walls have the exact dimensions and materials properties that Yusof uses [9], but the difference is the modelling of these walls with/without the usage of GFRP wrapping. These walls were exposed to the same four different charge weights of TNT (5, 50, 400, and 1500 kg), but they are placed at two different stand-off distances of 1.7 and 2 m. The analysis results showed that the wall wrapped with GFRP performed better in resisting the incoming damages of the explosion. The level of explosion resistance of the GFRP wrapped wall is efficient in large TNT charge weights.
Abdel-Mooty et al. [11] carried out an analytical study to examine the response of one-way reinforced concrete walls that are subjected to blast loads using ANSYS AUTODYN software. First of all, a validation model was simulated; this panel was exposed to a pressure of 5.059 MPa. The model results were very identical to what occurred at the experimental work of Razaqpur et al. [12]. Then, the studied walls were exposed to three different reflected peak pressures of 4, 12, and 23.5 MPa with 100 kg as TNT explosive charge. The results showed that the compressive strength of concrete has a less substantial effect on the maximum deformation. On the contrary, this change reduces the damage percentage of the wall.
Al-Zuhairi and Qasim [13] presented an analytical study to investigate the behaviour of rectangular blast-resistant reinforced concrete barriers subjected to blast loadings using ANSYS AUTODYN. These barriers were exposed to two different TNT charge weights of 50 and 400 kg placed at a fixed stand-off distance of 2 meters and a height of 1.5 m from the ground face. The researchers selected three control points on the wall to estimate the outputs. The analysis results showed that these walls have good behaviour in resisting 50 kg of TNT explosion, but they will collapse in 400 kg TNT.
Tiwari et al. [14] presented an analytical study to investigate the behaviour of different shapes of rectangular plain concrete walls (with/without steel plate cladding) against blast loading using ANSYS AUTODYN. These walls were exposed to an equivalent TNT charge weight of 100 kg placed at a fixed stand-off distance of 3.0 m and a height of 1.0 m above the ground. A gauge point is defined at the centre of each wall. The analysis results showed an insignificant variation of deformation compared to ascendant researches of Sun [15] and Lin et al. [16]. These comparison percentages ensure the high fidelity of the researchers’ analytical model.
Fekry et al. [17] conducted an analytical study to investigate the response of various cantilever steel plate protective panels with air or concrete fillers subjected to blast loadings using ANSYS AUTODYN software. These barriers were exposed to an equivalent TNT charge weight of 50 kg placed at a fixed stand-off distance of 1.0 m. The analysis results showed that a solid face barrier prevents 94% of the blast load damage, as the blast load is transferred using air-filled plates, while the load is shared in the case of concrete-filled plates. Finally, these panels endured a 50 kg TNT explosion without complete failure.
1.4 Objective and scope of the research
None of those mentioned above studies has investigated the impact of changing the geometry of the concrete element on its performance in resisting the incoming blast load. So in this study, several geometries of blast-resistant reinforced concrete barrier walls are investigated under the effect of blast loads caused by the detonation of explosive charge utilising the explicit dynamics finite element analysis by the ANSYS AUTODYN Version 18.2 software program to evaluate the response of the studied walls systems. Various parameters are studied, such as charge weight of 50 and 400 kg of TNT explosive material located at the ground surface at two meters away from the wall. The research results show that these walls cannot be blown down by a 50 kg and below of TNT. However, the maximum recorded pressure behind the walls can harm humans and damage structures. The detonation of 400 kg of TNT at a zero stand-off distance can destroy the studied walls. However, all of the geometries of the walls survived this charge weight while increasing the stand-off distance except the first two geometries of the third group. It can be assured from the current work that changing the wall geometry and its angle of curvature has a remarkable effect on improving the wall performance to mitigate the potential threat of terrorist attacks against structures.
The main content of this research paper consists of four main sections; EXPLOSION PROCESS, METHODOLOGY, RESULTS OF THE ANALYSIS, and CONCLUSIONS.
2.1 Definition
An explosion is defined as physical and chemical reactions of solids, liquids, or gases that result in a sudden, rapid, and large-scale burst of energy with high pressure, expanded gas, load sound, high temperature, and fragments [18]. This process usually occurs as a result of terrorist bomb attacks, explosive equipment, or accidental explosions. The detonation of a bomb results in the propagation of gas pressure waves, known as the blast waves, which travel at supersonic speed in all directions through the medium causes it to be compressed. These waves affect the surrounding structures causing damages proportionate with the wave amplitude and intensity. The blast waves’ intensity varies according to the explosive charge weight and the detonation stand-off distance [19].
2.2 Explosions nature
The explosions types are different according to their nature as physical, chemical, and nuclear ones. Physical explosions can occur from natural catastrophic rapture, i.e. volcanic eruptions or sudden material phase change from liquid to vapour under high pressure; the release of pressured material allows it to expand and form shock waves. In vessels of stored liquids under pressure above the atmospheric pressure, in case of bursting, the liquid expands, vaporises supersonically, and explodes, forming shock waves [20].
Chemical explosions can occur from decomposition or combination reactions that release a tremendous amount of energy. The decomposition reaction usually occurs between materials contain oxygen; their decomposition produces high-temperature gases with large volume. The supersonic increase in the gas volume generates the shock wave, i.e. materials such as trinitrotoluene (TNT) and nitro-glycerine. On the other hand, combinations reactions occur between materials that react exothermically to produce high-temperature gases with large volumes. This type of reaction takes more time than decomposition reactions, so the mixed materials should be chosen wisely to ensure the continuity of the reaction till the end, i.e. ammonium nitrate and fuel oil (ANFO), gunpowder (potassium nitrate, carbon, and sulphur), and fireworks. As the explosion reaction time is inversely proportional to the strength of the explosion, the decomposition reactions are more destructive than combination reactions, which is why decomposition reactions are more widely used [21].
Moreover, nuclear explosions are very rapid reactions between atoms and neutrons in a matter of a millionth of a second to generate massive heat cause the air to expand and form the blast waves.
2.3 Explosions physical state and ignition sensitivity
Explosive materials are also differentiated according to their physical state, speed of reactions, and sensitivity to ignition. The material’s physical state is classified as solids, liquids, or gases. The sensitivity to ignition is classified as primary, secondary, and tertiary explosives, and the speed of reactions that move through the material is classified as high explosives and low explosives. For the detonation sensitivity, the material ignited by a bit of heat or pressure like a spark or a shock is classified as primary explosives. On the other hand, the material that needs to be ignited by insensitive heat, pressure, or primary explosive use as igniter is classified as secondary explosives, which is safer to handle and use. The third type is tertiary explosives, which require secondary explosives boosters to be ignited due to their shock intensity, and it is used in mining and construction processes.
According to the speed of reactions, the burst usually occurs as a result of high explosives detonation. Alternatively, deflagration occurs due to low explosives reaction. Solid explosives are considered high explosives, and from the detonation sensitivity perspective, materials like lead azide, lead styphnate, and mercury fulminate are categorised as primary explosives. Moreover, a material like ammonium nitrate fuel oil (ANFO) is categorised as a tertiary explosive if its reactions are low. Finally, materials like trinitrotoluene (TNT) and cyclonite (RDX) are categorised as secondary explosives, and they are also classified as high explosive materials [22].
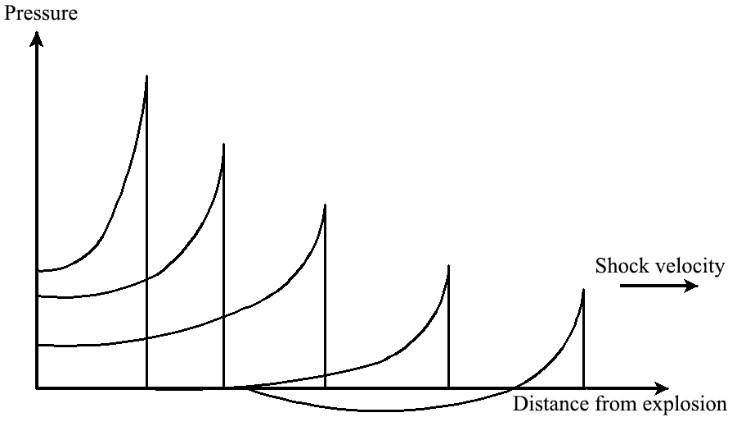
High explosives detonation can generate extreme heat that expands the gases released from the reactions; they led to the expansion of the gas volume to produce colossal pressure. This pressure can reach up to 100-300 kilo bar, and the heat generated can reach up to 3000-4000℃. The pressurised gases create blast waves as layers of compressed air are generated as the force and energy released by the explosion. The blast wave pressure rises over the normal ambient atmospheric pressure at a point on the wave related to some distance away from the explosion source, and that is called the overpressure. Then, this pressure decays as the wave expands away from the source, as the pressure may decrease to reach a value that is less than the normal ambient pressure to create a negative phase of the blast wave. This phase of the wave acts as suction and creates a partial air vacuum, which results in the scattering of shrapnel and fragments away from the explosion source, as shown in Figure 1.
Figure 1. Blast wave pressure and distance from explosion relationship, [22]
2.4 Explosions confinement
The explosions types are different according to their place of occurrence referring to structure, as they are classified as unconfined and confined explosions. Unconfined or burst explosions occur outside the structure. On the opposite, confined or internal explosions occur inside the structure.
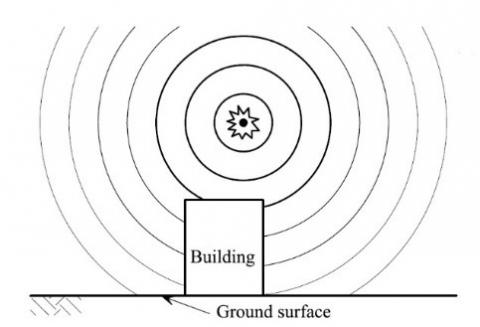
The unconfined explosions are classified as free-air burst, near ground airburst, and ground burst. The free air explosions happen far from the ground surface, as shown in Figure 2.
Figure 2. Free-air burst explosion, [23]
The ground surface does not amplify the blast waves, and they are only reflected by hitting a structure.
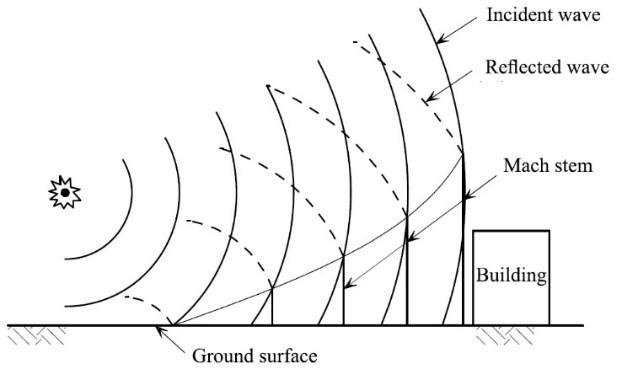
The near-ground air burst is different because ground surface reflections amplify the blast waves before the waves hit an object. The amplification of the waves away from the ground results from the overlapping of the original waves with the reflected ones to form a Mach stem (an amplified shock) with the exact wave magnitude as shown in Figure 3.
Figure 3. Airburst with ground surface reflections, [23]
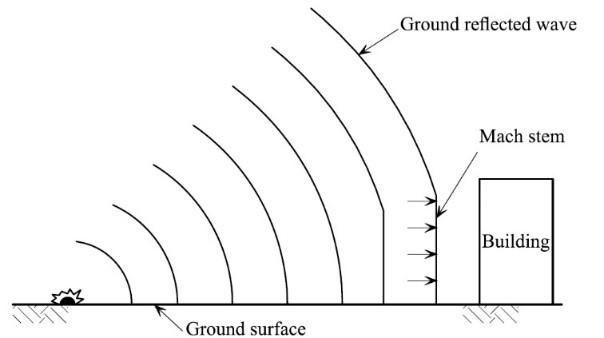
The ground burst occurs on the ground surface, as the immediate blast wave is reflected away and enhanced to create a new amplified wave. The amplified waves join the original waves to form new waves and create a hemispherical shock front, as shown in Figure 4. This type of unconfined explosion is the closest to the reality touristic attacks, which take place around structures and near to the ground surface.
Figure 4. Ground surface burst, [23]
Confined explosions occur when an explosion takes place inside a structure, the blast waves are amplified using their reflections inwards the structure. The level of confinement affects explosions outcomes, such as temperature, the volume of gases, and the increment of pressure inside the structure. Confined explosions are classified according to vents around the structure into three major categories. Fully vented explosions resulted when a structure has single or multiple parts exposed to the atmosphere, and the blast waves spread away using the open vent way. Partially vented explosions resulted when a structure has limited open vents, and the blast waves are spread outside by time. The fully confined explosion resulted when a structure has a complete inclusion by walls or surfaces. The three classifications of confined explosions are shown in Figure 5.
Figure 5. Fully vented, partially vented, and fully confined explosions [23]
2.5 Incident blast waves characteristics
After an explosion, the blast waves travel into the surrounding medium until they hit any other object with a different density than the original one; this makes the waves reflect in another way. The transferring medium is already compressed due to blast waves, and their impact on objects makes them be compressed again. As a result of this, a new blast wave is created, and it is greater than the initial blast wave [24]. The Unified Facilities Criteria describe this wave pressure-time history; the wave is divided into three segments. The first is that the ambient pressure increases instantly to its peak value (pso), then it decays to reach the normal ambient pressure (po) at the positive phase of the wave time (to). The subsequent wave phase is the negative or suction phase; the pressure at this phase is negative (pso), lower than the normal ambient pressure. This negative pressure (pso) has a lower amplitude than the positive pressure, and the time of this phase is much longer than the positive phase. The wave is ended when the medium pressure is neutralised to its original ambient pressure and equilibrium state, as shown in Figure 6.
Figure 6. Blast wave pressure-time history, UFC3-340-02, [7]
2.5.1 Blast wave scaling laws
The parameters of blast waves generated by an explosion depend on the physical characteristics of the explosion source, the energy released from it, and the properties of the transferring medium. Many experiments are made using controlled explosions under certain conditions to collect data and establish a reference for other non-ideal explosions. Hopkinson [25] and Cranz et al. [26] established the cube root scaling law, which is the most common method to blast wave scaling.
$Z=\frac{R}{W^{1 / 3}}$ (1)
2.5.2 Determination of blast wave pressure
Sadovskiy [27] presented an equation to obtain the peak overpressure based on an explosions data study.
$\mathrm{P}_{\mathrm{so}}=0.085 \frac{\mathrm{W}^{1 / 3}}{\mathrm{R}}+0.3\left(\frac{\mathrm{W}^{1 / 3}}{\mathrm{R}}\right)^{2}+0.8\left(\frac{\mathrm{W}^{1 / 3}}{\mathrm{R}}\right)^{3}(\mathrm{MPa})$ (2)
2.5.3 Determination of blast wave duration
The time elapsed between the end of the shock front of a blast wave and its positive pressure phase end reaching the zero overpressure. Both the magnitude and duration of blast waves are significant aspects in the prediction of expected damage. Sadovskiy [27], as well, proposed an equation to calculate the time duration of positive overpressure.
$\mathrm{t}_{\text {pos }}=1.2 \sqrt[6]{\mathrm{W}} \sqrt{\mathrm{R}}(\mathrm{ms})$ (3)
2.5.4 Determination of positive impulse
This explosion parameter is essential for examining blast damage. Impulse parameter (I) is defined as the area under the pressure-time curve. Sadovskiy [27] presented an equation to calculate the blast wave positive impulse as,
$\mathrm{I}_{\mathrm{pos}}=200 \frac{\mathrm{W}^{1 / 3}}{\mathrm{R}}(\mathrm{Pa}-\mathrm{s})$ (4)
2.5.5 Determination of under pressure phase parameters
This parameter is important for flexible structures, on the opposite; it is less affecting the rigid structures. Krauthammer and Altenberg [28] proposed these after mentioned equations to calculate the blast wave negative pressure and duration.
$\mathrm{P}_{\text {neg }}=\frac{0.35}{Z} 10^{5} \mathrm{~Pa}(\mathrm{Z}>3.5)$ (5a)
$\mathrm{P}_{\text {neg }}=10^{4} \quad \mathrm{~Pa}(\mathrm{Z}<3.5)$ (5b)
$\mathrm{t}_{\mathrm{neg}}=0.0104 \mathrm{~W}^{1 / 3} \mathrm{~S}(\mathrm{Z}<0.3)$ (6a)
$\mathrm{t}_{\mathrm{neg}}=\left(0.003125 \log _{10} \mathrm{Z}+0.01201\right) \mathrm{W}^{1 / 3} \mathrm{~s}(1.9<\mathrm{Z}>0.3)$ (6b)
$\mathrm{t}_{\mathrm{neg}}=0.0139 \mathrm{~W}^{1 / 3} \mathrm{~s}(\mathrm{Z}>1.9)$ (6c)
This section presents procedures to model the reinforced concrete blast-resistant walls, design them, and evaluate their performance. The following study will examine the behaviour of these reinforced concrete blast-resistant walls using different geometries to reflect the real-life cases in Egypt and around the world. The dimensions and reinforcement ratio of the walls were checked with the provisions of the Egyptian code for the design and construction of reinforced concrete buildings ECP-203 (2018) [29]. The primary purpose of these walls is to protect important buildings and structures. The installation of these walls is conducted by placing them on the ground surface in a side-to-side orientation. The properties of the studied walls, design methodology, dynamic analysis procedures, and performance evaluation have been conducted using the mathematical model of structures utilising computer-integrated software. In this parametric study, the used software is ANSYS AUTODYN finite element software for the dynamic structural analysis.
3.1 Configuration
Different types of reinforced concrete blast-resistant walls are studied. The wall is subjected to two different TNT explosive charges with weights of 50 kg (car bomb) and 400 kg (van bomb) located on the ground surface at a stand-off distance of 2.0 meters. The walls are rested over the ground surface and allowed to slide or overturn to examine their stability. The mathematical models, which represent the original walls in simulation software, are divided into three categories according to their geometry and position:
1) Concave face with convex back reinforced concrete blast-resistant walls with different angles of curvature.
2) Concave face with planar back reinforced concrete blast-resistant walls with different angles of curvature.
3) Hunched base with planar back reinforced concrete blast-resistant walls.
3.2 Geometry
3.2.1 The first group
Figure 7. Dimensions of RC barrier wall of the first group
The first group of walls is a curved barrier wall with a concave side facing the incoming threats and a convex back facing the protected facility. The concrete dimensions of these walls are 3.0 meters in height and 1.0-meter width, and the thickness of the wall varies from 1.0 meters at the base to 0.2 meters at the top in a prismatic, curved shape. The concave side has different angles of curvature (50°, 60°, and 70°); while the convex backside has angles of curvature (28°, 38°, and 48°). The inner concave curve has radiuses of (3.33, 2.85, and 2.47 meters), while the outer concave curve has radiuses of (6.64, 4.69, and 3.74 meters) as shown in Figure 7. Their cross-sectional areas are 1.241, 1.2352, and 1.3223 m2, respectively. The walls are reinforced on both sides by a steel mesh of 12 mm steel bars spaced by 10 cm. The walls in this group are named “CFCBW” during this study.
3.2.2 The second group
The second group of walls is a curved barrier wall with a concave side facing the incoming threats and a planar vertical back facing the protected facility. The concrete dimensions of these walls are 3.0 meters in height and 1.0-meter width, and the thickness of the wall varies from 1.0 meters at the base to 0.2 meters at the top in a prismatic, curved shape. The concave side has different angles of curvature (30°, 40°, and 50°) with inner concave curve radiuses of (6.03, 4.58, and 3.66 meters) as shown in Figure 8. Their cross-sectional areas are 1.0773, 1.236, and 1.3779 m2, respectively. The walls are reinforced on both sides by a steel mesh of 12 mm steel bars spaced by 10 cm. The walls in this group are named “CFPBW” during this study.
Figure 8. Dimensions of RC barrier walls of the second group
3.2.3 The third group
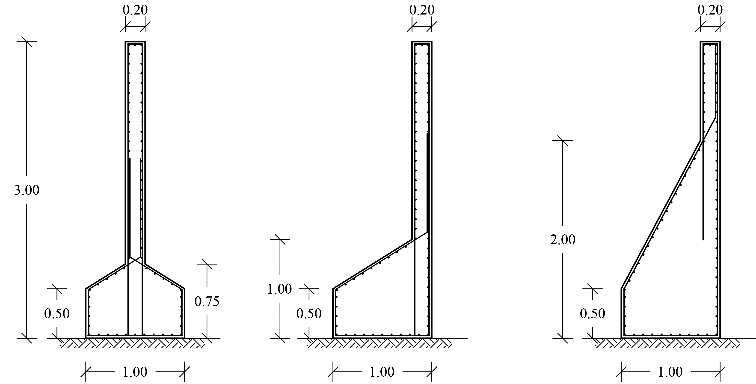
Figure 9. Dimensions of RC barrier wall of the third group
The third group of walls is hunched barrier with three different geometries: the first one of the 1.0-meter base up to 0.5-meter-high, then the cross-section is hunched for both sides of the wall faces up to 0.75 high to reach a value of 0.2-meter thickness. Then, the cross-section is straight constant up to the rest of the wall height. The second geometry is a constant base to the incoming threats of 1.0-meter-thick up to 0.5 high of the wall, then the cross-section is hunched for one side of the wall faces up to 1.0 high to reach a value of 0.2-meter thickness. Then, a planar vertical back facing the protected facility of 0.2 meters up to the rest of the wall height. The third geometry constant base of 1.0-meter-thick up to 0.5-meter-high of the wall, then the cross-section is hunched for one side of the wall faces up to 2.0 high to reach a value of 0.2-meter thickness. Then, a planar vertical thickness of 0.2 meters up to the rest of the wall height, as shown in Figure 9. Their cross-sectional areas are 1.20, 1.20, and 1.60 m2, respectively. The walls are reinforced on both sides by a steel mesh of 12 mm steel bars spaced by 10 cm. The walls in this group are named “HFPBW” during this study.
The three studied groups models are presented in Table 1, showing the wall mark, the number of the study group, the TNT charge weights, stand-off distance, and calculated scaled distance. The wall mark is written as (wall group name reference-case study-charge weight-stand-off distance).
Table 1. Details of the proposed models for the study
|
Wall mark |
Study group |
TNT charge weight (kg) |
Stand-off distance (m) |
Scaled distance (m.kg-1/3) |
|
CFCBW-A-50-2 |
1 |
50.0 |
2.0 |
0.585 |
|
CFCBW-B-50-2 |
||||
|
CFCBW-C-50-2 |
||||
|
CFCBW-A-400-2 |
400.0 |
1.212 |
||
|
CFCBW-B-400-2 |
||||
|
CFCBW-C-400-2 |
||||
|
CFPBW-A-50-2 |
2 |
50.0 |
0.585 |
|
|
CFPBW-B-50-2 |
||||
|
CFPBW-C-50-2 |
||||
|
CFPBW-A-400-2 |
400.0 |
1.212 |
||
|
CFPBW-B-400-2 |
||||
|
CFPBW-C-400-2 |
||||
|
CFPBW-A-50-2 |
3 |
50.0 |
0.585 |
|
|
CFPBW-B-50-2 |
||||
|
CFPBW-C-50-2 |
||||
|
CFPBW-A-400-2 |
400.0 |
1.212 |
||
|
CFPBW-B-400-2 |
||||
|
CFPBW-C-400-2 |
3.3 Software modelling approach
ANSYS Workbench version 18.2 is a commercially available finite element modelling software program that uses the object-based concept to represent the actual structure as a perfectly natural model made in a graphical user interface. The model consists of traditional finite elements joints (nodes), lines (line bodies), and solids (bodies) objects to provide an easy way to model almost any kind of structure in either two or three-dimensional. The model geometry is first drawn in the Workbench - Design Modeler. The geometry is exported to ANSYS Workbench - Mechanical [AUTODYN PrepPost] to assign the analysis settings such as; meshing of elements, boundary condition, domain dimensions, detonation point, and detonation time. Finally, the model is exported again to ANSYS AUTODYN [30] to finalise the material properties and set the model to be solved. When the analysis is run, AUTODYN automatically converts the object-based model into an element-based model for analysis. This element-based model is called the analysis model, which can be solved in an interactive analysis to show the results while the calculation process is proceeding. When the analysis is finished, the final results of the analysis are displayed on the model. AUTODYN provides the analysis tool for the explicit dynamics’ problems; it is carried out by subjecting a detonation of an explosive material to examine its effect on a targeted structure during an incrementing analysis time, and the user-defined parameters are monitored during the duration of the analysis.
3.4 Material modelling
For explicit dynamics analysis to be carried out, materials nonlinearity must be considered in the modelling process. The definition of new constitutive materials or modifying existing ones is made to match the experimental provisions by the design code, such as concrete and high-grade steel bars. As well, other materials will be defined, such as; explosive material and air medium. The definition includes the equation of state, strength model, failure model, erosion criteria, and the most effective property of the material nonlinearity.
3.4.1 Concrete material
The concrete material used in the AUTODYN model representation of the wall barriers has a unit weight of 2.75 t/m³ and a characteristic strength of 35 MPa. The rest of the concrete material specifications and input parameters are defined in the AUTODYN material data input. The parameters for EOS, strength model, failure model, and erosion criteria used in the simulation are stated in Table 2.
Table 2. Material parameters for the used concrete material
|
Reference density (ρref) [Tons/m3] |
2.75 |
|
Equation of state |
P-alpha |
|
Bulk modulus (A1) [GPa] |
35.27 |
|
Strength model |
RHT |
|
Shear modulus (G) [GPa] |
16.70 |
|
compressive strength (fc) [MPa] |
35.0 |
|
Ratio of static tensile to compressive strength (ft/fc) [–] |
0.1 |
|
Ratio of shear to compressive strength (fs/fc) [–] |
0.18 |
|
Intact failure surface constant (A) [–] |
1.60 |
|
Intact failure surface exponent (N) [–] |
0.61 |
|
Ratio of tensile to compressive meridian [–] |
0.6805 |
|
Brittle to ductile transition behaviour [–] |
0.0105 |
|
Ratio of elastic shear modulus to the difference between elastic and plastic shear modulus [–] |
2.0 |
|
Ratio of elastic to static tensile strength of concrete |
0.70 |
|
Ratio of elastic to static compressive strength of concrete [–] |
0.53 |
|
Fractured strength constant (B) [–] |
1.60 |
|
Fractured strength exponent (M) [–] |
0.61 |
|
Compressive strain rate exponent [–] |
0.032 |
|
Tensile strain rate exponent [–] |
0.036 |
|
Failure criterion |
RHT |
|
Damage parameter (D1) [–] |
0.04 |
|
Damage parameter (D2) [–] |
1.0 |
|
Minimum strain to failure [–] |
0.01 |
|
Residual shear modulus fraction |
0.13 |
|
Tensile failure |
Hydro |
|
Erosion criterion |
Geometric strain |
|
Erosion strain [–] |
2.0 |
|
Ratio of elastic to static compressive strength of concrete [–] |
0.53 |
3.4.2 High-grade steel bars
The steel material used in the AUTODYN model representation of the wall barriers reinforcement has a unit weight of 7.83 t/m³ and yield stress of 400 MPa. These material properties must reflect the elastoplastic behaviour of the steel bars. The rest of the steel material specifications and input parameters are defined in the AUTODYN material data input. The parameters for EOS, strength model, failure model, and erosion criteria of the steel material used in the simulation are given in Table 3.
Table 3. Material parameters for the used steel material
|
Reference density (ρref) [Tons/m3] |
7.83 |
|
Equation of state |
Linear |
|
Bulk modulus (A1) [GPa] |
200.0 |
|
Strength model |
Johnson-Cook |
|
Shear modulus (G) [GPa] |
77.0 |
|
yield stress (A) [MPa] |
400.0 |
|
Hardening constant (B) [MPa] |
275.0 |
|
Hardening exponent (n) [–] |
0.36 |
|
Strain rate constant (C) [–] |
0.022 |
|
Thermal softening exponent (m) [–] |
1.0 |
|
Failure criterion |
Plastic strain |
|
Damage constant (D5) [–] |
0.126 |
|
Erosion criterion |
Geometric strain |
|
Erosion strain [–] |
2.0 |
3.4.3 Explosive material and air medium
As mentioned before, the TNT explosive material will be used as the primary source of explosion energy. High explosives are typically represented using the Jones-Wilkins-Lee (JWL) EOS to simulate the pressure generated energy that resulted in an explosion. The TNT material constants and input parameters are defined in the AUTODYN material data. For air medium, ideal gas EOS is used to model the air environment using its density and specific internal energy to represent the pressure is related to the energy. For both the TNT explosive material and air gas medium, the values of the standard parameters will be used from the AUTODYN material library. The parameters for EOS for both materials used in the simulation are given in Table 4.
Table 4. Material parameters for TNT explosive material and Air surrounding medium used for the study
|
TNT |
|
|
Reference density (ρref) [Tons/m3] |
1.63 |
|
Equation of state |
JWL |
|
Parameter (A) [GPa] |
373.77 |
|
Parameter (B) [GPa] |
3.7471 |
|
Parameter (R1) [–] |
4.15 |
|
Parameter (R2) [–] |
0.90 |
|
Parameter (W) [–] |
0.35 |
|
C-J Detonation velocity [m/s] |
693.0 |
|
C-J Energy per unit volume [GJ/m3] |
6.0 |
|
C-J Pressure [GPa] |
21.0 |
|
Air |
|
|
Reference density (ρref) [Tons/m3] |
0.001225 |
|
Specific heat [J/kgK] |
717.599976 |
|
Gamma [–] |
1.4 |
|
Reference density (ρref) [Tons/m3] |
0.001225 |
3.5 Finite element modelling
The RC walls are modelled in ANSYS Workbench - Design Modeller using body elements with Lagrange reference frame and flexible stiffness behaviour. At the same time, the concrete base is also modelled using body elements with a Lagrange reference frame but with rigid stiffness behaviour. The mesh body sizing of both elements is set to be 0.10 meters. The wall to base connection is frictional, with a friction coefficient of 0.518 and a dynamic coefficient of 0.542. Reinforcing steel bars are modelled using beam elements with a Lagrange reference frame and flexible stiffness behaviour. The mesh body sizing of these elements is set to be 0.10 meters. The body interaction between the volume of the concrete solid element and the reinforcing bars beams elements is set to be bonded with a maximum offset of 0.10 meters. The beam element nodes are restrained to remain at the exact coordinates with the nodes of the volume element during elements deformations.
For the explosive charge modelling, the weights of the explosive material are modelled using body elements with an Euler reference frame with flexible stiffness behaviour. The charge weights of 50.0 and 400.0 kilograms of TNT explosive material are modelled in a cubic shape with a side length of 0.31 and 0.62 meters, respectively, set at a stand-off distance of 2.0 meters on the ground surface. Air material is modelled using body elements with an Euler reference frame with flexible stiffness behaviour for the air medium domain. The domain dimensions are 2.0 meters wide, 4.0 meters high, while its length equals 5.0 meters (2.0 meters behind the wall and 2.0 meters behind the explosive charge).
The mesh is set to 1/10 of its cube side length for the air domain’s charge weight and 0.05 meters for Eulerian reference frame elements. ANSYS AUTODYN [30] stated that users would use a smaller mesh Eulerian bodies comparing to Lagrangian bodies mesh so that the explosion simulation can lead to accurate outputs.
Six measurement gauge points were defined at different model places to record the time history of different parameters such as displacements and pressure. The first gauge is defined at the centre front face of the lower part of the concrete barrier (toe), and the second gauge is defined at the centre back face of the lower part of the barrier (heel). The third gauge is defined at the centre front face of the top part of the concrete barrier (tip). The fourth gauge is defined at the centre front face of the middle part of the concrete barrier, and the fifth gauge is defined at the centre back face of the middle part of the barrier. The sixth gauge is defined at 2.0 m behind the wall to examine the explosion pressure effects on any humans or objects behind the barrier. The configuration of the studied walls showing the gauge points locations and the position of both the 50 kg and 400 kg TNT charge weights are clarified in Figure A.1 and Figure A.2.
3.6 Explicit dynamics analysis procedures
This type of analysis is used to evaluate the performance of global limit states of the reinforced concrete structures using non-linear explosive material detonation (blast loading on structures). The mathematical models of the studied systems are subjected to the increasing pressure as a function of time (representation of blast wave along with the targeted structure). The analysis is terminated when the wrap-up time is reached, and detailed time history of a three-dimensional model is available to represent the explosion scenario. The assigned computational time represents the blast wave duration that causes the structure to be damaged or fail. The explicit dynamics analysis is an essential tool to estimate the structure’s maximum strength and deformation capacity due to blast loads. It also helps in identifying potential weak spots or locations in the structures. Moreover, it is established using the following steps:
(1) Construct the 3D model of the building as follows; draw the geometry in ANSYS Workbench - Design Modeler (line bodies and solid elements).
(2) Export the geometry to ANSYS Workbench - Mechanical [AUTODYN PrepPost] to assign the initial material of each geometry and reference frame.
(3) Define the analysis setting: mesh sizing of elements, boundary conditions, domain dimensions, detonation point, and detonation time.
(4) Export the model to ANSYS AUTODYN to finalise the material properties, define parts gauge points, and set up analysis controls with outputs.
(5) Run the analysis, and when it is finished, display the required outputs.
3.7 Performance measures of the studied walls
The process of measuring the walls’ performance is carried out by presenting the gauges parameters, e.g. deformation and pressure, graphically to show the effect of the explosion on different points on the wall and behind it to ensure humans’ safety other objects.
This part compiles the results of the explicit dynamic analysis of the three studied blast-resistant wall barriers models subjected to explosions. These walls are exposed to a hemispheric explosion of 50.0 and 400.0 kilograms of TNT explosive material in a cubic shape set at a stand-off distance of 2.0 meters. These cases of explosion represent a scaled distance of 0.585 and 0.314 m.kg-1/3, respectively. The analysis time is run to 24.0 and 44.0 milliseconds (positive phase duration and half of the negative phase duration). Each group of reinforced concrete walls (CFCBW - CFPBW - HFPBW) will be discussed individually to present their response. The studied results are the wall displacement to examine the effect of the explosion on the sliding and overturning of it, the material location of the wall after the explosion event to show its damages. The pressure versus time relationship is also plotted to examine the maximum pressure on different locations in front and behind them.
4.1 The first studied walls group
The effect of the 50 kg TNT charge weight is limited to only wall displacement, as there is no apparent damage to any of the studied walls, as shown in Figure 10. As shown in the following chart of Figure 10, the maximum horizontal displacement that occurred to all walls appeared equal to all the walls gauges except for gauge #1 and #2 for the wall (CFCBW-C-50-2), which are slightly recorded higher values as shown in Figure 11. Moreover, the maximum vertical displacements are shown as well in the same chart, which shows that the maximum vertical displacement occurred in gauge #1 for walls (CFCBW-A-50-2) & (CFCBW-B-50-2), and in gauge #3 for the wall (CFCBW-C-50-2).
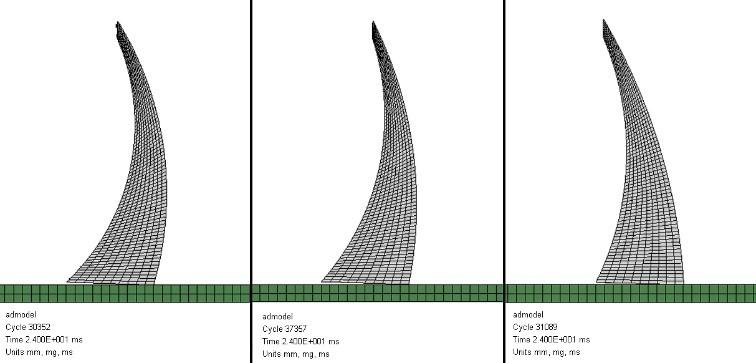
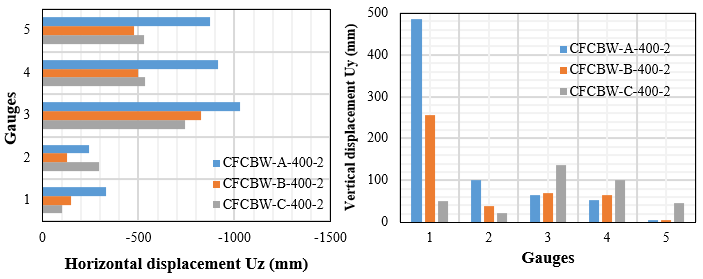
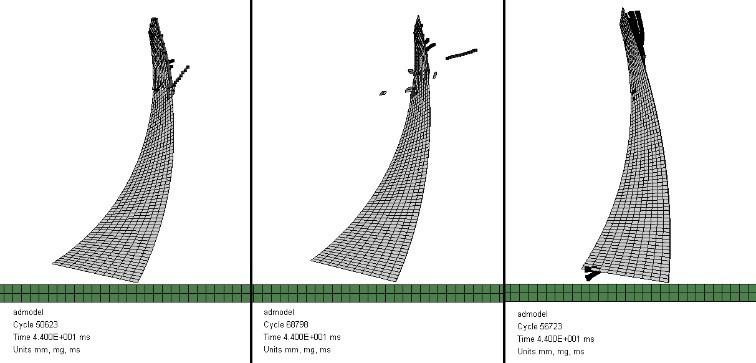
On the contrary, the effect of the 400 kg TNT charge weight is significantly manifest, as most of the wall damages occurred in the shapes of spalls at the wall toe and craters above its mid-height (the upper third), as shown in Figure 12. As shown in the following chart in Figure 13, the maximum horizontal displacement and rotation occurred to the wall (CFCBW-A-400-2), then the recorded values degraded lower to the lowest for the walls (CFCBW-B-400-2) and (CFCBW-C-400-2), respectively. On the contrary, the maximum vertical displacement degraded to the walls in a reversed order due to overturning.
Figure 10. Material location of the first group walls after the explosion of 50 kg TNT
Figure 11. Horizontal and vertical displacement values of gauge points of the first group walls subjected to 50 kg TNT
Figure 12. Material location of the first group walls after the explosion of 400 kg TNT
Figure 13. Horizontal and vertical displacement values of gauge points of the first group walls subjected to 400 kg TNT
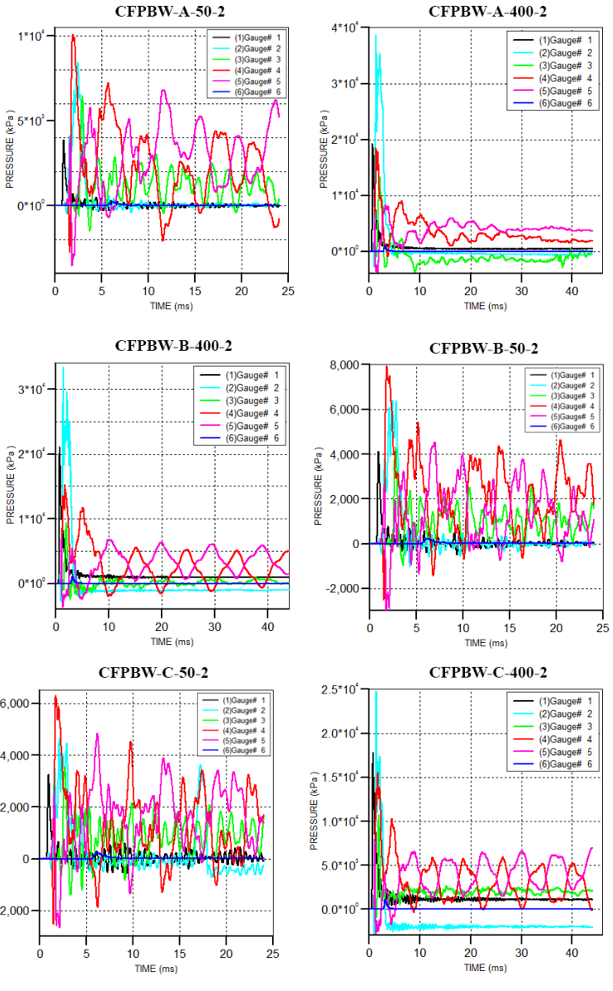
The pressure-time history graph of both 50 kg and 400 kg of TNT are shown in Figure 14. The results showed that the pressure rose instantaneously from ambient pressure to the peak pressure caused by the detonation. In the case of the 50 kg of TNT, the highest peak pressure occurred at gauge #3 with pressure about 1.0*104 for all wall cases at the same time of 2.7 ms. While in the case of 400 kg of TNT, gauge #2 recorded the peak pressure except for the wall (CFCBW-C-400-2) with pressure 4.0*104 kPa at 2.5 ms. In 50 kg of TNT, the pressure at 2.0 meters behind the walls on gauge #6 is 218, 222, and 223 kPa, respectively. While in the case of 400 kg of TNT, the pressure is 979, 1027, and 1082 kPa, respectively.
Figure 14. Pressure-time history of 50 kg and 400 kg TNT detonation for the first group walls
4.2 The second studied walls group
For this studied group of walls, the 50 kg TNT charge weight effect is also limited to horizontal displacement of this group walls, and there is no visible spall, as shown in Figure 15. The maximum horizontal displacement that occurred to these walls appeared to be the largest for the first wall (CFPBW-A-50-2) compared to all other walls. Except for gauges #4 and #5 for the wall (CFPBW-C-50-2), which are slightly recorded higher values as shown in Figure 16. Referring to the previous group, the maximum horizontal displacements of this group appeared minor than the previous one, especially for the walls (CFPBW-B-50-2) & (CFPBW-C-50-2). The vertical displacement also exhibits the same behaviour as the same two walls show relatively more minor displacements than the first group.
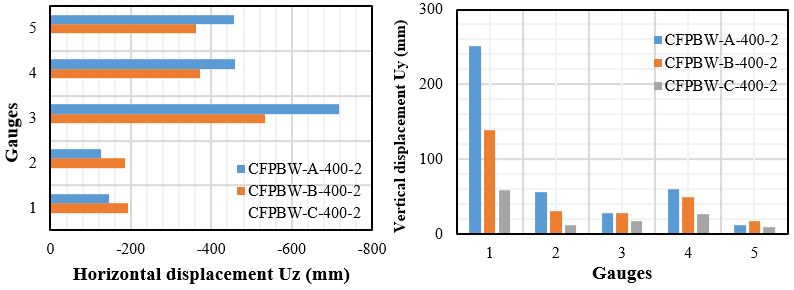
For the second group of walls exposed to 400 kg of TNT, the walls of this group behave better than the first group in both horizontal and vertical displacements. Although this charge weight damaged the wall (CFPBW-A-400-2) significantly, in shapes of spall and crater above its mid-height, no visible damage occurred to the other cases, as shown in Figure 17. The vertical deformation exhibits the same good behaviour following the horizontal deformation behaviour, as shown in Figure 18. Comparing to the first group, the vertical displacement values in this group are almost half of the first group values, which ensures the good behaviour of these walls’ geometry, especially the last two walls.
Figure 15. Material location of the second group walls after the explosion of 50 kg TNT
Figure 16. Horizontal and vertical displacement values of gauge points of the second group walls subjected to 50 kg TNT
Figure 17. Material location of the second group walls after the explosion of 400 kg TNT
Figure 18. Horizontal and vertical displacement values of gauge points of the second group walls subjected to 400 kg TNT
The pressure-time history graph of both 50 kg and 400 kg of TNT are shown in Figure 19. In the case of the 50 kg of TNT, the highest peak pressure occurred at gauge #4 with pressure about 1.0*104 kPa for the wall (CFPBW-A-50-2), then it decreased to about 0.8*104 kPa then about 0.6*104 kPa for walls (CFPBW-B-50-2) and (CFPBW-C-50-2) respectively at the same time of 1.8 ms. On the other hand, in the case of 400 kg of TNT, the peak pressure occurred at gauge #2 with pressure about 4.0*104 kPa for the wall (CFPBW-A-400-2) decreased to about 3.5*104 kPa then about 2.5*104 kPa for walls (CFPBW-B-400-2) and (CFPBW-C-400-2) respectively at the same time of 1.4 ms. The pressure at 2.0 meters behind gauge #6 is 222, 224, 223 kPa, respectively, in 50 kg of TNT. While in the cases of 400 kg of TNT, the pressure is 1001, 1058, and 1052 kPa, respectively.
Figure 19. Pressure-time history of 50 kg and 400 kg TNT detonation for the second group walls
4.3 The third studied walls group
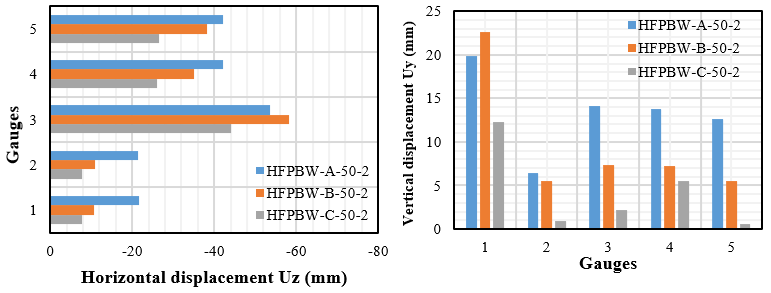
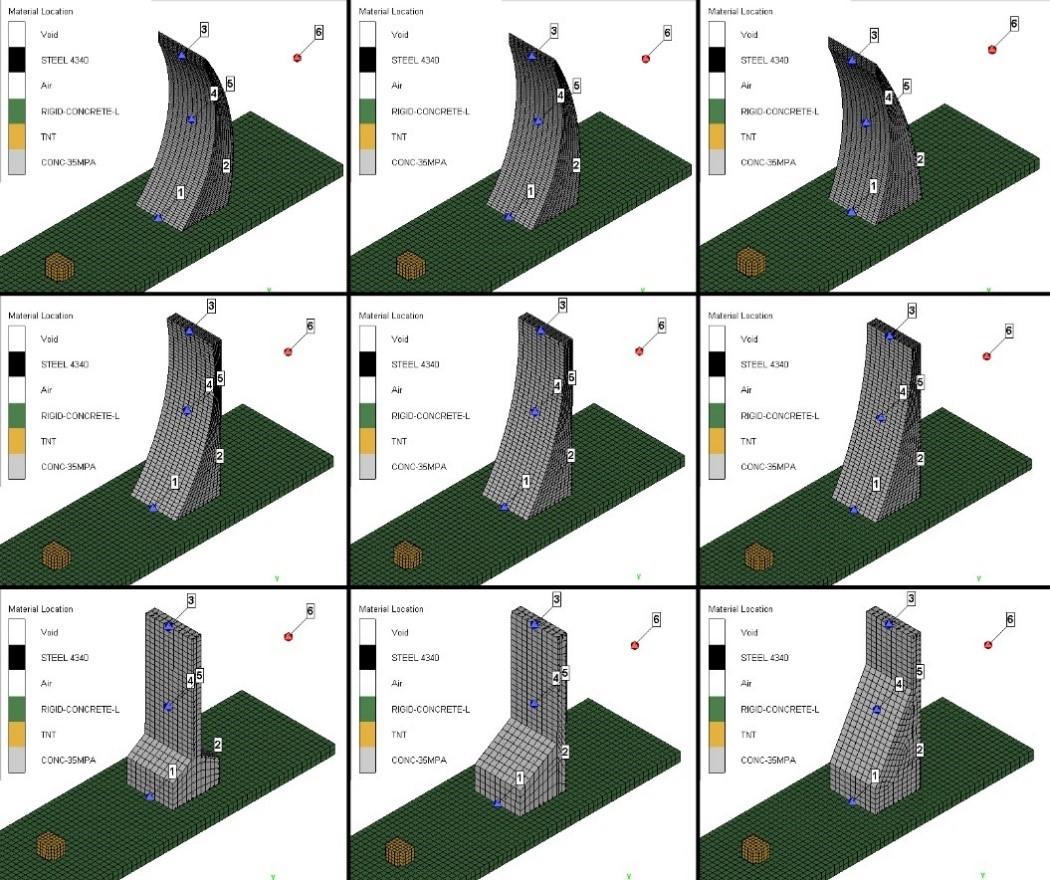
As illustrated in the following Figure 20, there is no significant damage to any of these walls. The maximum horizontal displacement that occurred to all of the walls appeared the smallest compared to all other groups, especially for the wall (HFPBW-C-50-2), except for Gauge #3 of the tip for the wall (HFPBW-B-50-2), which slightly recorded higher values as shown in Figure 21. Referring to the previous group, the maximum horizontal displacements for walls (HFPBW-B-50-2) and (HFPBW-C-50-2) of this group is nearly equal to the previous group. Moreover, the vertical displacement of this group of walls also shows the same good behaviour as the wall (HFPBW-C-50-2), with relatively more minor values of vertical displacements comparing to the second group.
Figure 20. Material location of the third group walls after the explosion of 50 kg TNT
Figure 21. Horizontal and vertical displacement values of gauge points of the third group walls subjected to 50 kg TNT
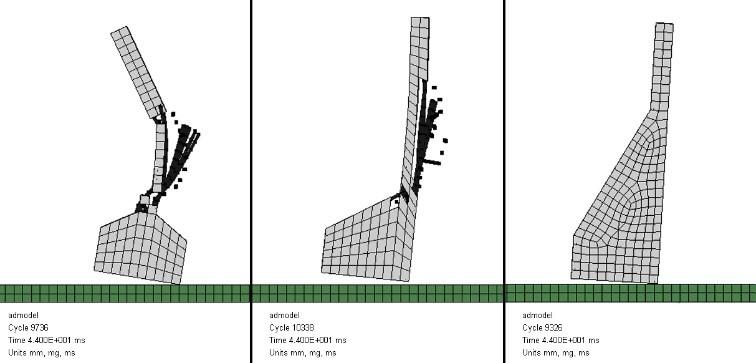
Figure 22. Material location of the third group walls after the explosion of 400 kg TNT
Figure 23. Horizontal and vertical displacement values of gauge points of the third group walls subjected to 400 kg TNT
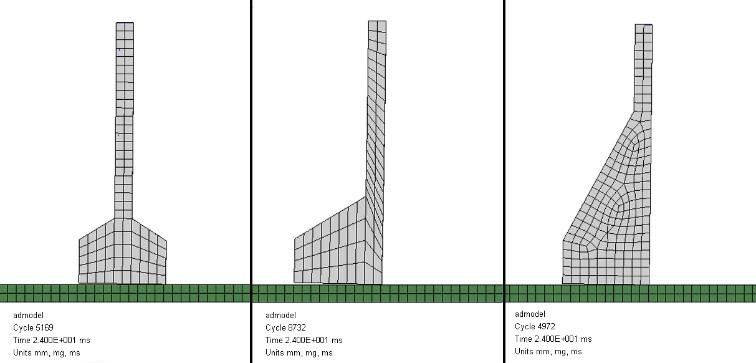
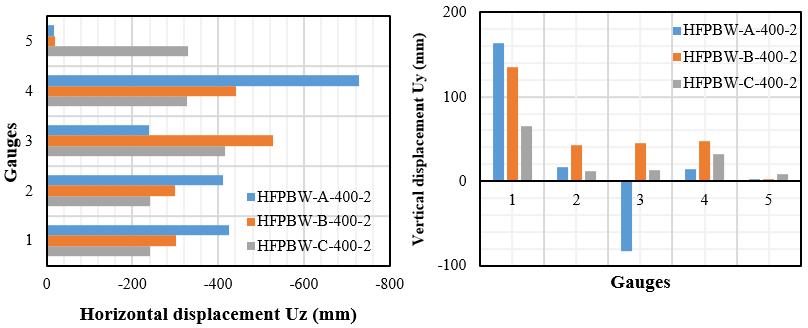
For the third group of walls exposed to 400 kg of TNT, only the wall (HFPBW-C-400-2) behaves as good as the second group wall (CFPBW-C-400-2) in both horizontal and vertical displacements. This charge weight dealt severe damage to the walls (HFPBW-A-400-2) and (HFPBW-B-400-2), with spall and crater damages at their middle third. However, no visible damage occurred to the wall (HFPBW-C-400-2), as the wall withstood this charge without any damages, as shown in Figure 22. Moreover, the vertical deformation of the walls shows the best behaviour comparing to the other groups, especially for the wall (HFPBW-C-400-2), as shown in Figure 23. Finally, the vertical displacement values of this group are almost in the same range as the second group values, which proves the safety measures of this geometry.
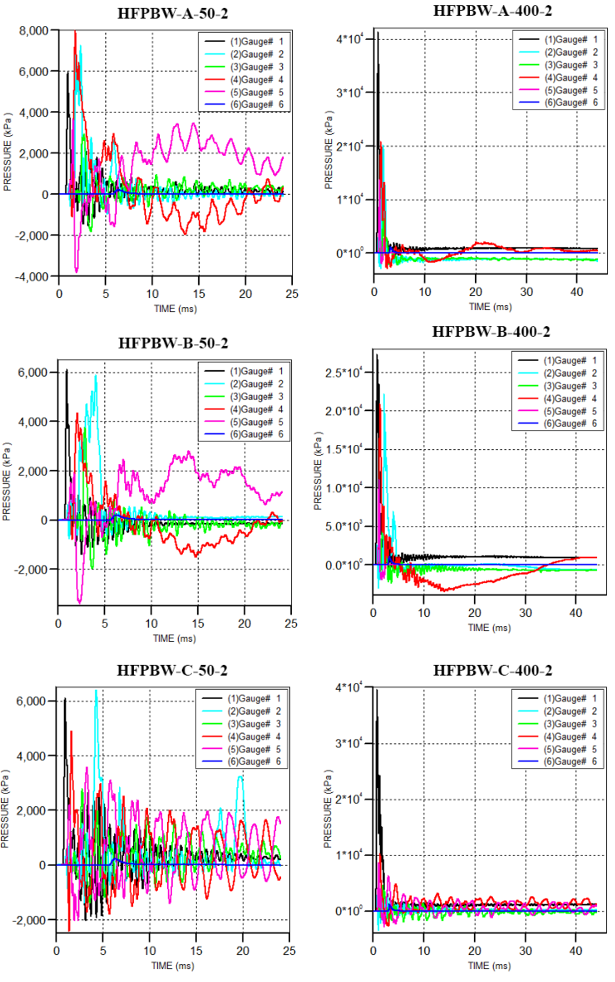
The pressure-time history graph of both 50 kg and 400 kg of TNT are shown in Figure 24. The results showed that the same instantaneous rise of ambient pressure to the peak detonation pressure. In the case of the 50 kg of TNT, the highest peak pressure occurred at gauge #4 in case (HFPBW-A-50-2) with pressure about 0.8*104 kPa at a time of 1.8 ms, then it decreased to about 0.6*104 kPa in gauges #1 and #2 for walls (HFPBW-B-50-2) and (HFPBW-C-50-2) at a time of 1.0 ms and 4.3 ms respectively. While in the case of 400 kg of TNT, gauge #1 recorded the peak pressure occurred for all walls with pressure are about 4.0*104 kPa at a time of 0.8 ms. The pressure at 2.0 meters behind gauge #6 in 50 kg of TNT is about 218, 205, and 222 kPa, respectively. While in the cases of 400 kg of TNT, the pressure is 1091, 994, and 1108 kPa, respectively.
Figure 24. Pressure-time history of 50 kg and 400 kg TNT detonation for the third group walls
This paper showed three different geometries of blast-resistant barrier walls, which have properties that make them suitable for resisting the incoming explosions threats. For each of these walls’ groups, the dynamic finite element analysis models that simulated actual blast events were used utilising ANSYS Autodyn version 18.2 to provide a basis of the data collection for design purposes using the following conclusions.
In the present study, the three studied groups of walls were exposed to a blast load created by the detonation of 50 kg of TNT at a stand-off distance of 2.0 m or a scaled distance of 0.585 m.kg-1/3. From an overturning perspective, the wall (CFPBW-C-50-2) performed as good as (HFPBW-C-50-2) to withstand this blast load, although the last cross-sectional area is greater than the first by 16%. Their performance is considered to be the best of all the studied walls.
The walls (HFPBW-A-50-2), (HFPBW-B-50-2), (CFPBW-B-50-2) and (CFCBW-C-50-2) have average performance, and the lowest performance was observed in the rest of the first group walls with the wall (CFPBW-A-50-2). The blast pressure-time history recorded at the gauges positions for different walls geometries relatively followed the inverse of the displacement performance classification. As the better the wall performed, the lower pressure applies to it and vice versa.
It can be inferred from the results obtained that 50 kg and below the TNT charge weight cannot blow down these walls. However, the maximum pressure behind the walls is about 224 kPa at 2.0 m away. According to FEMA 426 [8], this charge weight requires at least 27.0 m stand-off distance to prevent potentially humans’ lethal injuries and about 6.0 m (pressure about 62 kPa) to avoid concrete failure.
Moreover, the walls have different behaviour due to the detonation of 400 kg of TNT at a 2.0m stand-off distance or a scaled distance of 1.212 m.kg-1/3. Only three walls endured this huge charge weight without any spall or crater, which are (HFPBW-C-400-2) along with the walls (CFPBW-C-400-2) and (CFPBW-B-400-2), noting that the last cross-sectional area of the last is less than the first by 29%. On the contrary, all of the first group walls and the wall (CFPBW-A-400-2) suffered spalls and craters at their tip. Furthermore, the walls (HFPBW-A-400-2) and (HFPBW-B-400-2) suffered catastrophic damages, which can be mostly not recommended to resist, such as this explosive charge weight.
From the pressure mitigation perspective, for the first group, changing the concave side angle of curvature from 50° to 60° and 70° decrease the pressure behind the wall by 5% and 10%, respectively, for the second group, changing the concave side angles of curvature from 30° to 40° and 50° decrease the pressure behind the wall only by 5%. While in the third group, changing the wall base from one side haunch to two sides haunch decreases the pressure behind the wall by 8%. However, enlarging its hunch height led to the increase of the pressure behind it by 2% regarding its excellent performance.
It can be concluded from the current work that changing the wall geometry and its angle of curvature has a remarkable effect on improving the wall performance to mitigate the potential threat of terrorist attacks against structures. As well, the behaviour of the 60° concave face with planar back walls and the constant base of 1.0-meter-thick up to 0.5-meter-high with a face hunch up to 2.0 high-planar back walls proved to be better than all of the other studied curved and planar walls in facing explosion events.
Regarding the practical application of this study, the manufactured geometry of the reinforced concrete barrier walls should be chosen due to its usage purposes, whether to endure large deformation without sliding or overturning or to mitigate the pressure behind it to protect humans and objects.
Finally, this study enriches the ascending studies of the blast-resistant elements by providing the data for the curved and prismatic barrier walls by modelling them to reflect the actual-life barrier walls as plain concrete elements and modelling the curved reinforcing steel bars mesh. Furthermore, the limitations of this study are the boundary conditions of the walls, the stand-off distance, and the variation of the reinforcement steel bars volume, which can be varied as recommendations for future study parameters.
|
Z |
scaled distance, m. kg-1/3 |
|
R |
range from the centre of the charge, m |
|
W |
mass of spherical TNT charge, kg |
| P | pressure, MPa |
|
t |
time, s |
|
I |
impulse, Pa. s |
|
Subscripts |
|
|
so |
positive overpressure |
|
pos |
positive |
|
neg |
negative |
Figure A1. The studied walls’ material location shows the gauge points locations and the 50 kg TNT charge weight at 2.0 meters behind
Figure A2. The studied walls’ material location shows the gauge points locations and the 400 kg TNT charge weight at 2.0 meters behind
Figure A3. The studied walls’ steel reinforcement bars mesh
[1] Taylor, G.I. (1950). The formation of a blast wave by a very intense explosion-II. The atomic explosion of 1945. Proceedings of the Royal Society of London. Series A. Mathematical and Physical Sciences, 201(1065): 175-186. https://doi.org/10.1098/rspa.1950.0050
[2] Sedov, L.I. (1946). Propagation of strong blast waves. Journal of Applied Mathematics and Mechanics, 10(2): 241-250.
[3] Neumann, J.V. (1963). The point source solution. Collected Works. Oxford, Pergamon, 6: 219-237.
[4] Crowl, W.K. (1969). Structures to Resist the Effects of Accidental Explosions, Technical Manual TM 5-1300. US Army, Navy and Air Force, US Government Printing Office, Washington DC.
[5] Army, U.S. (1986). Fundamentals of protective design for conventional weapons. Technical manual TM, 5-855. US Army, Navy and Air Force, US Government Printing Office, Washington DC.
[6] Army, U.S. (1990). Structures to resist the effects of accidental explosions. Technical manual TM5-1300. Navy NAVFAC P-397, Air Force AFR 99-22.
[7] DoD, U.S. (2008). Structures to resist the effects of accidental explosions. Technical manual UFC 3-340-02. Washington, DC.
[8] Chipley, M. (2003). Reference Manual to Mitigate Potential Terrorist Attacks Against Buildings: Providing Protection to People and Building. Federal Emergency Management Agency.
[9] Yusof, M.A., Rosdi, R.N., Nor, N.M., Ismail, A., Yahya, M.A., Peng, N.C. (2014). Simulation of reinforced concrete blast wall subjected to air blast loading. Journal of Asian Scientific Research, 4(9): 522-533.
[10] Ramanujan, A., Lekshmi, S. (2016). Comparative study on the analysis of blast wall with and without GFRP using ANSYS. International Journal of Science and Research, 5: 864-70.
[11] Abdel-Mooty, M., Alhayawei, S., Issa, M. (2016). Performance of one-way reinforced concrete walls subjected to blast loads. International Journal of Safety and Security Engineering, 6(2): 406-417. https://doi.org/10.2495/safe-v6-n2-406-417
[12] Razaqpur, A.G., Tolba, A., Contestabile, E. (2007). Blast loading response of reinforced concrete panels reinforced with externally bonded GFRP laminates. Composites Part B: Engineering, 38(5-6): 535-546. https://doi.org/10.1016/j.compositesb.2006.06.016
[13] Al-Zuhairi, A.H., Qasim, A.J. (2016). Response of RC barriers subjected to Tnt explosion blast loading. Applied Research Journal, 2(3): 125-33.
[14] Tiwari, A.K., Tiwary, A.K., Dhiman, A. (2016). Analysis of concrete wall under blast loading. International Journal of Computer Applications, 975: 8887.
[15] Sun, W.B. (2009). Experimental studies on reinforced concrete (RC) slabs subjected to blast loads. Journal of Liaoning Technical University (Natural Science), 2: 217-220.
[16] Lin, X., Zhang, Y.X., Hazell, P.J. (2014). Modelling the response of reinforced concrete panels under blast loading. Materials & Design (1980-2015), 56: 620-628. https://doi.org/10.1016/j.matdes.2013.11.069
[17] Fekry, M., Mahmoud, G., ElShafey, M. (2017). Protective panels design against blast loads. Australian Journal of Basic and Applied Sciences, 11(5): 143-156.
[18] Willey, A.E. (2008). Guide for fire and explosion investigations. Technical manual NFPA 921. National Fire Protection Association.
[19] Baker, W.E., Cox, P.A., Kulesz, J.J., Strehlow, R.A., Westine, P.S. (2012). Explosion hazards and evaluation. Elsevier.
[20] Steinfeld, J.I., Wormhoudt, J. (1998). Explosives detection: A challenge for physical chemistry. Annual Review of Physical Chemistry, 49(1): 203-232. http://dx.doi.org/10.1146/annurev.physchem.49.1.203
[21] Davis, T.L. (2016). The Chemistry of Powder and Explosives. Pickle Partners Publishing.
[22] Ngo, T., Mendis, P., Gupta, A., Ramsay, J. (2007). Blast loading and blast effects on structures–An overview. Electronic Journal of Structural Engineering, 7(S1): 76-91.
[23] Yandzio, E., Gough, M. (1999). Protection of buildings against explosions. UK: Steel Construction Institute, 110.
[24] Hetherington, J., Smith, P. (2014). Blast and Ballistic Loading of Structures. CRC Press. https://doi.org/10.1201/9781482269277
[25] Hopkinson, B. (1915). British ordnance board minutes 13565. The National Archives, Kew, UK, 11.
[26] Cranz, C., Poppenberg, Eberhard, O.V. (1926). Lehrbuch der Ballistik, Zweiter Band-Innere Ballistik. Verlag Julius Springer, Berlin. https://doi.org/10.1007/978-3-642-52612-1
[27] Sadovsky, M.A. (2004). Mechanical effects of air shockwaves from explosions according to experiments. Geophysics and Physics of Explosion (ed. MA Sadovsky), Nauka Press, Moscow.
[28] Krauthammer, T., Altenberg, A. (2000). Negative phase blast effects on glass panels. International Journal of Impact Engineering, 24(1): 1-17. https://doi.org/10.1260/2041-4196.5.1.1
[29] Research Center for Housing and Building of Egypt. (2018). Egyptian Code for Design and Construction of Reinforced Concrete Buildings. ECP-203.
[30] ANSYS, I. (2017). ANSYS Autodyn User’S Manual (Release 18.2). ANSYS. Canonsburg, PA, USA.