K. Venkatesh Raja* | Muruganantham Ponnusamy | G. Thamarai Selvi | R. Saravanakumar | M. Ashok | V. Nagaraj
© 2021 IIETA. This article is published by IIETA and is licensed under the CC BY 4.0 license (http://creativecommons.org/licenses/by/4.0/).
OPEN ACCESS
Road safety and its risk assessment has become very significant due to the increasing population and usage of transports in the current scenario. This research work primarily focuses on assessing the critical risk factors that trigger road accidents in India. Based on literature review and expert’s opinion, twenty-eight risk factors are identified and rated on a scale from 1 – 6. These critical factors are prepared as a questionnaire and the required input data is collected from a diversified set of automotive users. Further, the data is carefully processed and analyzed for identification of severe risk factors and its allied route cause based on the survey pattern. Three different cut-off patterns (Low risk, high risk & medium risk zone) are included to make the study more interesting, and the 28 factors are clustered with the aid of the collective results. Also, the dominant risk factors that has higher probability in triggering road accidents are identified for possible rectification.
data analyses, accident survey, prioritization of factors, risk analysis, road accidents
The increasing rate of accidents in the road transport in the recent decades is being a great failure, which needs to be reduced significantly. The achievement of safety road transport is an emergent need and is receiving more attention around road transport research. The random occurrence of the accidents on road made the road safety as a very complicated area of transport research [1]. Due to various populations, traffic accidents are not equally occurred in all areas [2]. Accidents cause severe issues to society viz., human costs, economic costs, property damage costs and medical costs. World Health Organization (WHO) estimated the total number of road accidents in 2013, as 1.24 million per annum. In 2013, total number of 15, 563 people were admitted in casualty in Tamil Nadu due to road crashes approximately [3]. Hence, studying and analyzing the reasons for occurrence of road accidents is in great attention for researchers to serve a better way to avoid road accidents. In this concern, several reports have been presented the causes for road accidents worldwide. P.K. Agarwal et al., have reported the hazardous locations of roads based on several factors [4]. A detailed review has also been reported on the effect of traffic and weather characteristics on road safety by Theofilatos and Yannis [1]. The driving errors have been reduced using a driving simulator, which listed several errors of drivers while driving for a long time [5]. Prat and his co-workers reported the accidents caused by the driving distractions in urban roads of Spain [6]. Driving distractions due to the child occupants in roads have also been reported in literature [7]. The accidents on Metropolitan Melbourne, Australia roads caused by buses have been analyzed empirically by Goh et al. [8]. The causes of pedestrian and methods to improve the safety measures on Israel roads have been reported by Gitelman et al. [9]. Accidents made by sleeping drivers have also been reported in literature based on Norwegian survey [10]. Even though there has been a sufficient research effort made so far, it is need to investigate very deep in further to provide much more information about accident precautions with respect to make aware of safety management in transport networks. Hassan et al. [11] investigated the effect of drivers’ behaviors with the aid of questionnaire and crash data. The key factors causing accidents were identified and used for further modeling purpose. Greve et al. [12] conducted an epidemiological survey to identify the critical factors related to accidents. Based on the analyses, it has been concluded that consumption of alcohol and drugs, defensive driving as significant factors. Furthermore, an interesting study was performed by Xu et al. [13] in Croatia based on the traffic signs and its accident severity levels. Ospina-Mateus et al. [14] carried out a statistical analysis of the research works published by various authors and some interesting trends were identified. The studies were devoted to the formulation of strategies for protection of road accidents for motor cyclists. Recently, an interesting study was performed by Zou et al. [15] wherein, a bibliometric and scientometric overview about the accident analysis and prevention for the past five decades were presented in detail [16-18].
However, to the authors’ knowledge, assessment and prioritization of critical factors that trigger road accidents in India has not been addresses in detail. Hence, this study is dedicated to identify the factors that have a dominant impact on activating road accidents and to assess the factors based on the data derived from a detailed survey.
The survey has been taken by calling people having two-wheeler, four-wheeler and heavy vehicles. They were asked to fill up the questionnaire includes the complete details of each person. The people under survey are the regular travelers of for a various range of test period. With a view to predict the utmost way to reduce the road accidents in highway the survey has been taken among the people from various professions which also enabled us to get a complete insight of experiences from various types of driving strategies. Each invitation specified that only the driver of the vehicles should fill out the survey. The persons in the cluster are being selected in such a way that varieties of drivers are being accounted to justify the prediction. From literature review and based on the suggestion of experts, a questionnaire comprising of twenty-eight factors are placed in front of the person which has six response variations starting from one to six. The severity of risk is ascended from lower to higher one in the response numbers. The survey included several questions focused on the details of the vehicles owned by a person viz., average driving distance per month, driving experience in years, regular driving way etc. to get depth knowledge on drivers’ detail and their experience on roads. On the second part of questionnaire, they were asked to fill up the questions asked about their opinion about the causes for accidents. The questionnaire given to the participants is given in Table 1 as supplementary information.
The invitation comprised two set of questions including details of their own and details of their experience and opinion with a sample size of 600. All of them have been asked to fill out in paper for the questions asked and most of the respondents reacted well and filled the questionnaire in a span of around 30 minutes.
The analysis of survey has been made to reveal the number measures to reduce the cause of accidents. They were included in questionnaire and given in the present study. The causes of accidents have been thoroughly verified based on the survey on real time basis. The analysis of the survey given much information to reduce the road accidents by follow the instructions made based on the survey.
Table 1. Questionnaire used for data assessment
|
Answer the Following Questions based on the Ratings. (Put a tick mark) (1 – No Risk of Accidents, 2 – Low, 3 – Moderate, 4 – High, 5 – Very High, 6 – Severe & Critical) |
|||||||
|
S. No |
Description |
Rating |
|||||
|
|
Interacting with passengers while driving |
1 |
2 |
3 |
4 |
5 |
6 |
|
|
Sudden Reduction of speed and improper mirror viewing |
1 |
2 |
3 |
4 |
5 |
6 |
|
|
Parking vehicles at roadside on Highways |
1 |
2 |
3 |
4 |
5 |
6 |
|
|
Putting extra pressure on drivers to keep time & collection |
1 |
2 |
3 |
4 |
5 |
6 |
|
|
Improper/ Over loading of vehicles (Passenger & Goods) |
1 |
2 |
3 |
4 |
5 |
6 |
|
|
Continuous driving without rest (Over time) / Driving when tired |
1 |
2 |
3 |
4 |
5 |
6 |
|
|
Poor knowledge on traffic signs & regulations |
1 |
2 |
3 |
4 |
5 |
6 |
|
|
Lack of driving skills & illiteracy |
1 |
2 |
3 |
4 |
5 |
6 |
|
|
Mobile Phone usage (Hand-Held) |
1 |
2 |
3 |
4 |
5 |
6 |
|
|
Mobile phone usage (Hands free / Blue tooth) |
1 |
2 |
3 |
4 |
5 |
6 |
|
|
Drink and drive |
1 |
2 |
3 |
4 |
5 |
6 |
|
|
Following a vehicle too closely |
1 |
2 |
3 |
4 |
5 |
6 |
|
|
Over speed driving (>120 Km/h) |
1 |
2 |
3 |
4 |
5 |
6 |
|
|
Taking medicines / Drugs & Driving |
1 |
2 |
3 |
4 |
5 |
6 |
|
|
Poor road profiles |
1 |
2 |
3 |
4 |
5 |
6 |
|
|
Unexpected illegal cut-outs (4-way road) & Wrong side driving (4-Ways) |
1 |
2 |
3 |
4 |
5 |
6 |
|
|
High illuminated lights at night time |
1 |
2 |
3 |
4 |
5 |
6 |
|
|
Driver distraction in roads (Flex, Ads etc.) & carelessness |
1 |
2 |
3 |
4 |
5 |
6 |
|
|
Poor weather conditions |
1 |
2 |
3 |
4 |
5 |
6 |
|
|
Poor brakes |
1 |
2 |
3 |
4 |
5 |
6 |
|
|
Use of rethreaded tyres & poor tyres |
1 |
2 |
3 |
4 |
5 |
6 |
|
|
Defective front lights & wiper motor |
1 |
2 |
3 |
4 |
5 |
6 |
|
|
Steering & wheel alignment problems |
1 |
2 |
3 |
4 |
5 |
6 |
|
|
Turn indicators & brake light failure |
1 |
2 |
3 |
4 |
5 |
6 |
|
|
Improper indication of road maintenance well in advance |
1 |
2 |
3 |
4 |
5 |
6 |
|
|
Adjustment of settings (seat belts, steering, seats etc.) while driving |
1 |
2 |
3 |
4 |
5 |
6 |
|
|
Lack of reflectors (Road signs, dividers etc.) in roads during night time |
1 |
2 |
3 |
4 |
5 |
6 |
|
|
Pedestrian crossing at non-designated places |
1 |
2 |
3 |
4 |
5 |
6 |
To get a better understanding and long-term analysis survey, selection of samples plays a vital role in prediction and analyses. In view of the above fact, the persons invited for this survey as carefully chosen in such a way that a wide cluster is being considered.
About 600 participants were included in the present study. All the participants eagerly completed the survey in all aspects of the questionnaire. A gender ratio of 3:1 (Male: Female) is maintained in this survey (Figure 1). Also, a wide range of distribution is the age is considered (18 and 69 years) with a mean age of about 43 years. Almost all of them had not undergone any kind of diagnosed medical conditions and did not follow any prescribed medications. The distribution pie chart of the driver’s experience is exhibited in Figure 2 for clarity.
Figure 1. Distribution of gender
Figure 2. Summary of survey participants driving experience
The least number of persons only said that accidents have been caused due to parking vehicles at roadside on highways. Based on the survey, among all accident-causing factors taken into account in the present study, the drink and drive has been classified as very high and critical risk of accidents. Continuous driving without rest (over time)/driving when tired, mobile phone usage (hand-held), over speed driving and taking medicines or drugs while driving are the next risky factors after the previous drink and drive factor. The extra pressure loaded on drivers to keep time & collection, mobile phone usage (handsfree/Bluetooth), following a vehicle too closely, unexpected illegal cut-outs (4-way road) & wrong side driving (4-Ways) and pedestrian crossing at non-designated places are the successive risky factors as said by all the participants. The order of risk of the accident-causing factors is in the following order: Q11>Q13>Q14>Q9>Q6>Q12>Q16>Q4>Q28>Q12>Q5>Q17>Q7>Q18>Q21>Q15>Q8>Q27>Q20>Q25>Q22>Q26>Q19>Q2>Q23>Q24>Q1>Q3.
The main objective of the present study is to identify the major risk factors of highway accidents and preventing the accidents by taking more care on the very high and critical risky factors. From the above results, drunk and drive are the major problem which causes the road accidents in several cases. Furthermore, it can be clearly seen that the deviations of concentration of driver due to interacting with someone, using mobile phones and doing some other additional activities while driving are the serious factors led to the road accidents.
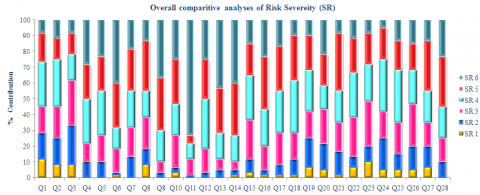
Table 2 lists the overall response of the survey analysis. Figure 1 indicates the relative possibilities of feature of road accidents occurred based on the effects. From the figure, it is worth noting that, there is a moderate equality among high risk, very high risk, and severe & critical risk of accidents to be occurred. This shows the reliability of the set-up of the questionnaire in the present study. In addition, if these three types of accidents be prevented by taking suitable measures, almost 70% of road accidents on highways can be prevented. The article lists the nature of accident-causing factors and magnitude of accident-causing factors. Hence, one can be aware of road accidents and might prevent majority of road accidents by gone through this manuscript. The questionnaire revealed the accident-causing factors and their effects which was obtained by true experiences of the participants. Figure 3 exhibits the percentage of contribution and distribution phenomenon of various risk factors for each question. From close observation, Q11 has higher dominance on risk factors.
Figure 3. Comparative analyses of risk severity
Figure 4. Distribution pattern of risk zones
Table 2. Accident ratings
|
|
Q1 |
Q2 |
Q3 |
Q4 |
Q5 |
Q6 |
Q7 |
Q8 |
Q8 |
Q10 |
Q11 |
Q12 |
Q13 |
Q14 |
|
SR 1 |
11.7 |
8.33 |
8.33 |
0 |
0 |
1.67 |
0 |
8.33 |
0 |
3.33 |
0 |
0 |
0 |
1.67 |
|
SR 2 |
16.7 |
16.7 |
25 |
10 |
10 |
1.67 |
13.3 |
10 |
3.33 |
3.33 |
1.67 |
3.33 |
5 |
3.33 |
|
SR 3 |
16.7 |
20 |
28.3 |
11.7 |
16.7 |
15 |
18.3 |
20 |
6.67 |
20 |
10 |
15 |
6.67 |
5 |
|
SR 4 |
28.3 |
30 |
16.7 |
28.3 |
28.3 |
13.3 |
23.3 |
16.7 |
20 |
20 |
10 |
31.7 |
16.7 |
16.7 |
|
SR 5 |
18.3 |
13.3 |
13.3 |
21.7 |
21.7 |
28.3 |
26.7 |
31.7 |
33.3 |
28.3 |
5 |
25 |
28.3 |
33.3 |
|
SR 6 |
8.33 |
11.7 |
8.33 |
28.3 |
23.3 |
40 |
18.3 |
13.3 |
36.7 |
25 |
73.3 |
25 |
43.3 |
40 |
|
Total |
100 |
100 |
100 |
100 |
100 |
100 |
100 |
100 |
100 |
100 |
100 |
100 |
100 |
100 |
|
|
Q15 |
Q16 |
Q17 |
Q18 |
Q19 |
Q20 |
Q21 |
Q22 |
Q23 |
Q24 |
Q25 |
Q26 |
Q27 |
Q28 |
|
SR 1 |
3.33 |
1.67 |
1.67 |
1.67 |
6.67 |
5 |
1.67 |
6.67 |
10 |
5 |
5 |
5 |
6.67 |
0 |
|
SR 2 |
8.33 |
3.33 |
6.67 |
10 |
18.3 |
16.7 |
15 |
6.67 |
10 |
20 |
10 |
15 |
13.3 |
10 |
|
SR 3 |
25 |
15 |
20 |
16.7 |
16.7 |
21.7 |
18.3 |
25 |
28.3 |
16.7 |
20 |
26.7 |
15 |
15 |
|
SR 4 |
28.3 |
23.3 |
26.7 |
33.3 |
26.7 |
15 |
20 |
28.3 |
23.3 |
33.3 |
33.3 |
21.7 |
20 |
20 |
|
SR 5 |
20 |
33.3 |
28.3 |
28.3 |
21.7 |
20 |
36.7 |
21.7 |
20 |
20 |
18.3 |
16.7 |
31.7 |
31.7 |
|
SR 6 |
15 |
23.3 |
16.7 |
10 |
10 |
21.7 |
8.33 |
11.7 |
8.33 |
5 |
13.3 |
15 |
13.3 |
23.3 |
|
Total |
100 |
100 |
100 |
100 |
100 |
100 |
100 |
100 |
100 |
100 |
100 |
100 |
100 |
100 |
(SR 1 – No Risk of Accidents, SR 2 – Low, SR 3 – Moderate, SR 4 – High, SR 5 – Very High, SR 6 – Severe & Critical)
Figure 4 represents the comparison between cumulative percentage of higher severity risk factors SR 4,5,6 and SR 5,6. For detailed analysis two cut-off zones is introduced with medium risk and high-risk zone. Medium risk zones are marked positive if the cumulative SR scores are above 33.33%. Also, high risk zones are identified at a cutoff frequency of 50% and above levels. From close observation the following conclusions are drawn:
• Out of the 28 risk factors identified in this study, nine factors are found to be riskier in triggering road accidents which has a cumulative severity risk percentage which exceeds 50. Top factor is found to be Q11.
• If the same parameters are considered in medium risk zone considering the top severity ratings, almost all the factors possess some risk in developing accidents. If SR 5,6 is taken almost 20 factors are pulled in the risk basket.
• Factors Q1,2,3 & 23 has relatively less significance in producing accidents.
From the present study, it has been concluded that, road accidents might be reduced in tremendous amount by following on the questionnaire of the present study. Survey revealed that drink & drive should be avoided. Further, the concentration deviation of drivers caused due to using mobile phones, unwanted interactions, doing unwanted work while driving could also be minimized to their extent. Using alternate drivers, driving the vehicle very carefully and patiently, follow the traffic rules properly and regularly, regular check-up of all parts of vehicles are the preventive factors of road accidents. The finding suggested that, self-discipline and concentration of drivers must be followed to make the travel more comfortable and safety.
[1] Theofilatos, A., Yannis, G. (2014). A review of the effect of traffic and weather characteristics on road safety. Accident Analysis and Prevention, 72: 244-256. https://doi.org/10.1016/j.aap.2014.06.017
[2] Campos-Outcalt, D., Bay, C., Dellapenna, A., Cota, M.K. (2002). Pedestrian fatalities by race/ethnicity in Arizona, 1990-1996. American Journal of Preventive Medicine, 23(2): 129-135. https://doi.org/10.1016/S0749-3797(02)00465-8
[3] Accident details for Tamil Nadu in certain years. State transport authority, Government of Tamil Nadu. 2013.
[4] Agarwal, P.K., Patil, P.K., Mehar, R. (2013). A methodology for ranking road safety hazardous locations using analytical hierarchy process. Procedia - Social and Behavioral Sciences, 104: 1030-1037. https://doi.org/10.1016/j.sbspro.2013.11.198
[5] Meuleners, L., Fraser, M. (2015). A validation study of driving errors using a driving simulator. Transportation Research Part F: Traffic Psychology and Behaviour, 29: 14-21. https://doi.org/10.1016/j.trf.2014.11.009
[6] Prat, F., Planes, M., Gras, M.E., Sullman, M.J.M. (2014). An observational study of driving distractions on urban roads in Spain. Accident Analysis and Prevention, 74: 8-16. https://doi.org/10.1016/j.aap.2014.10.003
[7] Koppel, S., Charlton, J., Kopinathan, C., Taranto, D. (2011). Are child occupants a significant source of driving distraction? Accident Analysis and Prevention, 43(3): 1236-1244. https://doi.org/10.1016/j.aap.2011.01.005
[8] Goh, K.C.K., Curriea, G., Sarvia, M., Logan, D. (2014). Bus accident analysis of routes with/without bus priority. Accident Analysis and Prevention, 65: 18-27. https://doi.org/10.1016/j.aap.2013.12.002
[9] Gitelman, V., Balasha, D., Carmel, R., Hendel, L., Pesahov, F. (2012). Characterization of pedestrian accidents and an examination of infrastructure measures to improve pedestrian safety in Israel. Accident Analysis and Prevention, 44(1): 63-73. https://doi.org/10.1016/j.aap.2010.11.017
[10] Phillips, R.O., Sagberg, F. (2013). Road accidents caused by sleepy drivers: Update of a Norwegian survey. Accident Analysis and Prevention, 50: 138-146. https://doi.org/10.1016/j.aap.2012.04.003
[11] Hassan, H.M., Shawky, M., Kishta, M., Garib, A.M., Al-Harthei, H.A. (2017). Investigation of drivers’ behavior towards speeds using crash data and self-reported questionnaire. Accident Analysis & Prevention, 98: 348-358. https://doi.org/10.1016/j.aap.2016.10.027
[12] Greve, J.M.D.A., Resende, M.R., Carvalho, H.B.D., Andreuccetti, G., Bernini, C.O., Leyton, V. (2018). Factors related to motorcycle accidents with victims: An epidemiological survey. MedicalExpress, 5. https://doi.org/10.5935/medicalexpress.2018.mo.007
[13] Xu, X., Šarić, Ž., Zhu, F., Babić, D. (2018). Accident severity levels and traffic signs interactions in state roads: a seemingly unrelated regression model in unbalanced panel data approach. Accident Analysis & Prevention, 120: 122-129. https://doi.org/10.1016/j.aap.2018.07.037
[14] Ospina-Mateus, H., Jiménez, L.A.Q., Lopez-Valdes, F.J., Salas-Navarro, K. (2019). Bibliometric analysis in motorcycle accident research: A global overview. Scientometrics, 121(2): 793-815. https://doi.org/10.1007/s11192-019-03234-5
[15] Zou, X., Vu, H.L., Huang, H. (2020). Fifty years of accident analysis & prevention: A bibliometric and scientometric overview. Accident Analysis & Prevention, 144: 105568. https://doi.org/10.1016/j.aap.2020.105568
[16] González, M.P.S., Sotos, F.E., Ponce, Á.T. (2018). Impact of provincial characteristics on the number of traffic accident victims on interurban roads in Spain. Accident Analysis & Prevention, 118: 178-189. https://doi.org/10.1016/j.aap.2018.02.015
[17] Rovšek, V., Batista, M., Bogunović, B. (2017). Identifying the key risk factors of traffic accident injury severity on Slovenian roads using a non-parametric classification tree. Transport, 32(3): 272-281. https://doi.org/10.3846/16484142.2014.915581
[18] Casado-Sanz, N., Guirao, B., Gálvez-Pérez, D. (2019). Population ageing and rural road accidents: Analysis of accident severity in traffic crashes with older pedestrians on Spanish crosstown roads. Research in Transportation Business & Management, 30: 100377. https://doi.org/10.1016/j.rtbm.2019.100377