Ghassan Suleiman* | Ahmad M. Dahamsheh | Murat Ergun
© 2020 IIETA. This article is published by IIETA and is licensed under the CC BY 4.0 license (http://creativecommons.org/licenses/by/4.0/).
OPEN ACCESS
In Turkey, thousands of people die in road traffic accidents and hundreds of thousands are injured every year. This study aims to quantify the fatal traffic accident problem in Turkey. Quantifying the scale of the problem will direct the attention of decision-makers and related authorities in Turkey to tackle the traffic accidents’ problem. To accomplish these objectives, accidents’ data from 2009 through 2019 were used. The characteristics of fatal traffic accidents were investigated and models were developed. The accuracy of the model’s performance was evaluated using Root Mean Square Error and the Coefficient of Determination. The results showed that about (9%) of total accidents have resulted in human casualties. The analysis revealed that mistakes of drivers and pedestrians caused 88% and 8% of the total accidents respectively. Drivers' mistakes included violations of the speed limit, right of way and maneuvering rules. The developed models showed a strong correlation between the numbers of injuries and vehicles’ km/year (R2 = 0.84). Finally, the number of casualties in the last two years, showed a decrease as a result of a drop in the mobility rate of heavy vehicles in addition to a slowdown in the growth rate of registered vehicles.
deaths, driver behavior, traffic injuries, safety measures
Traffic accidents present a serious problem for both developed and developing countries. Every year the lives of approximately 1.35 million people are cut short as a result of road traffic crashes worldwide. Between 20 and 50 million more people suffer non-fatal injuries, with many incurring a disability as a result of their injuries [1]. Although the number of deaths from road traffic accidents annually exceeds the number of deaths caused by HIV/AIDS, tuberculosis and diarrheal diseases, political commitment and financial investment in road safety make up only a small part of the solution that addresses these problems [2]. By definition, the case of traffic collisions has been perceived as the outcome of the involvement of three significant contributing elements which are the human factor, the vehicle, and natural street conditions. However, in urban areas, many studies report other factors which have quite a significant impact on traffic accidents, such as the type of area (commercial, housing...), road density, population density, land topography (level, mountain...), density of green spaces, and the number and type of intersections [3, 4]. Several studies also investigate aberrant driving behaviors and their association with the traffic risks. Abnormal behavior can be roughly divided into two categories: "mistake" is defined as a deviation from the correct path to achieve a goal, and "violation" is defined as a deliberate evasion of traffic rules. It has been found that mistakes and violations of rules are associated with high levels of stress experienced in the traffic environment [5]. The impact of weather conditions on the frequency and severity of traffic accidents was also found to be highly correlated. For instance, compared with dry road conditions, the risk of accidents on snowy or icy roads is more than four times higher. For slushy road surfaces, the corresponding risk of fatal accidents is five times higher than for dry roads [6]. Separately, the risk of accidents under different winter and rainy road conditions was also evaluated; demonstrating that the accident risk increased due to loss of stability and the formation of hydroplaning between the wheels and road surface [7]. Notably, vehicle speed was found to have a direct effect on the risk of collision, severity of injury, and the possibility of death as a result of that collision [8]. Alternatively, better speed control through stricter penalties brought a sharp drop in fatal road crashes and related injuries [9]. For example, increasing the speed limit by 5 km/hr above the 60 km/hr limit in rural areas will double the risk of accidents [10]. When studying the issue of traffic accidents at the country level, we find that the construction of infrastructure does not accelerate at the same level as car ownership, and when a modest level of traffic management is introduced, traffic accidents become unavoidable. In addition, 90% of the deaths caused by traffic accidents in the world occur in low- and middle-income countries [11, 12]. On the other hand, traffic accidents not only have negative consequences like health losses, psychological and social suffering, but also cost countries about 1% to 2% of their gross national products annually [13]. For example, data indicate that traffic accidents in Jordan cost the country about JD 103 million ($US 146.3 million) in 1996 [14]. The main objectives of this paper were to quantify the accident problem in Turkey and its characteristics, including involvement rates of pedestrians, drivers and vehicles. Also, the causes of traffic accidents and drivers' behavior were determined. In addition, two models were developed to estimate the yearly number of traffic injuries. Definitely, the results of this study will help the responsible authorities and decision-makers to provide safer environment by setting strict traffic laws and regulations to control drivers' behavior, which was considered the biggest cause of accidents.
The aim of this paper was to quantify the problem of road traffic accidents in Turkey. Two analysis methods are used in this study; descriptive and mathematical. Data for years from 2009 to 2019 was used. About (174,896) injury traffic accidents were extracted and filtered to reach the descriptive analysis. Characterization was done according to the proportion of deaths and injuries among the drivers, passengers and pedestrians. Then, causes of accidents were investigated. The final part of descriptive data included analysis of the driver’s behavior. Models were also developed to estimate a yearly number of injuries in Turkey based on the number of vehicle-km/year and number of registered vehicles. The accuracy of the model’s performance was evaluated using Root Mean Square Error (RMSE) and Coefficient of Determination (R2) which are presented in Eq. (1) and Eq. (2) below respectively:
$\mathrm{RMSE}=\sqrt{\sum_{i=1}^{n} \frac{\left(\mathrm{X}_{\mathrm{t}}-\mathrm{X}_{\mathrm{o}}\right)^{2}}{\mathrm{n}}}$ (1)
where, Xt is the actual output, Xo is the predicted output, and n is the number of outputs.
$R^{2}=1-\frac{S S_{r e s}}{S S_{t o t}}$ (2)
where, SSres is the sum of squares of residuals, SStot is the total sum of squares.
Information regarding the traffic accidents was taken from Turk-Stat (Turkish Statistical Institute) and Karayolları Genel Müdürlüğü (General Directorate of Highways) [15, 16].
The Republic of Turkey is a middle-income country located within the World Health Organization (WHO) European Region. With an area of 783,562 km2, Turkey's population rose 1.4% from the previous year to 83.15 million in 2019. Distribution by gender was 50.17% male and 49.83% female [15, 17]. Road users travelled 119.671 million vehicle-kilometers on the road network operated by the General Directorate of Highways. The costs of traffic accidents resulting in fatalities and injuries was calculated as 1,206,982 (Turkish-Lira) TL per dead, 127,732 TL per seriously injured and 9,302 TL per slightly injured person. The cost of traffic accidents with only material damage was 1,797 TL per vehicle, according to the information received from the Traffic Insurances Information Center [18]. In Turkey, roads are the most widely used mode of transportation in terms of passenger movement and cargo freight. More than 90% of transportation activities is carried out by roads [19]. Transportation is one of the leading causes of deaths in traffic accidents. According to estimates, this is also a major cost item for the national economy [20]. In Turkey, nearly 160 thousand people lost their lives in traffic accidents in the last three decades. The annual socio-economic cost of traffic accidents is estimated to be 20 billion TL [21]. In the year 2019, out of 1,168,144 total traffic accidents, 174,896 (15%) were accidents with casualties. As a result of these accidents, 5,473 people died and 283,234 were injured. Details about the characteristics of traffic accidents in Turkey for the 2009-2019 periods are presented in Table 1.
Table 1. Accident and vehicles statistics in Turkey 2009-2019
|
Year |
Total Registered vehicles |
Yearly Registered vehicles |
Vehicle km (106) |
Total number of accidents |
Accidents with only material damage |
Fatal Accidents |
Number of Persons killed |
Number of Persons injured |
|
2009 |
14,316,700 |
551,305 |
72,432 |
1,053,346 |
942,225 |
111,121 |
2,993 |
201,380 |
|
2010 |
15,095,603 |
778,903 |
80,124 |
1,106,201 |
989,397 |
116,804 |
2,738 |
211,496 |
|
2011 |
16,089,528 |
993,925 |
85,495 |
1,228,928 |
1,097,083 |
131,845 |
2,582 |
238,074 |
|
2012 |
17,033,413 |
943,885 |
93,989 |
1,296,634 |
1,143,082 |
153,552 |
2,555 |
268,079 |
|
2013 |
17,939,447 |
906,034 |
99,431 |
1,207,354 |
1,046,048 |
161,306 |
3,685 |
274,829 |
|
2014 |
18,828,721 |
889,274 |
102,988 |
1,199,010 |
1,030,498 |
168,512 |
3,524 |
285,059 |
|
2015 |
19,994,472 |
1,165,751 |
113,274 |
1,313,359 |
1,130,348 |
183,011 |
7,530 |
304,421 |
|
2016 |
21,090,424 |
1,095,952 |
119,671 |
1,182,491 |
997,363 |
185,128 |
7,300 |
303,812 |
|
2017 |
22,218,945 |
1,128,521 |
127,997 |
1,202,716 |
1,020,047 |
182,669 |
7,427 |
300,383 |
|
2018 |
22,865,921 |
646,976 |
131,625 |
1,229,364 |
1,042,832 |
186,532 |
6,675 |
307,071 |
|
2019 |
23,156,975 |
291,054 |
135,485 |
1,168,144 |
993,248 |
174,896 |
5,473 |
283,234 |
4.1 Quantification of the problem
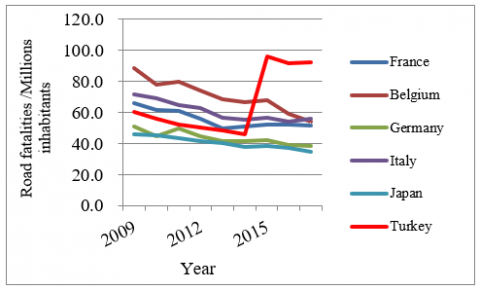
From Table 1, we can clearly see the rising trend in the numbers of registered vehicles, fatal road traffic accidents as well as resulting deaths and injuries from 2009 to 2019. As shown in the Table, the number of fatal traffic accidents and deaths increased dramatically in the past ten years. It is also noted that traffic fatalities jumped in 2015 with respect to the previous year. Here is an important point to be taken into account when analyzing these statistics. Until 2015, only deaths at the crash site were included in the calculation of the fatality rate in road accidents. As of the year in question, people who died in health institutions within 30 days as a result of the accident began to be included in this dataset in order to integrate the fatality figures with international standards and definitions [22]. In this study, we used the number of fatal accidents instead of the number of deaths for the analysis in order to provide a more consistent measurement Figure 1 illustrates that the fatality risk (number of fatalities per one-million population) continued to rise since 2015 for the same reasons. In contrast, the fatality risks in many developed countries decreased with time. According to Figure 1, the rate of fatalities per one-million populations in Turkey was 69.5, compared with 40.5 and 43.6 in Japan and Germany, respectively [22], and computed as averages for the period between 2009 and 2017.
Figure 1. Road fatalities/one-million inhabitants in different countries [23]
4.2 Analysis of fatalities and injuries
A study of the gender distribution of fatalities from road accidents in Turkey indicated that women account for 23.8 % of those killed in traffic accidents, compared with 76.2% men. A further investigation of all traffic accident fatalities revealed that male drivers made up the highest proportion of the total with 41.7%. For passengers and pedestrians, the total distribution of men and women were 34.5% and 22.8%, respectively. The percentages for pedestrian fatalities in Europe and USA were 20% and 11%, respectively [24]. The distribution of mortality is presented in Table 2.
The distribution of injuries was broadly similar to the fatalities, but the proportion of injured women was higher at 32.8% injured versus 23.8% dead. As for the gender distribution of injured passengers, has recorded an incremental by 33% with respect to the fatal passenger’s percentage. Other details for traffic injuries are presented in Table 3.
Table 2. Distribution of traffic fatalities in Turkey
|
Drivers |
Passengers |
Pedestrians |
|||
|
Male |
Female |
Male |
Female |
Male |
Female |
|
2,283 |
53 |
1,034 |
831 |
855 |
417 |
|
41.7% |
1.0% |
18.9% |
15.2% |
15.6% |
7.6% |
Table 3. Distribution of traffic injuries in Turkey
|
Driver |
Passenger |
Pedestrian |
|||
|
Male |
Female |
Male |
Female |
Male |
Female |
|
110,862 |
9,995 |
61,106 |
67,843 |
18,232 |
15,196 |
|
39.1% |
3.5% |
21.6% |
24.0% |
6.4% |
5.4% |
4.3 Analysis of the of drivers behavior
A deeper analysis of mistakes made by drivers revealed that by far the leading cause of traffic accidents was breaking of speed limits, contributing to 39% of all accidents as shown in Table 4. Failure to yield right of way at junctions ranked the second, accounting for 13% of the driver mistakes. Other causes were crashing from the back (7.4%), violation of the rules for changing (making wrong turns) direction (6.5%). Careless behavior by drivers also includes running red lights or ignoring stop signs, making up 2.4% of the mistakes that lead to accidents. It was noted that the aggressive behavior, like crashing into properly parked vehicles, ignoring "no vehicle entry" signs, drunk driving, and driving over the speed limit caused of 7% of the fatal accidents.
Table 4. Distribution of drivers mistakes in Turkey
|
List of driver mistakes |
Number |
Percentage |
|
Drunk driving |
2,334 |
1.3% |
|
Violation of speed limits |
70,062 |
39.9% |
|
Crashing from the back |
13,405 |
7.4% |
|
Violation of rules for changing direction |
11,652 |
6.5% |
|
Ignoring do-not-pass restrictions |
1,093 |
0.6% |
|
Failure to yield right of way at junctions |
23,616 |
13.1% |
|
Running red lights or ignoring stop signs |
4,286 |
2.4% |
|
Crashing into properly parked vehicles |
3,897 |
2.2% |
|
Violation of maneuvering rules |
14,669 |
8.1% |
|
Lane violation |
2,564 |
1.4% |
|
Ignoring "no vehicle entry" sign |
4,425 |
2.5% |
|
Other driver mistakes |
26,203 |
14.6% |
4.4 Analysis of the causes of accidents
The analysis of recorded data showed that a big majority - 88% - of fatal traffic accidents in Turkey were caused by driver mistakes, as presented in Table 5. Mistakes by pedestrians were the second leading cause. The remaining causes of accidents were distributed between passenger mistakes, road and vehicle faults. Vehicle faults included brakes- and gear failures, axle breakdown, steering wheel, rear lamp, turning signal defects and tire blowouts. Break failures accounted for approximately 20% of the vehicle faults.
Table 5. Causes of fatal traffic accidents in Turkey
|
Faults |
Number |
Percentage |
|
Driver mistakes |
180,042 |
88.0% |
|
Passenger mistakes |
2,572 |
1.3% |
|
Pedestrian mistakes |
16,726 |
8.2% |
|
Road faults |
1,045 |
0.5% |
|
Vehicle faults |
4,153 |
2.0% |
4.5 Developing models for analysis of fatal accidents
Using the data in Table 1, two models were developed. In the first one, the model investigated the impact of vehicles-km on the total number of injuries in Turkey for the 2009-2019 periods. The second model showed the relationship between the total number of registered vehicles and traffic injuries. Based on regression analysis carried out in this study, the following equation was developed:
$\mathrm{ITA}=162.66 \mathrm{x}_{1}^{0.6414}$ (3)
$\mathrm{ITA}=0.443 \mathrm{x}_{2}^{0.795}$ (4)
where:
ITA = Injuries from traffic accidents/year.
x1= Vehicle-km/year.
x2 = Total number of registered vehicles/year.
The above model (3) and its parameters were found to be significant at a 95% confidence level (N=11, R2=0.84, F=30.2). Likewise, the coefficient of determination (R2) of the second model was slightly less than that of the first one. This means that the most important parameters in determining or predicting the number of injuries are the vehicle-km/year rather than the total registered vehicles. The statistical properties of the two-models were presented in Table 6.
Table 6. Statistical properties of the models
|
Model |
Predictors |
Dependent Variable |
R |
R-Square |
Root Mean Square Error |
F Change |
Sig. F Change |
|
3 |
Vehicle-km |
# of Injuries |
0.92 |
0.84 |
103594.454 |
30.208 |
.000 |
|
4 |
Total Vehicles |
# of Injuries |
0.89 |
0.80 |
104737.767 |
30.585 |
.000 |
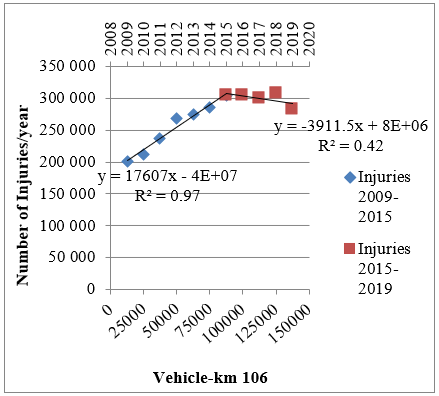
Although the best one of the models above explained about 83% of traffic injuries issue in Turkey, the 2009-2019 period could be divided into two parts. In the first part which extends from 2009 until 2015, the number of injuries is highly positively correlated with the average of vehicle-km (R2=0.97). In Table 1, the number of newly registered vehicles per year is seen falling dramatically from 2015 to 2019, reportedly due to crises. For instance, in 2019 the number of registered vehicles plunged by 55% from the previous year. Furthermore, the percentage of trucks-km/year also decreased from 13.4% in 2016 to 11.8% in 2018. As a result, the numbers of injuries from traffic accidents show a distinct reduction from 2015 to 2019 as shown in Figure 2.
Figure 2. Traffic injuries in Turkey as divided in two periods
Traffic accidents are highly dependent on traffic, human, highway and weather conditions. Assessment and analysis of Traffic accidents will undoubtedly help to more sense the causes of the problem and improve the safety level. However, tackling all causes is not an easy task. Furthermore, modeling and descriptive analysis of traffic accidents is an efficient and inexpensive tool that helps decision-makers, planning engineers, and developers. Therefore, implementing a statistical and mathematical methodology will promote the modeling process and improve the knowledge of the factors which have more impact on predicting yearly traffic injuries. This study has benefited from the capacity of statistical software and analysis tools to exhibit the main causes of traffic accidents. Likewise, the traffic accident characteristics in this study were employed to anticipate improving traffic awareness. For instance, this study showed that about 88% of the accidents result from driver mistakes and recklessness. Unfortunately, aggressive driving behavior was the major contributory factor in traffic accidents. Certainly, the implementation of stiff penalty levels during violating traffic rules in addition to raising the level of driving certification license centers will lead to the creation of a safer traffic environment. Moreover, pedestrian mistakes caused around 8.2 % of the total casualties. Not giving more attention during crossing the streets and crossing where there isn't a pedestrian crossing were the main pedestrian mistakes. On the other hand, highway geometric design faults resulted in a small proportion of casualties. Also, vehicle-km/year was strongly correlated with the total number of injuries more than the number of registered vehicles itself. Finally, in evaluating the level of traffic safety in Turkey, Turkey has a high traffic fatality rate according to EU countries. Based on the above, more attention from the related authorities should be given to driver’s behavior as well as for pedestrians by increasing the culture of respect for the rights of others during driving, adhere to traffic rules to stop this continuous bleeding of victims, and loss in the economy.
[1] World Health Organization. Global Status Report on Road Safety 2018: Summary. No. WHO/NMH/NVI/18.20, 2018.
[2] World Health Organization. Global Health Expenditure Database, Available from: http://apps.who.int/nha/database, accessed on Oct 23 2018.
[3] Al-Masaeid, H.R., Ghassan. S. (2004). Relationships between urban planning variables and traffic crashes in Damascus. Road & Transport Research, 13(4): 63-73.
[4] Al-Masaeid, H.R., Obaidat, M.T., Gharaybeh, F.A. (1997). Pedestrian accidents along urban arterial midblock. Journal of Traffic Medicine, 25(3-4): 65-70.
[5] Matthews, G., Dorn, L., Hoyes, T.W., Davies, D.R., Glendon, A.I., Taylor, R.G. (1998). Driver stress and performance on a driving simulator. Human Factors, 40(1): 136-149. https://doi.org/10.1518/001872098779480569
[6] Riikka, S. (2008). Keliolosuhteet ja henkilöautoliikenteen riskit. Tampere Technical University, Research Report 68.
[7] Bergström, A., Magnusson, R. (2003). Potential of transferring car trips to bicycle during winter. Transportation Research Part A: Policy and Practice, 37(8): 649-666. https://doi.org/10.1016/S0965-8564(03)00012-0
[8] Vadeby, A., Forsman, A. (2018). Traffic safety effects of new speed limits in Sweden. Accident Analysis & Prevention, 114: 34-39. https://doi.org/10.1016/j.aap.2017.02.003
[9] Constant, A., Salmi, L.R., Lofont, S., Chiron, M., Lagarde, E. (2009). Road casualties and changes in risky driving behavior in France between 2001 and 2004 among participants in the GAZEL cohort. American Journal of Public Health, 99(7): 1247-1253.
[10] McLean, J., Kloeden, C. (2002). Alcohol, travelling speed and the risk of crash involvement. International Conference on Alcohol, Drugs and Traffic Safety (16th, 2002, Montreal, Canada).
[11] World Health Organization. Global Status Report on Road Safety 2015. World Health Organization, 2015.
[12] Yılmaz, Y.E., Gürsoy, M. (2020). Development of a composite road traffic safety performance index: b Basis for comparing Turkish metropolitan cities. Sigma: Journal of Engineering & Natural Sciences/Mühendislik ve Fen Bilimleri Dergisi, 38(2): 769-784.
[13] Peden, M., Scurfield, R., Sleet, D., Mohan, D., Hyder, A.A., Jarawan, E., Mathers, C. (2004). World Report on Road Traffic Injury Prevention. World Health Organization.
[14] Al-Masaeid, H.R., Al-Mashakbeh, A., Qudah, A.M. (1999). Economic costs of traffic accidents in Jordan. Accident Analysis & Prevention, 31(4): 347-357. https://doi.org/10.1016/S0001-4575(98)00068-2
[15] Turkish statistical institute, https://www.tuik.gov.tr/, accessed on Oct 23 2020.
[16] General Directorate of Highways in Turkey, https://www.kgm.gov.tr/, accessed on Oct 23 2020.
[17] General Directorate of Population and Citizenship Affairs in Turkey, https://www.nvi.gov.tr/, accessed on Oct 23 2020.
[18] Head of strategy and budget in Turkey, https://www.sbb.gov.tr/, accessed on Oct 23 2020.
[19] Özen, E., Erhan, G., Zübeyde, K. (2014). Estimation of the costs of traffic accidents in Turkey: An evaluation in terms of the insurance and financial system. Journal of Yasar University, 9(33): 5649-5673.
[20] Özer, U. (2010). Kasko ve Trafik Sigortaları Karlılık Değerlendirmesi. Reasürör, S: 7-23.
[21] Öztürk, E.A. (2016). Türkiye’deki illerin trafik risk endeksi. Pamukkale Üniversitesi Mühendislik Bilimleri Dergisi, 22(6): 405-412.
[22] Özen, M., Zorlu, F. (2018). Türkiye’de Devlet Karayollarında Kaza Oranlarının ve Kaza Örüntüsünün Analizi. Teknik Dergi, 8589-8604. https://doi.org/10.18400/tekderg.308318
[23] Organisation for Economic Co-operation and Development (OECD. https://data.oecd.org/, accessed on Oct 23 2020.
[24] National Highway Traffic Safety Administration. (2008). Traffic safety facts 2008 data overview. DOT HS, 811: 162.