Naseer Abdul Razak Hasach Albasri*![]() | Mahmood Hussein Mustafa
| Mahmood Hussein Mustafa![]() | Makkiyah Shakir Aliasghar
| Makkiyah Shakir Aliasghar![]()
© 2023 IIETA. This article is published by IIETA and is licensed under the CC BY 4.0 license (http://creativecommons.org/licenses/by/4.0/).
OPEN ACCESS
Urban land uses are spatial dynamic phenomena, changing according to time change because of economic and social factors influence. Urban functions are affected by several factors at urban and regional levels. The purpose of this study is to answer what the functional changes in An Najaf from 2015 to 2020, What factors affect the increase of functional changes, and how the regional land use of An Najaf International Airport site and the University of Kufa campus site affect the changes mentioned above. The Research used a Geographic Weighted Regression (GWR) within (GIS) to find the relation between spatial variables, the causes and the size of functional changes, functional changes are displayed on a map to help the planner make decisions. The results showed that the study area witnessed great economic, social, and urban changes that affected the development of land uses as well as a change of urban functions. The using of (WGR), there is an impact between the factors related to the regional level with the total functional changes as a result of local R² (86%) of residential functions have changed to commercial, (79%) from residential to industrial, and (45%) from residential to other uses during 2015-2020.
functional change, Geographic Weighted Regression (WGR), Geographic Information System (GIS), land uses, Master plan (M.P), regional level land use, Najaf
Throughout changes in urban functions refer to changes in the behavior of urban systems. These changes are caused by factors of internal elements and the influence of external forces that generate a kind of spatial functionality that can be observed at the larger urban level. The spatial changes differ from one space to another and are not particularly similar. This is due to the difference in the characteristics of these cities and their functions.
The factors influencing urban functional changes are varying. According to land use theories, regional activities (regional level land use) lead to changes at the urban level.
Economic factors associated with regional land uses are crucial for the evolution of urban functions due to their strong association with land and its price, while social factors are secondary in their impact, regional land uses have an effect through: (Concentration and decentralization, invasion and succession, and surveillance and segregation) [1].
The need to understand this effect made us use a scientific approach to find a relationship between regional level land use and the urban functional changes from 2015 to 2020 in An Najaf City in Iraq. During the duration of the study, urban functional changes occurred in this city, according to urban authority data, field surveys, and maps.
Logical steps of (GWR):
1. In the models of global regression such as (OLS) coefficients (β):
yi = β0 + β1 x1i + β2x2i +…+ βnxni + Ɛi
with the estimator:
β’ = (XT X)-1 XT Y
2. In the (GWR) model:
yi = β0 + β1 x1i + β2x2i +…+ βnxni + Ɛi
with the estimator:
β’(i) = (XTW(i) X)-1XTW(i)Y
where, W(i) is a matrix of weights specific to location i such that observations nearer to i are given greater weight than observations further away.
“Geographically Weighted Regression” (GWR) is a commonly utilized technique to determine spatial relations and to predict the values of dependent variables from one or more independent variables. This model is an important tool in spatial statistics that helps us display the analysis results as a map and data using ArcGIS 10.3.
The “Geographically Weighted Regression (GWR)” method of modeling is broadly used to help researchers to study spatial variables in “multivariate regression” and predict regression parameters for the local level by using “spatially dependent weights” [2]. “GWR becomes a technique increasingly used in urban geographic and environmental studies. The main feature of GWR is the ability to generate parameter estimates for each regression point using observations” [3].
1.1 Area of the study
An Najaf Province is one of the important historical provinces in Iraq. It is situated between longitudes “50` 42° - 44° 44°” E and two latitudes “50` 29° - 21° 32°” N. The development of the city has gone through different phases and has grown because of many different factors. The impact of those factors varied according to their significance, i.e., political and religious ones. An Najaf is located on the boundary of the desert in the west, which extends to the Saudi Arabia borders. It overlooks the Wadi As-Salam Cemetery from the north and north-east sides and the depression of An Najaf Sea from the west. It is about (11 km) from Kufa town. The city is made up of (forty-one) residential areas. See Figure 1 [4]:
The city consists of (985) industries distributed in the spatial structure such as “construction, food, chemical, textile, engineering, wood, and others”.
Tourist activity is of great importance for the city, it played an important role in Economic growth, both globally and locally, whether at the global or local level. Tourism activity is a source of economic income in the city through the presence of foreign workers, the attraction of foreign currency, and the cultural exchange between members of the local community and other foreign communities.
The study area contains a lot of characteristics such as its religious ones, more than 10 million international and local tourists visit Imam Ali Holy Shrine every year from different regions and nations. Students from different regions come to study at the religious Institution (Hawza). Another characteristic is Wadi Al-Salam Cemetery which is one of the largest cemeteries in the world. A third characteristic is the presence of the international airport. It affected the functional change of land uses in the urban environment (Figure 1).
Figure 1. Neighborhoods of An Najaf city (41 residential neighborhoods)
Source: Using the ARC GIS 10.8 software
Therefore, the city stands out from other Iraqi provinces in terms of economic characteristics because of its Islamic heritage and historical depth which have made it one of the most important Iraqi cities. The influence of the religious factor of the city on the social, economic, urban planning, as well as political aspects has certainly led to spectacular changes in the urban spatial functions of the province. This is because of the necessity for dynamism and expansion of space planning which must consider the many effects deriving from the existence of the religious component as well as the religious sites.
In the paper of Javi et al. [3], the authors’ models (GWR) and (OLS) are used to examine spatial variable relationships between changes in groundwater quantity (GQC) and changes in land use/cover for periods: “1987 to 2010 in the Khanmirza plain in southwestern Iran”. To this end, Landsat T-M imagery was used to show changes in land use/cover. Groundwater quantities, comprising “groundwater level changes” (GLC) and “groundwater withdrawal differences” (GWD), data are collected from piezometric techniques as well as from wells in the study area. Spatial autocorrelation analysis Moran I and local indicators showed good efficiency in building a spatial model using GWR (for various data with a very small number of residual clusters. The result showed R² and corrected Akaike's "parameters of information criteria" and showed that the GWR had little resemblance in time and space in the neighboring area and great ability to explain discrepancies in the land use/cover change as a function of (GQC). All the results of the local R2 values indicated that there is a relation between land use variables and the aquifers within the study area. According to the study results, there are significant differences between changes in the “groundwater level and withdrawal” of groundwater differences and the pattern of land use in the different sites of the area of the study through the study periods [3].
Wang et al. [5] used “GWR techniques” to study the effect of different factors on land use changes in "Texas’ Travis County". This paper used “GWR” for modeling the data of the change of land use in Travis County. The first model of this study was applied to the study of subdivision and aggregation of land use from 2003 to 2008. The second model was applied to predict changes in land use (for the backward regions) from 2003 to 2008. The “nearest neighboring” points were also used in this study, using the “weight matrix on the tri-cube weighting specification”. The results of the model GWR of the change in land use indicate a spatial pattern of several factors influencing the development of land use. Proximity to the city center has a better influence on the development of land use of the office, with 2.2 elasticity, but reduces the probability of vacant land being converted to “residential, commercial or industrial activities” [5].
In the paper written by Zhao et al. [6], this paper used the global regression and local regression (GWR) technique for urban development in the border cities of “Texas, Laredo and Nuevo Laredo, Tamaulipas in Mexico, 1985 to 2014”. Landsat images were used to observe historical land cover patterns and land use.
The variables of socio-economic factors associated with urban development were monitored from different references and utilized as independent parameters. In the same periods, the model GWR was utilized with “Global Logistic Regression” (GLR) to explain the effect of urban growth. The model GWR has surpassed the (GLR) model in terms of fit quality. These results showed that GWR models are complementary to (GLR) model in studying urban growth factors. The variables, in the region, comprise political boundaries, assumedly because the relations between variables of socioeconomic factors and urban development variables are characterized by non-homogeneous space. The spatial variables of the relation between urban development and neighborhood interactions and effects show the idea of interrelationships between land use alteration and the other associated variables [6].
Shariff et al. [7] adopted the (GWR) approach to model changes in “Penang urban land use Island from 1990 to 2005”. During this period, the area of the study recorded strong urban development because of migration from neighboring regions. The change in land use has important consequences for the urban environment. This study determined spatial factors as variables showing the urban environment, factors that are assumed to influence the land use change in the case study. This study uses an “ordinary least squares regression” (OLS) model, after which the results of the two models are compared. GWR results and outputs showed significant variation in the relation of explanatory variables to models (OLS) and yielded in a significant way better results. It turns out that GWR also provided more accurate results on land use changes that occurred over the study period. The data generated provided information on the dynamics of land use change [7].
Tu and Xia [8] compared (OLS) and (GWR). “Traditional regression” cannot show significant local differences in the model variables and cannot handle the spatial autocorrelations that exist in the variables. while the “technique (GWR)” is utilized to explain the correlation between land use and water quality in “Eastern Massachusetts”. “Models (GWR)” are developer models of “OLS”, which is demonstrated by Fisher's exact test and R2 model comparison and corrected “Akaike Information Criterion” (AICc) of both (GWR) and OLS. The results of the models’ (GWR) application explained that the correlation between water quality and land use is not steady in space, but shows a great spatial non-stability. Models “GWR” can help us examine data previously overlooked by OLS models on domestic reasons for water contamination and improve the model's capability to investigate water quality in the existing situation [8].
2.1 Identify gaps in the literature
All the variables used for the predictions used in the “GWR model” are established on satellite imagery. Whereas in this current study, the variables are gathered from governmental municipal departments, field studies, city maps, town maps, satellite imagery, and other numerical operations (plurality and sources of reliable data). There is no similar study or thesis applied to the study area.
The benefit of this research study compared to the previous ones is that it deals with the analysis of functional changes in urban areas according to the relationship with land use on a regional level land use.
The changes in urban functions and land use in the study area from different periods are natural conditions in response to population growth, urbanization, the spatial relations complexity as well as the social and economic developments in the province. (Table 1) and (Figure 2).
Table 1 and Figure 2 show that the total area of the first master plan is (4000) hectares. A large area is occupied by residential functions according to the 1st (M.P) at a rate of “37.5%” of the total area. Industrial and commercial functions have occupied a rate of “17.5%”. That indicates implications for the advancement of these urban functions due to their great significance in developing the province’s economy, especially small industries. Much attention has been paid to the areas intended for transportation and road networks because they influence the process of interaction between the urban functions that make up the city structure. The general services and administration area occupied (20%) of the whole area.
For 2nd (M.P), the total area is “2120” hectares. It comprised multiple lands uses in the province, which is much less than shown in the 1st (M.P). This is due to the exclusion of Kufa town from the master plan. The residential functional area occupies “54.71%” of the total area, which accounts for more than half of the total area. This means that the priority of the master plan is the provision of housing units. Transportation functions areas are occupied by “27.35%” of the (M.P) area. The area of industrial and commercial functions was reduced to “5.55%” of the total area, which is less than the area assigned to it in the other two master plans. The general services and administration area are “12.39%” of the total area. According to the 3rd (M.P), the residential functional area occupies “44.2%” of the total area. This confirms the predominance of this land use area over other land use areas. The area of commercial and industrial functions increased “11.37%” of the total area, compared to the second (M.P). As for the proposed areas for movement functions and transportation, they have occupied “18.96”. The general services and administration area are (6.74) of the total area. The master plan also includes tourism areas of all kinds and levels, as well as empty spaces for future expansions within the province limits, at a rate of “18.73%”. To determine spatial functional land use changes in this study area from 2005 - 2015, Table 2 and Figure 3 show the spatial changes as well as the percentages.
The above data of urban changes in the study area ten years ago (2005 to 2015) were random, and unplanned because of the weakness of the government role. This affects the relationships between elements of existing spatial structures and has also created urban problems.
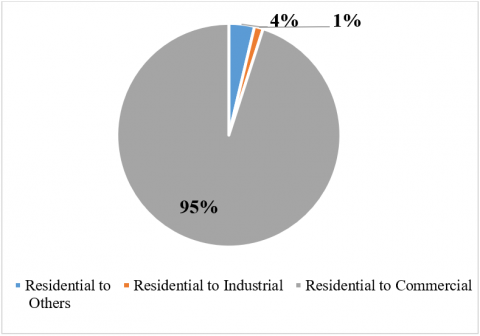
Functional changes that occurred from 2015 to 2020 increased dramatically without local government planning. The authors obtained the following statistics shown in Table 3, Figures 4 and 5 according to the statistical survey from GIS, local municipal data, and processed satellite imagery.
The dominance of functional changes from residential to commercial functions is shown to be significant over industrial change functions and other land use change functions, the ratio was 95% due to the influence of spatial factors. The existence of the international airport site and the location of the University of Kufa as regional Level Land use affected the functional changes in the city (Figure 5).
Figure 2. Urban functions change based on three Master Plans
Source: Table 1
Figure 3. The areas and proportions of urban functions change from 2005 to 2015
Source: Table 2
Figure 4. The areas and proportions of urban functions change from 2015 to 2020
Source: Table 2
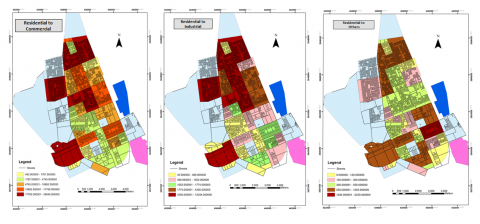
Figure 5. The areas of the urban spatial change from 2015 – 2020
Source: Using the ARC GIS 10.8 software
Table 1. The percentage of urban functions change based on three master plans (M.P) [8]
|
Total Area |
Total % |
Open space& Tourism |
General Services& Administration |
Transportation |
Commercial& Industrial |
Residential |
Urban functions M.P |
|
4000 |
100 |
- |
20 |
25 |
17.5 |
37.5 |
1st M.P |
|
2120 |
100 |
- |
12.39 |
27.35 |
5.55 |
54.71 |
2nd M.P |
|
6500 |
100 |
18.73 |
6.74 |
18.96 |
11.37 |
44.2 |
3rd M.P |
Source: An Najaf Department of Municipalities and An Najaf Department of Urban Planning (unpublished data-2020)
Table 2. Shows the areas and percentages of urban functional change from 2005 – 2015
|
Urban Land use/Year |
2005 |
2015 |
|
Residential functions |
48.8 |
46.5 |
|
Commercial& Industrial |
13.8 |
16.5 |
|
Transportation |
17.2 |
16.7 |
|
General Services& Administration |
9.8 |
7.2 |
|
Open space& Tourism |
9.8 |
10.9 |
|
Infrastructure |
0.6 |
2.2 |
|
Total% |
100.00 |
100.00 |
|
Total area H.C |
6472.3 |
8409.75 |
Source: An Najaf Department of Municipalities and An Najaf Department of Urban Planning (unpublished data-2020)
Table 3. Urban functional change in the study area from 2015 - 2020 [8]
|
To Others |
To Industrial |
To Commercial |
Neighborhoods |
||||||
|
M² |
NO |
M² |
NO |
M² |
NO |
|
|||
|
5832 |
41 |
1884 |
75 |
19568 |
252 |
Ameer |
|||
|
21 |
2 |
816 |
54 |
4308 |
128 |
Qadisiya/Hurafeen |
|||
|
263 |
7 |
1869 |
76 |
6405 |
231 |
Zahra |
|||
|
852 |
19 |
536 |
35 |
3046 |
103 |
Zainab |
|||
|
1265 |
19 |
642 |
78 |
4221 |
210 |
Ansar |
|||
|
441 |
7 |
549 |
44 |
3163 |
78 |
Al QUDS first |
|||
|
263 |
8 |
70 |
13 |
12459 |
77 |
Al QUDS Second |
|||
|
347 |
6 |
242 |
12 |
564 |
33 |
Al Nour |
|||
|
133 |
3 |
422 |
16 |
2025 |
24 |
Tabuk / Shurtah |
|||
|
257 |
4 |
198 |
19 |
1576 |
63 |
Imam Ali |
|||
|
515 |
11 |
148 |
14 |
945 |
24 |
Al Moalmeen |
|||
|
1177 |
22 |
1208 |
44 |
21805 |
357 |
Muthanna and Saad |
|||
|
399 |
11 |
410 |
23 |
4237 |
117 |
Al Zohor |
|||
|
34 |
3 |
190 |
14 |
4243 |
200 |
Al Eskan |
|||
|
725 |
18 |
1051 |
34 |
7592 |
172 |
Al Adala and Alforat |
|||
|
328 |
8 |
634 |
30 |
5297 |
185 |
Ghadir |
|||
|
273 |
9 |
315 |
24 |
3856 |
139 |
Al Siha |
|||
|
126 |
5 |
299 |
30 |
3283 |
110 |
Karama& Ulamaa |
|||
|
175 |
8 |
446 |
27 |
1877 |
116 |
Al Shuaraa |
|||
|
623 |
19 |
303 |
32 |
3079 |
105 |
ELHussein |
|||
|
422 |
13 |
205 |
17 |
9661 |
127 |
Al-Hanana |
|||
|
441 |
12 |
3445 |
58 |
184937 |
290 |
Al Gimaa |
|||
|
389 |
8 |
9576 |
211 |
26480 |
513 |
Al Salam |
|||
|
526 |
8 |
1968 |
78 |
9405 |
278 |
Gary&Atibaa |
|||
|
267 |
5 |
3382 |
93 |
6322 |
278 |
Al Jazaer / Al Wafa |
|||
|
453 |
9 |
11550 |
208 |
16140 |
359 |
Orouba |
|||
|
921 |
17 |
4620 |
160 |
6103 |
204 |
Al Jameea/Al Risalah |
|||
|
834 |
16 |
13157 |
255 |
26678 |
554 |
Alaskri/Makramah |
|||
|
232 |
5 |
9449 |
264 |
27678 |
1163 |
Al Naser/ Jihad |
|||
|
269 |
6 |
12367 |
231 |
42044 |
849 |
Al Jidedat |
|||
|
1260 |
22 |
432 |
20 |
32447 |
407 |
The old city |
|||
|
20063 |
351 |
82383 |
2289 |
501444 |
7746 |
Total |
|||
GWR creates an equation for each feature in the dataset that contains the dependent and explanatory variables for features within the range of each target feature. The shape and extent of the bandwidth depend on user inputs for kernel type, bandwidth method, distance, and some neighbor parameters, with one caveat: if the number of feature neighbors exceeds 1000, only the nearest 1000 are integrated into each local equation [3].
GWR should be applied to datasets containing several hundred features for best results. This is not an appropriate method for small datasets. The tool does not work with multipoint data”. (“https://desktop.arcgis.com”) [9].
In the models of global regression such as (OLS) regression, the results are unreliable when two or more variables have exhibited multicollinearity (when variables are redundant or together tell the same “story”. GWR creates an equation for a local data plane for each element of the dataset Figure 6. When the values of a particular spatially explanatory variable cluster, someone will very probably have problems with local multicollinearity. The condition number (COND) field in the output function class indicates that the findings are unsteady because of the local multicollinearity.
Based on the layers of land uses in the study area, the relationships between the factors associated with the regional land use and the size of the functional change were modeled.
Figure 6. Independent & dependent variables in GWR [9]
To apply this mathematical model (GWR) to the case study, the independent variables are assumed as regional land use (factors) associated with urban functional changes in Table 4.
We assumed the functional changes as a dependent variable, while the independent variables are the distances between regional land uses and neighborhoods, land price and neighborhoods population were also assumed to be independent variables.
An Najaf city urban function variables related to the investigation problem are presented in two directions: function changes and pattern changes. As for the spatial phenomena, they are represented by the total changes in the commercial function and the total changes in the industrial function. Global changes relate to general and other social functions, as well as indicators of the global phenomenon in general, which are the global functional changes of the city.
Table 4. The independent variables in (GWR)
|
Population Density Per/H.C |
land price (for M²) |
Distance from the University (Meter) |
Distance from the airport (Meter) |
Neighborhoods |
|
139.458 |
1925000 |
2355 |
3600 |
Ameer |
|
125.18 |
495000 |
3555 |
2367 |
Qadisiya/Hurafeen |
|
253.715 |
825000 |
3405 |
3005 |
Zahra |
|
219.516 |
275000 |
3976 |
3552 |
Zainab |
|
437.635 |
440000 |
5082 |
3701 |
Ansar |
|
226.886 |
330000 |
5451 |
3287 |
Al QUDS first |
|
80.168 |
330000 |
5908 |
4100 |
Al QUDS Second |
|
114.14436 |
550000 |
4696 |
4435 |
Al Nour |
|
504.856 |
275000 |
6507 |
6006 |
Tabuk / Shurtah |
|
402.765 |
330000 |
4406 |
6675 |
Imam Ali |
|
144.936 |
220000 |
5101 |
5065 |
Al Moalmeen |
|
109.978 |
1925000 |
4406 |
5090 |
Muthanna and Saad |
|
44.572 |
275000 |
5402 |
4725 |
Al Zohor |
|
143.88 |
1100000 |
3254 |
4447 |
Al Eskan |
|
68.53 |
935000 |
1517 |
4549 |
Al Adala and Alforat |
|
265.298 |
935000 |
2926 |
5234 |
Ghadir |
|
42.658 |
275000 |
3743 |
5322 |
Al Siha |
|
387.013 |
220000 |
3395 |
5610 |
Karama& Ulamaa |
|
124.85 |
330000 |
3980 |
6124 |
Al Shuaraa |
|
168.454 |
1100000 |
4411 |
6252 |
ELHussein |
|
109.34 |
1650000 |
4675 |
5948 |
Al-Hanana |
|
150.084 |
330000 |
4696 |
8572 |
Al Gimaa |
|
172.942 |
715000 |
3331 |
6594 |
Al Salam |
|
264.495 |
495000 |
3645 |
6728 |
Gary&Atibaa |
|
337.843 |
330000 |
3160 |
7879 |
Al Jazaer / Al Wafa |
|
137.5 |
385000 |
4132 |
8435 |
Orouba |
|
150.084 |
330000 |
4696 |
8572 |
Al Jameea/Al Risalah |
|
139.26 |
220000 |
5152 |
9946 |
Alaskri/Makramah |
|
597.938 |
220000 |
5860 |
9434 |
Al Naser/ Jihad |
|
443.476 |
330000 |
6118 |
6455 |
Al Jidedat |
|
1168.97 |
4400000 |
6709 |
7477 |
Old City |
Source: Using the ARC GIS 10.8 softwere and field survey
4.1 The results of the first model application (the effect of independent variables on the change of commercial functions)
Figure 7. Local R² GWR: Residential to Commercial functions
Source: Authors
We find that the independent variables have an impact on urban functional change (commercial functions) in the city of An Najaf and that their R² impact was 84%, with an adjusted R² of 80%. See Figure 7, with residual square (2113569244,1341). The coefficient (bandwidth) is one of the most important coefficients of the model (GWR). As for the coefficient of reach and homogeneity, it suggests the existence of an indicator of the drivers of commercial change; it was estimated at (5508.573478). The sample represents equal spatial homogeneity. Analyzes showed equality in sample coverage at the model's highest degree of freedom. For the Sigma indicator, we note that the best model is the one with the lowest indicator value. It should also be noted that the indicator of the independent variables influencing commercial functional change (128,755), which represents the best model, has been reached.
As for the indicator (AlCc) of the (GWR), it indicates the effectiveness of the model in representing the reality of the variables. The percentage is lower and reached (302.274699). This indicates the austerity of the model and actual performance compared to other spatial models.
4.2 The results of the second model application (the effect of the independent variables on industrial functional change)
Note that the independent variables influence the change in urban functions (land use for the industry) in the area of the study. The effect was R² 79%, with an adjusted R² of 75%, see Figure 8, with a residual square (498065498.159888). For a bandwidth parameter, there is an indicator for the influencing variables of industrial change, estimated at (4579.163846). The sample represents the same spatial homogeneity, which means that the analyzes showed equality in the sample coverage area, which is the highest degree of freedom for the sample.
For the indicator (Sigma), we find that the best model is the one with the lowest value of the indicator. We also note that the independent variables affecting the change of industrial function reached an acceptable index (2464.261244). But the commercial functional change model is better than this model. The index (AlCc) of (GWR) indicates the effectiveness of the model in representing the reality of the variables when its percentage is lower than the first model. It reached (1879.9698769). In statistical terms, the first model is better.
Figure 8. Local R² GWR: Residential to industrial functions
Source: Authors
4.3 The results of the third model application (the effect of independent variables on functional change for other functions)
Figure 9. Local R² GWR: Residential to other funcions
Source: Authors
It is noted that the independent variables affect the urban functional change (other land uses) for the study area. Their effect was R² 45%, with an adjusted R² 41%, see Figure 9, and with a residual square (20088033.66242).
As for the (Bandwidth) parameter, it showed that there is an indicator for the variables affecting the functional change for the (other functions). It was estimated at (3575.163855), and thus the sample represents equal spatial homogeneity, meaning that the analyzes showed equality in the areal coverage of the sample, i.e. the highest degree of freedom for the sample.
For the (Sigma) indicator, it is also noted that the independent variables affecting the functional change of the other functions reached (625.923233), which is an acceptable value, but the model of the commercial functional change is better than this model. As for the (AlCc) index of the (GWR), it indicates the effectiveness of the model in representing the reality of the variables whenever its percentage is lower. It reached (1348.173664). This indicates that the first model is better.
The results of this study showed logical conclusions about the relationship between distance from regional land use and the magnitude of functional change in land use in neighborhoods as a function of population and price of housing. land use, which is influenced by regional land use (International Airport site and the University of Kufa campus site).
The results showed that the neighborhoods near the site of An Najaf International Airport and Kufa University Campus such as (Old City, Al Quds 1, Al Quds 2, Al Nour, Shurtah, Al Jidedat, Al Moalmeen, Al-Hanana, Ameer, Ansar etc.) have experienced a large number of functional land use changes, while other neighborhoods (remote neighborhoods) have not experienced significant functional land use changes due to their remoteness from the regional land uses, as shown by the results of the correlation between the weight of the site with the amount of total functional changes.
Using the (GWR) application, which is part of the statistical analysis tools in Geographic Information Systems (GIS), a strong direct correlation was found between the regional spatial component (regionally influenced land uses) by the factors associated with it and the evolution function of commercial land use with an adjusted R² of 80%. The mathematical model has a high and acceptable statistical significance with different correlation rates in the neighborhoods of An Najaf city during the study period. The variation of the change is due to the variation of the influencing factors (related to the regional component).
There is a positive correlation between the regional spatial component through the associated factors and functional changes in industrial land uses with an adjusted R² of 75%. The mathematical model has a high and acceptable statistical significance with different proportions for the neighborhoods of An Najaf city during the study period. due to the different impacts of the influencing factors (based on the regional component). The model used in this study is acceptable due to the fact that commercial and industrial functions changes accounted for the majority of the total urban land use functional changes in An Najaf city during the study period at 97% rate of the total observed change.
The study area witnessed great economic, social, and urban changes that affected the development of land uses as well as a change of urban functions. The functional change in land use happened without consulting the urban plans, and has a negative impact on the quality of life in the urban environment, as we were able to determine during the study period. The presence of regional land use and its influencing factors contributed directly and strongly to the acceleration of functional changes.
During the study period, there is a discrepancy in the population density distribution of urban districts. The area allocated for commercial land use has increased almost fivefold in 2020 due to the change in functions from residential land use to unplanned commercial use. The master plan does not consider the impact of the regional element (International Airport and Kufa University Campus site) on future functional changes, functional changes that occurred from 2015 to 2020 increased dramatically without local government planning. This is the reason for many urban problems.
There is a positive relationship between distance from regional land use and the functional land use change in neighborhoods. The nearest land uses influenced by regional land use (international airport site and Kufa University campus) more than remote land uses due to their remoteness from land use of the regional land uses, because of the economic factor’s impact associated with regional land uses.
The low importance of land uses for (other functions) resulted in the absence of influence of land use at the regional scale on the functional change of these uses compared to commercial and industrial uses.
The three mathematical models applied in the article have high and acceptable statistical significance. During the work, the authors faced difficulty in obtaining the necessary data in the analysis.
6.1 Prospects for future research
[1] Chapin, F.S., Kaiser, E.J. (1979). Urban Land Use Planning. University of Illinois, St. Champaign.
[2] Fotheringham, A., Charlton, M., Brunsdon, C. (1998). Geographically weighted regression: A natural evolution of the expansion method for spatial data analysis. February Environment and Planning, 30(11): 1905-1927. http://dx.doi.org/10.1068/a301905
[3] Javi, S.T., Malekmohammadi, B., Mokhtari, H. (2014). Application of geographically weighted regression model to the analysis of spatiotemporal varying relationships between groundwater quantity and land-use changes (case study: Khanmirza Plain, Iran). Environmental Monitoring and Assessment, 186: 3123-3138. https://doi.org/10.1007/s10661-013-3605-5
[4] Albasri, N.A.H., Al-Jawari, S.M., Al-Mosherefawi, O.J. (2022). Prediction of urban spatial changes pattern using Markov chain. Civil Engineering Journal, 8(4). http://dx.doi.org/10.28991/CEJ-2022-08-04-07
[5] Wang, Y.Y., Kockelman, K.M., Wang, X.K. (2011). Anticipating land use change using geographically weighted regression models for discrete response. Transportation Research Record: Journal of the Transportation Research Board, 2245(1): 111-123. https://doi.org/10.3141/2245-14
[6] Zhao, C.H., Jensen, J.L.R., Weaver, R. (2020). Global and local modeling of land use change in the border cities of Laredo, Texas, USA and Nuevo Laredo, Tamaulipas, Mexico: A comparative analysis. Land, 9(10): 347. https://doi.org/10.3390/land9100347
[7] Shariff, N.M., Gairola, S., Talib, A. (2010). Modelling urban land use change using geographically weighted regression and the implications for sustainable environmental planning. In international congress on environmental modelling and software modelling for environment’s sake, fifth biennial meeting, Ottawa, http://www.iemss.org/iemss2010/index.php?n=Main.Proceedings.
[8] Tu, J., Xia, Z.G. (2008). Examining spatially varying relationships between land use and water quality using geographically weighted regression I: model design and evaluation. Science of The Total Environment, 407(1): 358-378. https://doi.org/10.1016/j.scitotenv.2008.09.031
[9] https://desktop.arcgis.com/en/arcmap/10.6/tools/spatial-statistics-toolbox/geographically-weighted-regression.htm, accessed on Dec. 12, 2022.