Noor Alhuda Khalil* | Ghada M. Ismael Kamoona
© 2022 IIETA. This article is published by IIETA and is licensed under the CC BY 4.0 license (http://creativecommons.org/licenses/by/4.0/).
OPEN ACCESS
The spaces of the universities are among spaces in which it is necessary to provide indoor air quality, it focuses on airborne pollutants, health, safety, and thermal comfort issues, which will reflect positively on the health and performance of occupants, as universities are under increasing pressure to deal and respond with climate changes and sustainable development issues and other challenges associated with them. The University of Baghdad is among the prestigious universities at the level of Iraq and the Arab world as a whole, and to face the hot and dry climatic challenges of Baghdad city and ensure the strengthening of the immunity of the occupants in the educational buildings, the research problem was represented by testing indoor air quality in educational spaces and knowing its effects on the occupants. Therefore, the study evaluated two types of educational spaces (studio and classroom) in two evaluations, the first is the objective evaluation, which uses sensors to monitor indoor air quality, where (CO2, temperature, and relative humidity) were evaluated, and the second evaluation is a self-assessment, where the distribution of questionnaires on students, that tested the effect of air quality and appear disease symptoms on them, was monitored in two different evaluation periods, summer and winter. The obtained results showed that CO2 concentration levels were above the recommended limits in both spaces but the temperature and humidity are in an acceptable range. So based on the measured results, methods are proposed to improve indoor air quality in the classroom, and then came up with recommendations could be applied in similar spaces in the future.
air temperature, indoor air quality, CO2 concentration, educational buildings, humidity, immunity, sensors
The indoor environment quality (IEQ) of buildings determines the human dimensions, including physical comfort and human psychology, to provide comfortable and healthy internal environments for human work, and the quality of the internal environment takes into account its effects on human health and performance, including indoor air quality, thermal comfort, natural daylight, visual comfort, acoustics, electromagnetic frequency levels, monitoring of working environments, potable waters, Functional Convenience and view [1-3].
In recent years, indoor air quality (IAQ) has become an internationally recognized issue, that has attracted the attention of researchers and building occupants to improve the air quality in building spaces [4]. The optimum indoor air quality (IAQ) in the building spaces was defined according to (ASHRAE (62.1-2016) as the air that does not contain pollutants, and the occupants of the building express satisfaction with it at a rate of no less than (80%), and the studies conducted by the United States Environmental Protection Agency (USEPA), that the presence of pollutants in indoor environments is more dangerous than the presence of pollutants in outdoor environments, which are often five times higher than pollutants in outdoor environments, The percentage may reach (100%) in extreme cases [5].
Students in classrooms are exposed to indoor pollutant sources, and providing good indoor air quality is very important to them since poor IAQ could potentially affect students’ comfort, productivity, and academic achievement [6, 7]. Therefore, investigating indoor air quality and indoor environmental quality in educational spaces helps determine the levels of pollutants and provides guidelines for providing good conditions for indoor air quality in educational spaces. Indoor air quality is affected by a variety of outdoor air pollution sources such as traffic, construction, industrial, and combustion activities [8], as well as indoor sources such as ventilation equipment, furniture, and human activities which include (the number of students in class, lessons durations, breaks between lessons) [9].
The association between IAQ in the classroom, student absence, health, or educational performance; and productivity has been the subject of several recent research. Researchers realized that inadequate ventilation is a major factor affecting the student’s health and performance [10], as exposure to air pollutants may cause many diseases [11], such as irritated eyes or nose, blocked nose, headache, and so forth [12], cardiovascular disease [13], Sick building syndrome symptoms [14], and several respiratory diseases [15].
Given the recent spread of diseases and epidemics around the world, including COVID-19, and its negative impact on the closure of educational buildings, many countries have taken public and social health measures that work to operate educational buildings and to ensure that the risks of injury to their occupants are reduced, and among these steps is to provide Natural ventilation inside the spaces of the buildings [16].
Natural ventilation is defined as: “The process by which fresh air is provided to the building spaces, and rotten (impure) air is removed from them.” In the external environment, it is usually pure because it contains oxygen gas (O2) necessary for breathing, and spoiled air is the air confined within closed spaces and contains pollutants, such as carbon dioxide (CO2), microorganisms, odors, and particles resulting from textiles, cooking and carpets, ...etc. In addition, fresh air is used to remove heat from the space, and thus improve thermal comfort in the summer, and ventilation is usually used as a mechanism for cooling, and the required airflow. Natural ventilation is one of the passive design strategies, and passive design strategies refer to the use of natural means to reduce the need for mechanical systems, achieve balanced conditions for the building’s internal environment and reach high levels of thermal comfort for its occupants [17].
The CO2 concentration is monitored and used as a proxy for ventilation performance [18]. CO2 has been used as a ventilation indicator since 1858. Later, CO2 monitoring became gradually a convenient way to monitor IAQ [19]. A CO2 concentration of 1800 mg/m3 (or 1000 ppm) was often taken as the upper limit for a good IAQ, according to the previous version of ASHRAE (American Society of Heating, Refrigerating and Air Conditioning Engineers) Standard 62.1-2016, Ventilation for Acceptable IAQ [20]. At this time, relevant standards mainly use the minimum ventilation rates as the design criteria, while CO2 is the most commonly used tracer gas for calculating ventilation rate [21]. However, CO2 monitoring protocols used in these studies varied a lot: the numbers and locations of sensors mainly depended on researchers’ personal experiences [22].
One of the standards for CO2 monitoring is the ISO (International Organization for Standardization) [23, 24], according to which the sampling location is suggested to be in the center of the space with a height of 1.0-1.5 m above the floor, representing the breathing zone of the occupants. However, in ANSI/ASHRAE Standard 62.1, the height of the breathing zone is described as 0.75-1.8 m above the floor [25] and based on that the LEED recommends 0.9-1.8 m above the floor as the sampling height for CO2 [26], in the terms of the horizontal location instead of the center, ASTM International former (American Society for Testing and Materials) stipulates that the measurement point should be in 2.0 m away from occupants to avoid local effects [27].
The studies showed that an infected-speaking person in a space can led to levels of virus-containing aerosols able to cause an infection in other occupants breathing the air in the same space [28]. In fact, in conditions where the relative humidity is far below 100%, droplets emitted during speaking quickly lose their water content, and much smaller droplet cores with sizes below about 10 μm remain airborne for minutes to hours, and thus, they can diffuse by thermal convection, turbulence, and other air movements and accumulate in a closed space. Based on this evidence, the World Health Organization (WHO) published guidelines to help policymakers run educational spaces as safe as possible during the COVID-19 pandemic. More specifically, the guidance suggests maintaining a clean environment by disinfection of surfaces and shared objects and ensuring effective ventilation by frequently opening windows and doors. Enhanced ventilation may be a key element in facing the spread of COVID-19 in enclosed environments, especially, in densely seated classrooms [29-31].
Also, for appropriate temperature and humidity controls in educational spaces, continued environmental stress can drain students’ physical and mental resources which ultimately affects their performance, and the indoor environmental variables like air temperature, relative humidity, mean radiant temperature, air velocity, clothing levels during lecture hours, and the amount of physical activity done in the classroom affects the human thermal comfort sensation. So that has the acceptable range for temperature in winter is (20-23)℃, and in summer the acceptable range of temperature is (22-25)℃, as for the humidity has an acceptable range in summer and winter is between 30-60% [32, 33].
Based on the previous literature, indoor air quality significantly impacts the occupants' health, immunity, and productivity, and poor indoor air leads to the formation and spread of several respiratory and epidemic diseases.
Therefore, the researchers tested two types of university educational spaces in the Department of Architecture to know the indoor air quality based on the criteria of ideal ranges of CO2, temperature, and humidity.
The research will adopt an experimental analytical methodology to study the indoor air quality of educational spaces.
The research aims to achieve healthy indoor air quality in educational spaces to improve the immunity of students, this is done by checking the indoor air quality of the winter and summer seasons during different periods and then coming up with recommendations that could be applied in similar spaces in the future to avoid indoor air pollution, this will be done through the following steps:
2.1 Description of the climatic conditions and case study area
For the current study, teaching spaces of the Baghdad campus of the University of Baghdad were investigated. This campus is located in the urban area of Al-jadiryia (33◦16 N, 44◦22 E). Baghdad has a hot dry climate in summers with cool winters. In Baghdad, the average temperature ranges from 9.5℃ (49°F) in January to 35℃ (95 °F) in July, when highs are as high as 44℃ (111°F). The summer is hot and the sunshine reigns supreme, with peaks around 50℃ (122°F): these temperatures make Baghdad one of the hottest capitals in the world. In winter, days are mild but nights are often cold, and the temperature may drop to a few degrees below freezing [34].
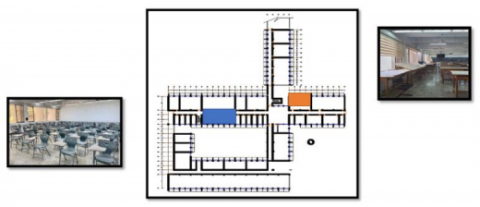
The architectural department is a two-story building with having capacity of 200 students from the age group 18 to 22 years. A brief survey was conducted for data collection to identify indoor air quality, thermal comfort, and relative humidity and for thorough information collection of the monitored classroom and studio (Figure 1). A detailed description of the classroom and studio is given in Table 1.
Table 1. Description of monitored classrooms
|
Space Type |
Windows |
Window Areas |
Doors |
Spaces of Areas |
No. of Occupants |
|
Classroom |
4 |
9.36 m2 |
2 |
105.3 m2 |
35 |
|
Studio |
6 |
14.04 m2 |
2 |
153 m2 |
25 |
Figure 1. Selected studio and classroom
2.2 Objective measurements
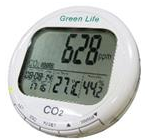
Indoor air temperature, relative humidity, and CO2 concentrations were measured with a multifunctional measuring device (DESKTOP CO2 MONITOR), Model 7787 Green Life. The device measures the carbon dioxide concentration in the range from 0 ppm to 10,000 ppm. Its sensitivity is 75 ppm for carbon dioxide and the precision is ±3%. The accuracy for temperature is from 0℃ to +50℃ and the precision is ±0.5%. The accuracy for relative humidity is from 0% to 100% and the precision is 1.8%. A detailed description of the sensor is given in Table 2.
Table 2. Specification of carbon dioxide meter
|
Meter Picture |
Meter Name |
Meter Function |
|
DESKTOP CO2 MONITOR Model 7787 Green Life |
-Measuring the proportion of CO2 -Temperature -humidity |
The measuring device was placed in the center of the classroom at a height of 1.1 m above the floor.
In the first phase of the research,10 measurements were made in the studio during the winter season, starting from 2 in January and to 4 in April month, and 6 measurements were taken daily for indoor air temperature, relative humidity, and hourly carbon dioxide concentrations (8:30 am, 9:30 am, 10:30 am, 11:30 am, 12:30 pm, 1:30 pm). the floor area of the studio is 17.8 x 9 m, and it is important to note that the studio is located on the ground floor of the building in a northwest direction. The 26 students received consecutive lessons in architectural design، the first part of the lesson started at 8:30 am, then a break at 10:30 am, and then continued the lesson from 11:00 am to 1:30 pm. During breaks, they opened windows to ventilate the room and reduce the CO2 concentrations. The studio with a volume of 664.8 m3 and a capacity of up to 26 persons were naturally ventilated for 5 minutes (1 door and 2 windows were opened) before measurement and after each lesson. Then all windows and doors were closed (during the lesson), and no forced ventilation or air-conditioning system was used in the studio.
There were 6 windows and 26 desks from particleboard, 26 leather stools, a blackboard for chalk, Display Screen, and flooring from mosaic tiles in the studio.
The investigation was conducted during the winter semester and was conducted during successive lessons in Architectural Design every Monday and Thursday for 12 weeks.
The results were discussed for 12 weeks. In the classroom were made 10 measurements during the winter season, starting from 2 in January to 4 in April, and 3 measurements were taken daily for indoor air temperature, relative humidity, and hourly carbon dioxide concentrations (8:30 am, 9:30 am, 10:30 am). the floor area of the classroom is 11.7 x 9 m, and it is important to note that the classroom is located on the ground floor of the building in a northeast direction. The 35 students received the lesson, the lesson started from 8:30 am to 10:30 am. Before the lecture, they opened windows to ventilate the room and reduce the CO2 concentrations. The classroom with a volume of 436 m3 and a capacity of up to 56 persons were naturally ventilated for 5 minutes (door and 2 windows were opened) before measurement and after each lesson. Then all windows and doors were closed (during the lesson), and no forced ventilation or air-conditioning system was used in the studio. The classroom had 4 windows and 56 plastic chairs, a blackboard for chalk, Display Screen, and flooring from mosaic tiles. The investigation was conducted during the winter semester and was conducted during the lecture every Monday for 12 weeks. The results were discussed for weeks.
In the second phase of the research,10 measurements were made in the studio during the summer season, starting from 4 in April month and to 6 in June, and 6 measurements were taken daily for indoor air temperature, relative humidity, and hourly carbon dioxide concentrations (8:30 am, 9:30 am, 10:30 am, 11:30 am, 12:30 pm, 1:30 pm). An investigation was performed in the same studio during the first stage of the research work. All windows and doors were opened for 5 minutes before the lecture, and then they were closed. in the studio was used air-conditioning system was used in the classroom. The investigation was performed during the summer semester and was conducted during successive lessons in Architectural Design every Monday and Thursday for 8 weeks and the results were discussed for 8 weeks.
In the classroom were made 10 measurements during the summer season, starting from 4 in April month and to 6 in June, and 3 measurements were taken daily for indoor air temperature, relative humidity, and hourly carbon dioxide concentrations (8:30 am, 9:30 am, 10:30 am).
An investigation was performed in the same classroom during the first stage of the research work. All windows and doors were opened for 5 minutes before the lecture, and then they were closed. in the classroom was used air-conditioning system.
The investigation was performed during the summer semester and was conducted during successive lessons every Monday for 8 weeks and the results were discussed for 8 weeks.
2.3 Subjective measurements
A subjective assessment was conducted using a questionnaire in the university classrooms and studios to assess the indoor air quality and study the effect of indoor environmental parameters on students' performance and the possibility of the appearance of sick building syndrome symptoms that can be distinguished from other symptoms. The form included the following information:
Section One | General Information: The objective is to provide general information about the sample participating in the questionnaire, such as determining the age, gender, and type of space.
Section Two | Indoor Air Quality Assessment:
Section Three | Test for the presence of disease symptoms associated with buildings that formed because of air pollution:
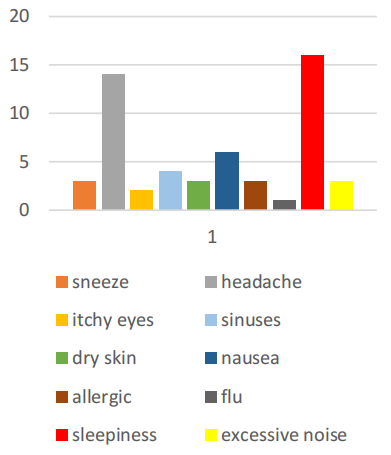
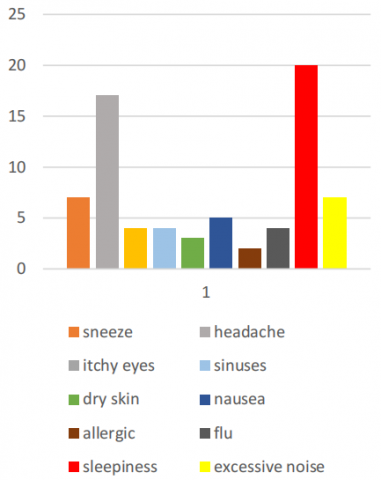
It includes questions about the students' suffering from the symptoms of Sick Buildings Syndrome, and the symptoms identified by the World Health Organization have been approved. The following symptoms have been mentioned in the questionnaire (sneezing, headache, itchy eyes, sinuses, dry skin, nausea, allergies, flu, sleepiness, and excessive noise).
3.1 Results of objective measurements
The following graphs show average values of CO2 concentrations, air temperature, and relative humidity in winter and summer semesters in the studio and classroom.
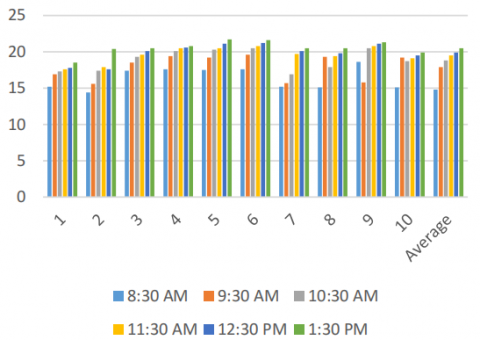
Firstly: the average value of CO2, temperature, and humidity in the studio during the Winter season.
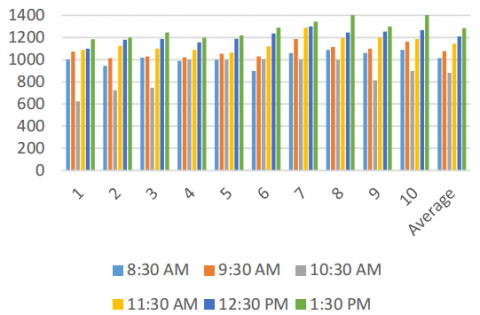
We note that the average value of the CO2 level in the first part of the lecture, which is from (8:30-10:30) am is acceptable, but in the second part of the lecture, which is from (11:00 am-1:30 pm), is unacceptable according to the standards that show that the concentration ratio of CO2 in the interior spaces, which is 1000 ppm.
Figure 2. The average value of CO2 concentration (ppm) of the Studio in the winter season
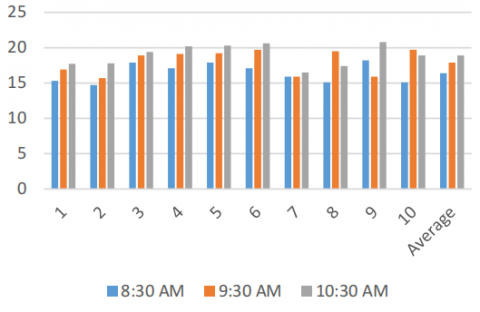
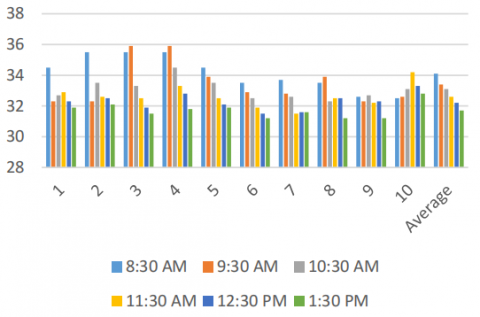
The average value of air temperature in the first part of the lecture, which is from (8:30-10:30) am is unacceptable, but in the second part of the lecture, which is from (11:00 am-1:30 pm) is acceptable, according to the standards that show that the ideal degree in the interior spaces ranges from) 20-23℃.
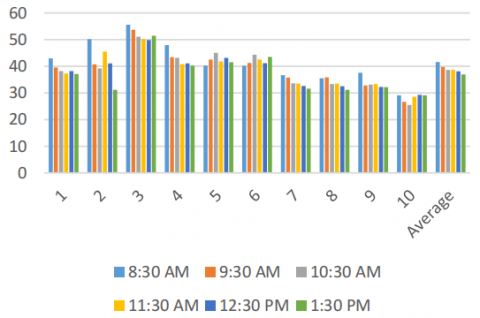
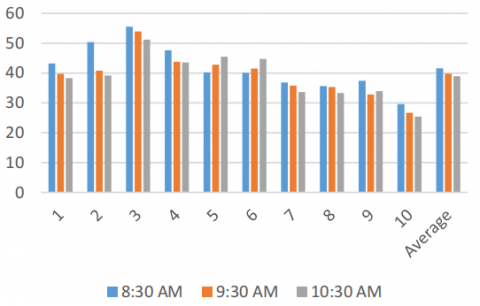
As for the relative humidity levels in indoor spaces, they are within the ideal standards according to the Environmental Protection Agency, where the ideal humidity range in space is between (30-50)%, or at least below 60% (Figures 2, 3, 4).
Secondly: the average value of CO2, temperature, and humidity in the classroom during the Winter season.
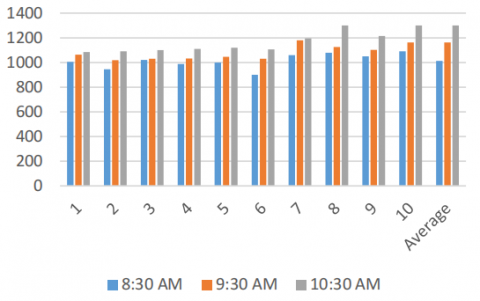
We note that the average value of the CO2 level in the first reading, which is at 8:30 am is acceptable, but the other readings, are unacceptable according to standards.
The average value of air temperature is unacceptable according to standards.
As for the relative humidity levels in indoor spaces, they are within the ideal standards according to standards (Figures 5, 6, 7).
Thirdly: the average value of CO2, temperature, and humidity in the studio during the summer season.
We note that the average value of the CO2 level is unacceptable according to standards.
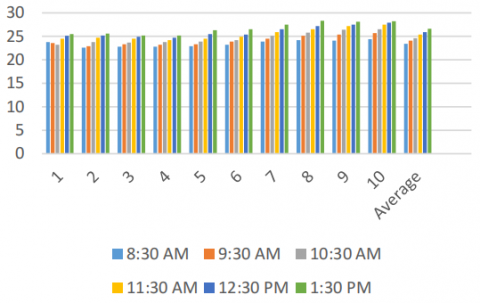
The average value of air temperature is acceptable because they used air-conditioning system in the space.
Figure 3. The average value of the temperature (℃) of the studio in the winter season
Figure 4. The average value of the humidity (%) of the studio in the winter season
Figure 5. The average value of CO2 (ppm) concentration in the classroom in the winter season
Figure 6. The average value of the temperature (℃) of the classroom in the winter season
Figure 7. The Average value of the humidity (%) of the classroom in the winter season
As for the relative humidity levels in indoor spaces, they are within the ideal standards according to standards (Figures 8, 9, 10).
Fourthly: the average value of CO2, temperature, and humidity in the classroom during the summer season.
We note that the average value of the CO2 level is unacceptable according to standards.
The average value of air temperature is acceptable because they used air-conditioning system in the space.
As for the relative humidity levels in indoor spaces, they are within the ideal standards according to standards (Figures 11, 12, 13).
Figure 8. The average value of CO2 concentration (ppm) of the Studio in the summer season
Figure 9. The average value of the temperature (℃) of the studio in the summer season
Figure 10. The average value of the humidity (%) of the studio in the summer season
Figure 11. The average value of CO2 (ppm) concentration in the classroom in the summer season
Figure 12. The average value of the temperature (℃) of the classroom in the summer season
Figure 13. The Average value of the humidity (%) of the classroom in the summer season
3.2 Results of subjective measurements
The questionnaire forms were distributed to the students in the selected spaces, with an indication of the purpose of conducting the questionnaire.
25 questionnaires were collected from the students in the studio and 35 questionnaires from the students in the classroom.
The following are the results of the survey and its analysis:
Section One - general information
Where the most important characteristic of the sample members is the diversity of the participants’ sample in gender and space, but these differences did not affect the results (Figures 14, 15).
Figure 14. Number of students in the studio
Figure 15. Number of students in the classroom
Section Two - Indoor Air Quality Assessment Results:
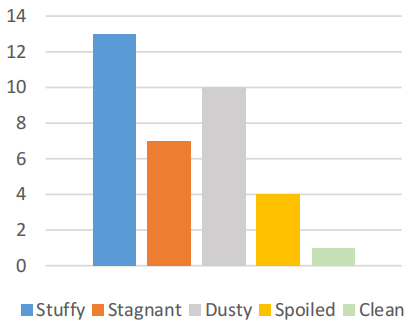
The results of the questionnaire about the student’s assessment of indoor air quality in the studio were analyzed. Figure 16. shows students' dissatisfaction with indoor air quality.
Figure 16. The assessment of IAQ from students in the studio
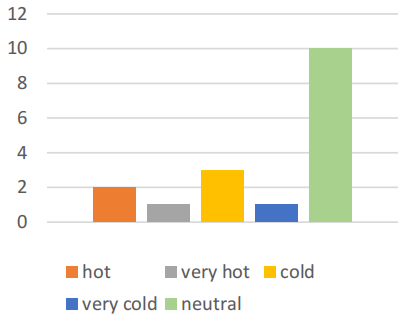
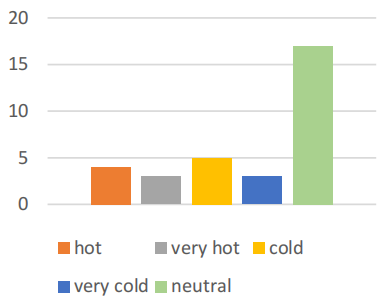
The results of the questionnaire about the student’s assessment of air temperature in the studio were analyzed. Figure 17 shows students' satisfaction with air temperature.
Figure 17. The assessment of air temperature from students in the studio
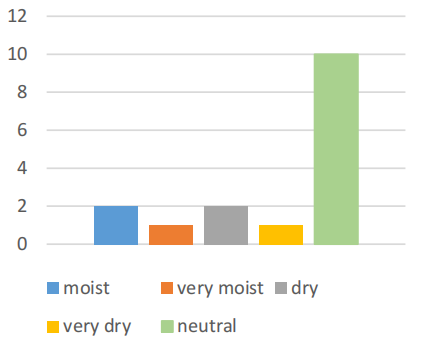
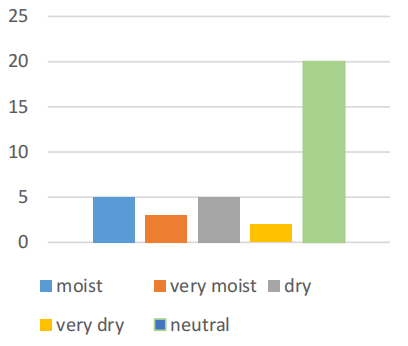
The results of the questionnaire about the student’s assessment of air humidity in the studio were analyzed. Figure 18 shows students' satisfaction with air humidity.
Figure 18. The assessment of air humidity from students in the studio
The results of the questionnaire about the student’s assessment of indoor air quality in the classroom were analyzed. Figure 19 shows students' dissatisfaction with indoor air quality.
Figure 19. The assessment of IAQ from students in the classroom
The results of the questionnaire about the student’s assessment of air temperature in the classroom were analyzed. Figure 20 shows students' satisfaction with air temperature.
Figure 20. The assessment of air temperature from students in the classroom
The results of the questionnaire about the student’s assessment of air humidity in the classroom were analyzed. Figure 21 shows students' satisfaction with air humidity.
Figure 21. The assessment of air humidity from students in the classroom
Figure 22. Sick Building Syndrome Symptoms in students in the studio
Section Three - Testing the sick building syndrome symptoms:
The criterion for infection with sick building symptoms is generally the infection of at least one symptom with repeated infection while inside the building, and these symptoms decrease or disappear immediately or gradually after leaving the building. The building is considered sick if 20% of the students have these symptoms, and the results showed that 85% of the students suffer from sick symptoms in the studio and classroom (Figures 22, 23).
Figure 23. Sick Building Syndrome Symptoms in students in the classroom
The study concluded, through the objective results presented, that the concentrations of CO2 in the classrooms and studios in summer and winter, greatly exceeded the limit value according to ASHRAE standards, while the temperature and humidity are in acceptable ranges.
As for the subjective results (using the questionnaire), it was shown that the occupants are not satisfied with the indoor air, in addition to the appearance of several symptoms on them, which is the symptoms of the sick building syndrome, which negatively affected the immunity of the occupants and their health and productivity.
The presented results, therefore, show that it is important to suggest optimization measures to reduce CO2 concentrations and ensure thermal comfort at the same time:
1- Maximize outdoor air in indoor spaces by opening windows and doors to increase the airflow of outdoor air into the building, or by adjusting the building’s Heating, Ventilation, and Cooling (HVAC) system also to increase the amount of outdoor air that enters indoor spaces.
2- Installation of permanent CO2 sensors in educational spaces to report if the CO2 level increased in the spaces.
3- Installation of air filters and air Purifiers on air conditioners to make continuous filtration of the air.
4- Disinfection and fumigation of the spaces.
5- Regulating the number of students in proportion to the space, reducing lesson time, and increasing the number of breaks.
6- Switch to using natural alternatives in cleaning materials.
7- Adding indoor plants that reduce the concentration of VOCs in the air and improve occupants' well-being too.
8- Replace chalkboards with whiteboards.
9- Prioritize maintenance because replacing or cleaning an air conditioner’s filters is critical otherwise, “clogged, dirty filters block normal airflow” and reduce a system’s efficiency.
10- Continue to monitor air quality, Because the air quality can change with the seasons, the weather, and light levels.
The author gratefully acknowledges to Faculty of Engineering /Architectural department, Baghdad University.
The authors are grateful to all the students who participated in the questionnaire survey and contributed their valuable time.
[1] Mujeebu, M.A. (2019). Introductory Chapter: Indoor Environmental Quality. In (Ed.), Indoor Environmental Quality. IntechOpen. https://doi.org/10.5772/intechopen.83612
[2] Hamad, S.H., Ibrahim, M. (2020). Developing an indoor environment assessment tool for residential buildings. The Journal of Engineering, 26(11): 62-83. https://doi.org/10.31026/j.eng.2020.11.04
[3] Alsawaf, E.S., Albadry, A.M. (2022). Principles for the sustainable design of hospital buildings. International Journal of Sustainable Development and Planning, 17(6): 1797-1808. https://doi.org/10.18280/ijsdp.170614
[4] Fanger, P.O. (2006). What is IAQ? Indoor Air, 16(5): 328-334. https://doi.org/ 10.1111/j.1600-0668.2006.00437.x
[5] Saad, S.M., Andrew, A.M., Shakaff, A.Y., Saad, A.R., Kamarudin, A.M., Zakaria, A. (2015). Classifying sources influencing indoor air quality (IAQ) using artificial neural network (ANN). Sensors (Switzerland), 15(5): 11665-11684. https://doi.org/10.3390/s150511665
[6] Haverinen-Shaughnessy, U., Shaughnessy, R.J., Cole, E.C., Toyinbo, O., Moschandreas, D.J. (2015). An assessment of indoor environmental quality in schools and its association with health and performance. Building and Environment, 93: 35-40. https://doi.org/10.1016/J.BUILDENV.2015.03.006
[7] Toyinbo, O., Shaughnessy, R.J., Turunen, M., Putus, T., Metsämuuronen, J., Kurnitski, J., Haverinen-Shaughnessy, U. (2016). Building characteristics, indoor environmental quality, and mathematics achievement in Finnish elementary schools. Building and Environment, 104: 114-121. https://doi.org/10.1016/J.BUILDENV.2016.04.030
[8] Wark, K., Warner, C.F. (1997). Air Pollution: Its Origin and Control. Pearson, 3rd edition.
[9] Daisey, J.M., Angell, W.J., Apte, M.G. (2003). Indoor air quality, ventilation and health symptoms in schools: an analysis of existing information. Indoor Air, 13: 53-64. https://doi.org/10.1034/J.1600-0668.2003.00153.X
[10] Pulimeno, M., Piscitelli, P., Colazzo, S., Colao, A., Miani, A. (2020). Indoor air quality at school and students’ performance: Recommendations of the UNESCO chair on health education and sustainable development & the Italian society of environmental medicine (SIMA). Health Promotion Perspectives, 10(3): 169-174. http://dx.doi.org/10.34172/hpp.2020.29
[11] Sami, E., Alalwan, H. (2016). Sick buildings phenomenon: The role of good indoor air quality in the elimination of sick office buildings syndrome. IAQHAC 2017 – Workshop on Indoor Air Quality in Hot Arid Climate, 33-55. https://www.academia.edu/41454913/Indoor_air_pollution_sources_particularly_Skunk_and_their_impacts_on_health_and_the_environment_in_the_Occupied_Palestinian_Territories_PP_204_221_In_Conference_Proceedings_Full_Book_.
[12] Sabrani, N.A. (2012). The Effect of indoor air quality (IAQ) towards occupants’ psychological performance in office buildings. Journal Design + Built, 4(2001): 49-61.
[13] Brook, R.D., Rajagopalan, S., Pope, C.A., Brook, J.R., Bhatnagar, A., Diez-Roux, A.V., Holguin, F.E., Hong, Y., Luepker, R.V., Mittleman, M.A., Peters, A., Siscovick, D.S., Smith, S., Whitsel, L.P., Kaufman, J.D. (2010). Particulate matter air pollution and cardiovascular disease: An update to the scientific statement from the American Heart Association. Circulation, 121(21): 2331-2378. https://doi.org/10.1161/CIR.0b013e3181dbece1
[14] Roberts, B.N., Field, E., Engineer, A., Sensors, A. (2014). Saving energy & meeting regulations in learning spaces with CO2-based ventilation control. Amphenol Corporation, p. 3.
[15] Berglund, B., Brunekreef, B., Knoppel, H., Lindvall, T., Molhave, M., Skov, P. (1991). Indoor Air Quality & Its Impact on Man Effects of Indoor Air Pollution on Human Health. https://doi.org/10.5772/18806
[16] Aguilar, A.J., de La Hoz-Torres, M.L., Martínez-Aires, M.D., Ruiz, D.P. (2021). Monitoring and assessment of indoor environmental conditions after the implementation of COVID-19-based ventilation strategies in an educational building in southern Spain. Sensors, 21(21): 7223. https://doi.org/10.3390/s21217223
[17] Kamoona, G. (2016). Passive design strategies to enhance natural ventilation in buildings "election of passive design strategies to achieve natural ventilation in iraqi urban environment with hot arid climate". Journal of Engineering, 22(6): 16-38.
[18] di Gilio, A., Palmisani, J., Pulimeno, M., Cerino, F., Cacace, M., Miani, A., de Gennaro, G. (2021). CO2 concentration monitoring inside educational buildings as a strategic tool to reduce the risk of Sars-CoV-2 airborne transmission. Environmental Research, 202: 111560. https://doi.org/10.1016/j.envres.2021.111560
[19] Sundell, J. (2004). On the history of indoor air quality and health. Indoor Air, Supplement, 14(s7): 51-58. https://doi.org/10.1111/j.1600-0668.2004.00273.x
[20] BS ISO 17772 1. (2017). Energy performance of buildings - Indoor environmental quality Part 1: Indoor environmental input parameters for the design and assessment of energy performance of buildings. ISO, 39.
[21] Batterman, S. (2017). Review and extension of CO2-based methods to determine ventilation rates with application to school classrooms. International Journal of Environmental Research and Public Health, 14(2): 1-22. https://doi.org/10.3390/ijerph14020145
[22] Mahyuddin, N., Awbi, H.B. (2012). A review of CO2 measurement procedures in ventilation research. International Journal of Ventilation, 10(4): 353-370. https://doi.org/10.1080/14733315.2012.11683961
[23] ISO. ISO_16000-26. Indoor Air - Part 26: Sampling Strategy for Carbon Dioxide (CO2). Geneva, Switzerland: ISO, 2012. https://www.iso.org/standard/52140.html.
[24] Fidel, R. (2015). The MENA ISO 26000 project (1/2). Prog Addit Manuf, 1(10): 9-20. http://www.libnor.gov.lb/CustomPage.aspx?id=44.
[25] ASHRAE. (2016). ANSI/ASHRAE addendums to ANSI/ASHRAE standard 62.1-2016: Ventilation for acceptable indoor air quality. https://www.ashrae.org/File%20Library/Technical%20Resources/Standards%20and%20Guidelines/Standards%20Addenda/62.1-2016/62_1_2016_d_20180302.pdf.
[26] Taylor, S.T. (2005). LEED® and standard 62.1. ASHRAE Journal, 47(9). https://www.scribd.com/document/44845310/ASHRAE-Journal-LEED-and-Standard-62-1-Taylor.
[27] Kranzl, L. (2021). Exploring innovative indicators for the next-generation EPC features - Comfort. no. 845958, pp. 22-24. www.X-tendo.eu.
[28] Mikhailov, E., Vlasenko, S., Niessner, R., Pöschl, U. (2004). Interaction of aerosol particles composed of protein and salts with water vapor: hygroscopic growth and microstructural rearrangement. Atmospheric Chemistry and Physics, 4(2): 323-350. https://doi.org/10.5194/acp-4-323-2004
[29] World Health Organization. (2006). Air quality guidelines. Air Quality Guidelines by World Health Organization, 91: 1-496.
[30] Baloch, R.M., Maesano, C.N., Christoffersen, J., Banerjee, S., Gabriel, M., Csobod, É., de Oliveira Fernandes, E., Annesi-Maesano, I. (2020). Indoor air pollution, physical and comfort parameters related to schoolchildren’s health: Data from the European SINPHONIE study. Science of the Total Environment, 739(17-28): 139870. https://doi.org/10.1016/j.scitotenv.2020.139870
[31] de Oliveira, P.M., Mesquita, L.C.C., Gkantonas, S., Giusti, A., Mastorakos, E. (2021). Evolution of spray and aerosol from respiratory releases: Theoretical estimates for insight on viral transmission. Proceedings of the Royal Society A: Mathematical, Physical and Engineering Sciences, 477(2245): 1-21. https://doi.org/10.1098/rspa.2020.0584
[32] ASHRAE. (2022). ANSI/ASHRAE standard 62.1-2022, ventilation and acceptable indoor air quality. https://www.ashrae.org/technical-resources/bookstore/standards-62-1-62-2.
[33] Rajkumar, S., Amirtham, L.R., Horrison, E. (2009). Thermal comfort assessment of a studio classroom in hot & humid climate conditions. ICUC9 - 9th International Conference on Urban Climate Jointly with 12th Symposium on the Urban Environment, 3: 2-7.
[34] Abdulla, H.J. (2020). Manifestations of Climate Change in Baghdad Area. Al-Mustansiriyah Journal of Science, 30(4): 39-42. https://doi.org/10.23851/mjs.v30i4.657