Masrur Alatas* | Etty Susilowati | Maria Theresia Sri Budiastuti | Totok Gunawan | Prabang Setyono | Sunarto
© 2022 IIETA. This article is published by IIETA and is licensed under the CC BY 4.0 license (http://creativecommons.org/licenses/by/4.0/).
OPEN ACCESS
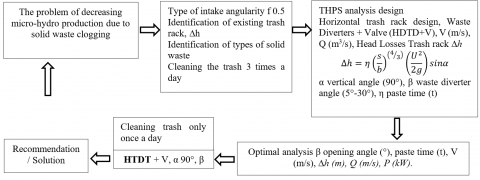
Clogging of Trash at the Micro Hydro-Power Plant can reduce the discharge, head, and micro-hydro production. Trash racks are currently less efficient in solving Trash clogging, so it needs appropriate technology innovation with the Horizontal Trash rack Diverter Trash (HTDT) which functions to get rid of or divert Trash. Diversion of Trash as well as increasing and stabilizing the discharge is important so that the innovation of adding a flow steering valve is needed (HTDT+V). The results of the research at β20° is the most optimal angle, the highest speed at the intake channel Cm4 V 0.7 m/s and HTDT + V β20° V 0.8 m/s occurs an increase in speed. Trash paste time β20° t 2.76 seconds, faster than the angle β0°, β5°, β30° Trash paste time t3.5 seconds. The HTDT+V installation increases the inflow velocity (V) in the intake channel by 60% and increases the discharge (Q) by 50%.
micro-hydro, trash rack, valve, trash diverters, discharge stability
Fulfilling electricity needs in Indonesia is still dominated by fossil energy, namely coal and natural gas [1]. The availability of fossil energy sources is increasingly limited and cannot be renewed, especially since this energy is not environmentally friendly. For this reason, the Indonesian government through the Directorate General of New, Renewable Energy, and Energy Conservation has committed to realizing environmentally friendly energy in the form of Geothermal power plants, Minihidro, Micro-hydro, Hydro, Solar, Biogas, Biomass, and Garbage [2]. The sustainability of micro-hydro as new and renewable energy (NRE) needs serious attention because in the field there are many micro-hydro that are not operational, damaged, and not maintained. Of the 10 micro-hydro in Yogyakarta, 8 are not operating. The problems found in the field were solid Trash clogging, decreased productivity, and management officers who were overwhelmed with Trash problems and decreased consumers due to unstable production because of Trash clogging. Therefore, a trash rack that pays attention to hydrological characters and Trash at micro-hydro intake is needed.
Trash racks are installed at the intake entrances [3] of hydropower plants to reduce Trash debris that can damage the turbine [4, 5]. The existence of a trash rack can reduce the velocity of flow and vortex [6], to reduce vibration and friction caused by flow. This is because speed is a function of friction, when the flow rate decreases, the friction will also decrease [7]. In addition to fulfilling the main objective of reducing solid Trash debris, the trash rack installation also plays a role in protecting the aquatic ecosystem because it is friendly to fish.
Research on the effect of the trash rack on fish migration has been widely carried out and not all types of fish can pass through the trash rack well [8], but other research states that the spatial distribution of fish in front of the trash rack is very heterogeneous [9]. Fish-friendly trash racks require proper design, namely the shape of the bars, the space between the bars, and the angle of inclination [10], so that fish can migrate without accidents. When building a hydropower plant, it is important to calculate the head loss on the trash rack [11]. Flow changes can cause head loss, high head loss causes the potential for energy production to be lower [12]. Research on head loss has been done a lot, Lucin et al. [8] calculated head loss on trash racks with different bar shapes using numerical simulations. Clogging of trash racks can cause uneven flow velocity, this can affect tool performance [13] and cause a reduction in turbine efficiency [8]. Cleaning garbage manually by human labor is not efficient [14], because it requires cost, and security is not guaranteed. The existence of a trash rack in the channel can cause head loss and reduce system efficiency, due to the influence of the barrier rods and the shape of the trash rack [15]. For this reason, it is necessary to design a trash rack with the effect of as little head loss as possible, so that it can function for micro-hydro sustainability from clogging garbage, as well as for the stability of energy production.
The existing trash rack that has been installed has not been optimal in filtering Trash (Table 1), so it is necessary to develop a better Trash filter technology innovation. Planning trash racks according to Kirschmer (1926) uses the following Eq. (1) [16].
$\Delta h=\eta\left(\frac{s}{b}\right)^{(4 / 3)}\left(\frac{U^2}{2 g}\right) \sin \alpha$ (1)
where, s is the thickness of the bars (m), b is the spacing between the bars (m), U is the velocity of the discharge flow (m/s), α is the angle of the trash rack to the ground floor horizontal plane (º), η is the shape factor or Cn. The value of head loss coefficient is shown in Figure 1. The calculation of head losses Eq. (1) [16]. Energy loss at the trash rack is affected by distance, shape, velocity, and angle of flow. The head loss is a function of the blockage ratio, the flow angle and velocity, and the shape of the rod. The results of the study helped trash rack designers to assess the hydraulic implications of increasing the clogging ratio of Trash and changing the shape of the trash rack trunks [16]. The head loss coefficient is a function of the clogging ratio, stem shape, and shelf-slope [10]. The angle effect is a function of the blockage ratio, stem shape, and possibly stem depth [10].
Figure 2 describes an illustration of a field test with a side tap intake perpendicular to the flow direction, with an angle of 90° trashrack and with round bars with a Cn coefficient of 1.79.
Based on the identification of the Kalibawang irrigation system (open channel), it is estimated potential micro-hydro development on channel irrigation that up to 1418 kW [17]. The study area topography on irrigation Kalibawang and identify the stream gradient potential or height difference (H). The results show through GE and GIS, obtained 23 potential points, 7 of which are high potential, measurements with Unmanned Aerial Vehicle has been found the cascade micro-hydro potential and detailed with Total Station, produce Head accurate (H) 12 m and FDC probability 75% discharge (Q) 5.5 m3/s, power (P) 550 [18]. This great potential will not be developed properly if the problem of Trash in the irrigation canal continues to disturb and hinder the flow of discharge into the micro-hydro intake, resulting in lowering the production of micro-hydro energy. As a result, this research is critical in order to provide a technical solution for preventing clogged garbage on the trash rack in the micro-hydro intake channel. As an outcome, future micro-hydro development could benefit greatly from stakeholders collaboration.
Table 1. Criteria for micro-hydro turbine clogging trash
|
No |
Solid Trash criteria |
Types of Solid Trash |
Information |
|
1. |
Non-organic |
Plastic trash such as plastic bottles, plastic cups, diapers, used cloth, plastic instant noodles, wrappers |
The turbine does not work because the discharge decreases Result: micro-hydro is off |
|
2. |
Organic |
Snakes, monitor lizards, carcasses of chickens, leaves |
The turbine is interrupted and does not work because the discharge decreases Result: micro-hydro is off |
Figure 1. Head loss coefficient in trash rack (drawn based on [3, 19])
Figure 2. Modification of the Horizontal Trash rack Diverter Trash (HTDT) and head loss coefficient in trash rack (drawn based on [3, 19])
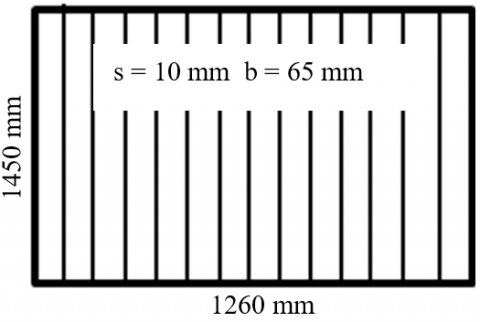
3.1 Existing intake and vertical trash rack (TVE)
Existing intake mouth (see Figure 3), with wet section, 1.45 m deep and 1.26 m wide. The thickness of the bars (s) 10 mm and the spacing between bars (b) 65 mm.
3.2 Carrier channel
The discharge carrying channel from the intake to the powerhouse with a wet section 1.2 m wide and 1 m deep.
3.3 Existing intake analysis of losses
Area A=bh (2)
Wetted Perimeter P=b+2h (3)
Hydraulic Radius $R=\frac{b h}{(b+2 h)}$ (4)
Velocity $V=\frac{1}{n} x R^{\frac{2}{3}} \times S^{\frac{1}{2}}$ (5)
Eqns. (2)-(5) to calculate the flow velocity in the channel based on the hydraulic radius. where, b is the width (m), h is the depth (m), A is the cross-sectional area (m2), P is the wetted perimeter (m), R is the hydraulic radius (m).
Figure 3. Scheme of existing vertical trash rack
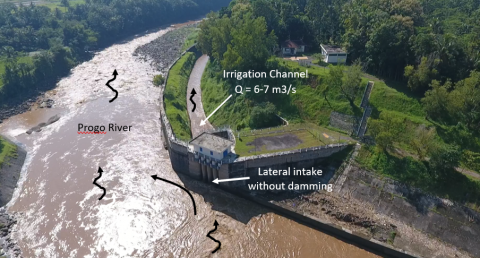
Figure 4. Lateral intake without damming (Aerial photo of DJI Phantom 4 UAV)
Irrigation channel intake is sourced from the Progo River with lateral intake without damming, this concept is an irrigation system with environmentally friendly intakes (see Figure 4). Water discharge designed at 7 m3/s for irrigation covering an area of 6,337 ha [18]. The intake system that is less than optimal causes a lot of trash to be flow and carried into the irrigation canal system (trash transport), and lack of awareness of trash management has an impact on decrease in electricity production, trash pollution on farmers rice fields (microplastic issue). So it is necessary to have a trash rack system that can handle trash properly, divert waste from entering the irrigation system and the micro-hydro system.
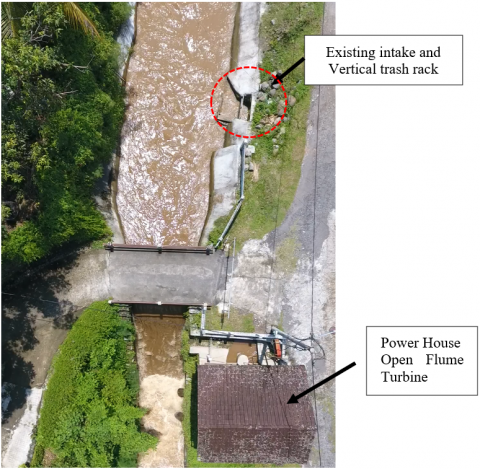
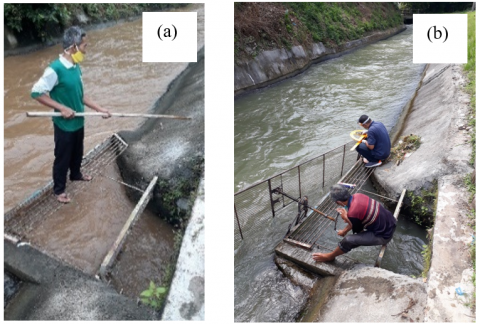
Figure 5 is the condition and situation of micro-hydro intake in Kedungrong Village, Yogyakarta Special Region, Indonesia. Identify intake Lateral Intake without damming and identify locations microhidro lateral intake using UAV [18]. The location is in a rural area with electricity consumers as many as 50 family houses with an average power production is 30 kW. This location often experiences solid Trash clogging problems in the trash rack and micro-hydro turbines. A large amount of solid Trash in the irrigation water source causes the micro-hydro to not work optimally. On average, officers clean 3 times a day and night. Night conditions, the safety of staff, and micro-hydro productivity need to be prioritized in sustainable micro-hydro management. The problem of Trash in irrigation canals greatly disrupts micro-hydro operations, some Trash often interferes with the rotation of the micro-hydro turbine in Kedungrong, and organic and non-organic Trash is often found (Table 1). Making a trash rack needs to be done to reduce solid Trash clogging in the irrigation canals.
Figure 5. Research location on existing lateral intake and trash rack (Aerial photo of DJI Phantom 4 UAV)
Figure 6. (a) Solid trash cloging at the vertical trashrack (b). Solid trash at the intake mouth, solid trash at the watergate before the turbine basin, (c) Weighing the intake clog and turbine trash (1-30 June 2020)
The vertical trash rack (the illustration on Figure 6a makes it easier for trash to stick and clog on the vertical bar and close the discharge flow. Clogging of solid Trash causes a decrease in micro-hydro production and even turns off, and cleaning workers have to do the cleaning 3 times a day even at night. To deal with solid Trash on trash racks, maintain discharge stability and reduce risks and improve the safety of cleaning officers, it is very necessary to innovate simple and efficient technology.
3.4 Horizontal Trash rack Diverter Trash (HTDT)
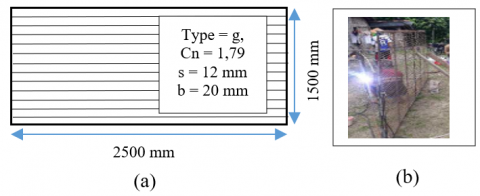
The trash rack model is rectangular with a length of 2.5 m and a height of 1.5 m (Figure 7), made with 6 mm diameter round iron, with a spacing of 2 cm, Trash diversion angle (β=5°, 10°, 15°, 20°, 25°, 30°), the change in angle by using a screw rod that is attached to the trash rack system. In this study, the fixed angle is α 90°. The bar shape is round (type g), so the hydrodynamics is low. The bar with type g has a coefficient value (Cn) of 1.79.
Figure 7. (a). Horizontal Trash rack Diverter Trash (HTDT) Design, (b). The process of making HTDT using electric welding from an existing micro-hydro
The test was carried out to determine the characteristics of the trash rack diversion angle on the efficiency in diverting Trash to the trash rack intake. Flow velocity testing is carried out at 4 measurement points. The method of measuring the efficiency of Trash diverters used balls and camera observations. The method of measuring flow velocity was carried out at 4 observation points of the trash rack opening angle (β). The research method is presented in Figure 8.
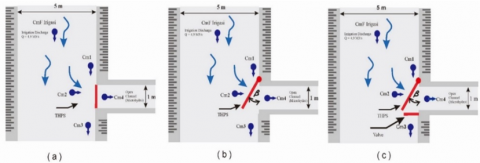
The installation of Horizontal Trash rack Diverter Trash (HTDT) in this study was carried out directly in the field in the existing irrigation conditions with irrigation discharge when measuring 4.9 m3/s. The wet dimensions of the irrigation canal are trapezoidal, 5 m wide and 1.5 m high. The wet section of the square intake is 1 m wide and 1 m wide at the outer intake mouth and 1.5 m wide by 1 m high at the carrier (Figure 9).
Figure 8. The research flow of horizontal trash rack trash diverters
Figure 9. (a) Trash rack Vertikal Existing (TV-E), (b) Horizontal Trash rack Diverter Trash (HTDT), (c) Horizontal Trash rack Diverter Trash + Valve Transh rack (HTDT+V), (d) 3D illustration of HTDT + V test at the points Cm1, Cm2, Cm3 and Cm4
Figure 10. (a) Existing vertical trash rack (TV-E), (b) Horizontal Trash rack Diverter Trash (HTDT)
Figure 10 is the existing condition of the trash rack, and the manufacture of Horizontal Trash rack Diverter Trash (HTDT). Measurement of flow velocity with Global Water Flow Probe FP111 Current meter, angle adjustment with angle ruler, ruler and water pass, and camera recorder. Measurement of Trash paste time test used a ball diameter Ø 40 mm.
Based on the results of the analysis (Table 2), the replacement of TV-E Rectangular to HTDT with a round shape gave a smaller head loss. The advantage of HTDT is that the Trash diverters angle (β) can be adjusted. This HTDT research seeks to divert or keep Trash away from the Micro-hydro Intake, but still, maintain the discharge of the existing micro-hydro plan remains stable.
Based on Table 2, the shape of the bar in the existing condition is rectangular, with a shape factor coefficient of 2.42, while the shape of the bar in HTDT is round, with a shape factor coefficient of 1.79. With the same thickness and spacing between bars, the resulting flow rates are different, namely 0.5 m/s on TV-E, and 0.7 m/s on HTDT. This results in a greater head loss value on TV-E than on HTDT. The minor head loss will result in a collision between the liquid particles and increased friction due to turbulence.
Table 2. Comparison of head loss replacement of TV-E and HTDT
|
Description |
Symbol |
Unit |
TV-E |
HTDT |
|
Bar shape (Type) |
|
|
Rectangular |
Round |
|
Shape Factor |
η |
|
2.42 |
1.79 |
|
The thickness of the bars |
s |
m |
0.01 |
0.01 |
|
The spacing between the bars |
b |
m |
0.02 |
0.02 |
|
The velocity of the discharge flow |
U |
m/s |
0.5 |
0.7 |
|
Head Loss |
∆h |
m |
0.076 |
0.056 |
|
Head Gross |
∆H |
m |
4.99 |
4.99 |
|
Head Nett = Head Gross – head loss trash rack |
∆H* |
m |
4.91 |
4.93 |
The β setting affects the flow rate at the intake, the following is a graph of the change in flow velocity (Figure 11).
Figure 11. The effect of angle on velocity
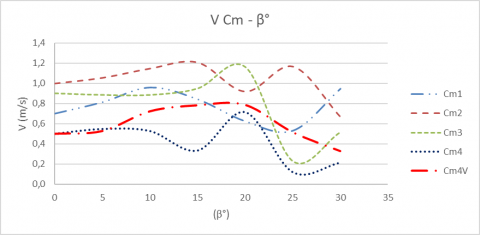
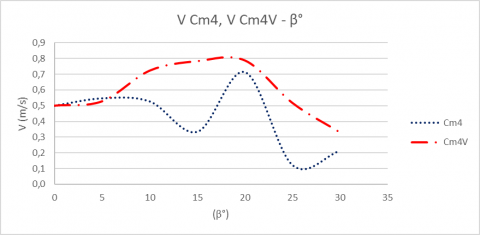
Based on the graph in Figure 11, it is found that at the locations of Cm3 and Cm4 (Intake Channels), the angle β 20° is the maximum average velocity Cm3=1.2 m/s and Cm4 (Intake Channel)=0.7 m/s. This explains that at an angle of 20°, a lot of water is Trashd and does not enter the intake so it is necessary to add a water guide valve with an angle of β 20° Cm4V (Intake Channel)+Valve=0.8 m/s.
Figure 12. The effect of angle on velocity
Comparison with β0° at Cm4=0.5 m/s, then at β 20° Cm4 openings it increases to 0.7 m/s and the addition of Valve, then Cm4 increases to 0.8 m/s (see Figure 12). This shows that the addition of a valve can increase the discharge at β10° - β 30° openings, with a peak increase in flow velocity at β 20°. Based on Table 3, the HTDT β20° + Valve contributes to the increase in flow velocity, discharge and theoretically can increase the Generated Power (P), or it can provide discharge stability in micro-hydropower plants. It is showed discharge (Q) and generated power (P), that discharge Q at β20° + Valve > Q β20° > Q β0°, generated power P at β20° + Valve > Q β20° > Q β0°, so the addition of Valve at β20° can optimize the performance of micro-hydro.
Table 3. Calculation of generated power with HTDT scenario β 0°, 20°, and 20° + Valve
|
Description |
Symbol |
Unit |
β 0° |
β 20° |
β 20°+Valve |
|
Flow velocity |
U |
m/s |
0.5 |
0.7 |
0.8 |
|
Wet section of the channel |
A |
m2 |
1.2 |
1.2 |
1.2 |
|
Discharge of the intake channel |
Q |
m3/s |
0.6 |
0.84 |
0.96 |
|
Head |
H nett |
M |
4.93 |
4.93 |
4.93 |
|
Power generated P=ρ*g*H*Q*η (η=85%) |
P |
kW |
41 |
57.5 |
65.7 |
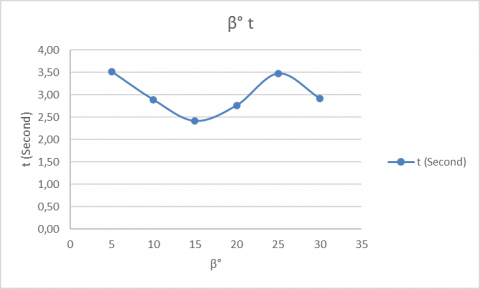
Based on Figure 13, the lowest paste time measurement results are at an angle of 15° and 20°. The results VCm4 of measuring the relationship between the opening of the HTDT angle and the residence time of trash on the trash rack showed that at the angle of β15° the fastest residence time was 2.4 seconds, at the angle β20° was 2.76 seconds. The longest residence time was at the angle β5° and β30°, which was 3.5 seconds.
Figure 13. Graph of the relationship between the opening angle of the trash rack angle to the residence time of the test ball
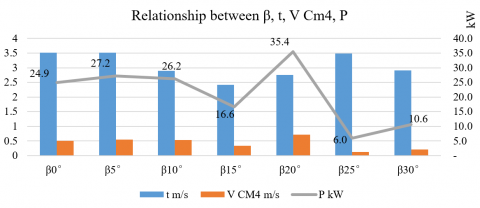
HTDT testing process, angle relationship with paste time (see Figure 14). Based on Figure 15, the highest flow speed at Cm4 measurement point with HTDT opening at angle 20° is 0.7133 m/s. Highest power generated (P) at 20° is 35.4 kW. The angle of 20° is the best angle to produce the highest flow velocity (V) in the carrier channel after intake, increasing the highest flow rate (Q) and producing the highest generated power (P) of 35.4 kW.
Figure 14. (a) Test ball–time of the test ball, (b) Measurement of flow velocity with FP111 current meter
Figure 15. Graph of the relationship between β, t, VCm4, and P
Table 4. The relationship between β, t, VCm4, and P
|
β |
h |
b |
h/b |
U |
A |
R |
t |
Q |
Hgross |
s |
b |
ηCn |
α (°) |
VCM4 |
ΔH |
Hn |
ρ |
g |
ηt |
P |
|
° |
m |
m |
m |
m2 |
m |
m/s |
m3/s |
m |
Sec |
m/s |
m |
m |
kW |
|||||||
|
β0° |
1 |
1.2 |
0.8 |
3.2 |
1.2 |
0.375 |
3.51 |
0.6 |
4.99 |
0.12 |
0.2 |
1.79 |
90 |
0.5 |
0.0103 |
4.98 |
1000 |
9.8 |
0.85 |
24.9 |
|
β5° |
1 |
1.2 |
0.8 |
3.2 |
1.2 |
0.375 |
3.52 |
0.7 |
4.99 |
0.12 |
0.2 |
1.79 |
90 |
0.5467 |
0.0123 |
4.978 |
1000 |
9.8 |
0.85 |
27.2 |
|
β10° |
1 |
1.2 |
0.8 |
3.2 |
1.2 |
0.375 |
2.89 |
0.6 |
4.99 |
0.12 |
0.2 |
1.79 |
90 |
0.5267 |
0.0115 |
4.979 |
1000 |
9.8 |
0.85 |
26.2 |
|
β15° |
1 |
1.2 |
0.8 |
3.2 |
1.2 |
0.375 |
2.42 |
0.4 |
4.99 |
0.12 |
0.2 |
1.79 |
90 |
0.3333 |
0.0046 |
4.985 |
1000 |
9.8 |
0.85 |
16.6 |
|
β20° |
1 |
1.2 |
0.8 |
3.2 |
1.2 |
0.375 |
2.76 |
0.9 |
4.99 |
0.12 |
0.2 |
1.79 |
90 |
0.7133 |
0.021 |
4.969 |
1000 |
9.8 |
0.85 |
35.4 |
|
β25° |
1 |
1.2 |
0.8 |
3.2 |
1.2 |
0.375 |
3.48 |
0.1 |
4.99 |
0.12 |
0.2 |
1.79 |
90 |
0.12 |
0.0006 |
4.989 |
1000 |
9.8 |
0.85 |
6 |
|
β30° |
1 |
1.2 |
0.8 |
3.2 |
1.2 |
0.375 |
2.91 |
0.3 |
4.99 |
0.12 |
0.2 |
1.79 |
90 |
0.2133 |
0.0019 |
4.988 |
1000 |
9.8 |
0.85 |
10.6 |
8.1 Effect of trash rack diverters trash (HTDT)
The results of the trash observation after the installation of the solid Trash diverters showed a decrease in the amount of Trash that entered the observation point and picked up the stuck solid Trash (S). Before installing the Trash rack at point S, the average weight of retained Garbage was 0.44 kg, while after the trash rack was installed, an average of 0.13 kg was stuck. Based on the results of the speed test at the location of test point 4 (Cm4), the valve could increase the average speed by 0.1 m/s than without the valve, and optimally opened the Trash rack Trash Diverters at an angle of β20° with an increase in discharge of 0.36 m3/s or an increase of 60%. Based on Table 4, field testing at point Cm4 showed that HTDT β20° + V was the highest flow velocity value of 0.7133 m/s with the highest Q of 0.9 m3/s, and the largest generated power value was P 35.4 kW.
Testing the HTDT s 0.01 m and b 0.02 m is an effort to find a solution to the problem of solid Trash that always clogs up the trash rack at the micro-hydro intake, so HTDT is used to divert Trash or keep Trash away from entering the micro-hydro turbine. HTDT angle β20° was the angle with the highest velocity value at the intake channel Cm4 with V 0.7 m/s and the addition of the flow steering valve made HTDT + V β20° V 0.8 m/s an increase in speed occurred. This increase was very significant when compared to β0°, which was 0.5 m/s. The Trash paste time test showed that at the angle of β15° t 2.4 seconds, β20° t 2.76 seconds, was faster than the angle β0°, β5°, β30° Trash paste time t 3.5 seconds. This test provided information and solutions to micro-hydro managers and administrators to make design changes by paying attention to the β trash rack angle, especially at the intake of the irrigation channel perpendicular to the direction of the irrigation flow where there was a lot of Trash that interfered with micro-hydro operations. The implication is that it will be easier to manage and maintain discharge stability and micro-hydro production. The installation of HTDT + V could increase the speed of inlet flow in the intake channel by 60% and increased the discharge by 50% and reduced the risk of garbage cleaners because from 3 times a day to 1 time cleaning every day and reduced the risk of work accidents for cleaning workers, especially micro-hydro in the big and flowing channel.
Testing needs to be done with various types of test Trash, including cloth Trash, plastic bottle Trash, and grass and leaf Trash. HTDT testing with two variations of the angle α and β is likely to provide added value. It is also necessary to test the paste time (t) with sinking Trash. To reduce the risk of garbage cleaning officers, in the future it is necessary to make a mechanical trash rack cleaner (HTDT+V+M).
This research supported by Indonesian Micro-hydro Integrated Community-Yogyakarta, Institut Teknologi Yogyakarta, Universitas Sebelas Maret, Universitas Gadjah Mada, Universitas Budi Luhur, Jasa Tirta Energi (JTE) subsidiary of Indonesian State-owned Enterprises, Indonesian Research and Training Institut.
|
Cm |
Current meter |
|
H, ∆H |
local Nusselt number along the heat source |
|
HTDT |
Horizontal Trash rack Diverter Trash |
|
HTDT+Valve |
Horizontal Trash rack Diverter Trash (HTDT) + flow guide valve |
|
t |
Test ball paste time (assuming floating litter) |
|
TV-E |
Trash rack Vertical Existing |
|
V |
Flow velocity (m/s, ms-1) |
|
Greek symbols |
|
|
$\alpha$ |
Vertical angle (°) |
|
$\beta$ |
Horizontal angle (°) |
[1] IESR. (2019). Decentralization of Electricity in Indonesia: A Case Study of Community-Based Renewable Energy Power Plants in 2 Regions in Indonesia (2nd ed.). Institute for Essential Services Reform. http://iesr.or.id/v2/publikasi_file/IESR-SP-E-Desentralisasi-Ketenagalistrikan-di-Indonesia.pdf. [Ebook in Bahasa].
[2] Ditjen EBTKE. (2020). Strategic Plan of the Directorate General of New, Renewable Energy and Energy Conservation 2020-2024. Directorate General of New, Renewable Energy and Energy Conservation. https://drive.esdm.go.id/wl/?id=x4IOD5k95HdcBuqUDHulr1n13sZ2lKBk. [Ebook in Bahasa].
[3] Penche, C. (1998). A Handbook Prepared Under Contract for the Commission of the European Communities, Directorate-General for Energy by European Small Hydropower Association (ESHA) (2nd ed.). Directorate General for Energy, DG XVII. https://energypedia.info/images/4/43/Laymans_book_-_how_to_develop_a_small_hydro_site_1-127.pdf.
[4] Katopodis, C., Lemke, D., Ghamry, H. (2011). Ecohydraulic studies on bar racks (Trashracks) (Issue December 2011). https://www.researchgate.net/publication/266911977_Ecohydraulic_studies_on_bar_racks_trashracks.
[5] Jeethulakshmi, G., Sumam, K.S., Sajikumar, N. (2017). Simulation of head loss in Trashrack – a comparative. Global Conference and Exhibition - Flow Engineering and Technology - Flotekg. https://www.flotekg.com/pdf/papers/fg1732.pdf.
[6] Sarkardeh, H., Zarrati, A.R., Roshan, R. (2010). Effect of intake head wall and trash rack on vortices. Journal of Hydraulic Research, 48(1): 108-112. https://doi.org/10.1080/00221680903565952
[7] Otuagoma, S.O., Ogujor, E.A., Kuale, P.A. (2016). Determination of head for small hydropower development: A case study of river ethiope at umutu. Nigerian Journal of Technology (NIJOTECH), 35(1): 190-195. https://doi.org/dx.doi.org/10.4314/njt.v35i1.26
[8] Lucin, I., Carija, Z., Grbcic, L., Kranjcevic, L. (2020). Assessment of head loss coefficients for water turbine intake trash-racks by numerical modeling. Journal of Advanced Reserach, 21: 109-119. https://doi.org/10.1016/j.jare.2019.10.010
[9] Schmidt, M.B., Tuhtan, J.A., Schletterer, M. (2018). Hydroacoustic and pressure turbulence analysis for the assessment of fish presence and behavior upstream of a vertical trash rack at a run-of-river hydropower plant. Applied Sciences, 8(10): 1723. https://doi.org/10.3390/app8101723
[10] Raynal, S., Courret, D., Chatellier, L., Larinier, M., David, L. (2013). An experimental study on fish-friendly trashracks - Part 1. Inclined Trashracks. Journal of Hydraulic Research, 51: 56-66. https://doi.org/10.1080/00221686.2012.753646
[11] Josiah, N.R., Tissera, H.P.S., Pathirana, K.P.P. (2016). An experimental investigation of head loss through trash racks in conveyance systems. Engineer, XLIX(1): 1-8. https://doi.org/10.4038/engineer.v49i1.6913
[12] Holmeset, F. (2013). Debris handling at small hydro power intakes. Norwegian University of Science and Technology. http://hdl.handle.net/11250/232554
[13] Angulo, M., Liscia, S. (2016). CFD optimization of low head turbines intake using fisher-franke guidelines. American Journal of Hydropower, Water and Environment Systems, 1(August): 29-33. https://doi.org/10.13140/RG.2.1.2013.0641
[14] Nøvik, H., Lia, L., Wigestrand, M. (2014). Horizontal trash rack – a new intake concept for efficient backflushing. Journal of Applied Water Engineering and Research, 2(2): 81-90. https://doi.org/10.1080/23249676.2014.953607
[15] Walczak, N., Walczak, Z., Hammerling, M., Spychala, M., Niec, J. (2016). Head losses in small hydropower plant trash racks (SHP). Acta Scientiarum Polonorum Formatio Circumiectus, 15(4): 369-382. http://www.formatiocircumiectus.actapol.net/pub/15_4_369.pdf.
[16] Clark, S.P., Tsikata, J.M., Haresign, M. (2010). Experimental study of energy loss through submerged trashracks. Journal of Hydraulic Research, 48(1): 113-118. https://doi.org/10.1080/00221680903566026
[17] Alatas, M., Budiastuti, M.T.S., Gunawan, T., Setyono, P., Burlakovs, J., Yandri, E. (2020). The identification of micro-hydro power plants potential in irrigation areas based on unmanned air vehicle (UAV) image processing. In E3S Web of Conferences, 190: 00024. https://doi.org/10.1051/e3sconf/202019000024
[18] Alatas, M., Budiastuti, M.T.S., Gunawan, T., Setyono, P. (2021). Stage of potential identification irrigation channel topography analysis for micro-hydro power in the Kalibawang Irrigation Primary Channel, Yogyakarta, Indonesia. International Journal of Sustainable Development and Planning, 16(5): 953-964. https://doi.org/10.18280/ijsdp.160516
[19] Basnet, C.B., Panthi, K.K. (2018). Roughness evaluation in shotcrete-lined water tunnels with invert concrete based on cases from Nepal. Journal of Rock Mechanics and Geotechnical Engineering, 10: 42-59. https://doi.org/10.1016/j.jrmge.2017.07.006