Wahyu Setyaningsih* | Hadiyanto Hadiyanto | Thomas Triadi Putranto
© 2022 IIETA. This article is published by IIETA and is licensed under the CC BY 4.0 license (http://creativecommons.org/licenses/by/4.0/).
OPEN ACCESS
This study aims to analyze the condition and awareness of community plastic waste management in the Garang watershed to increase institutional capacity in reducing plastic pollution. This study was a sequential exploratory mixed-method research involving 175 respondents from Garang rivers community. Data was collected using observation, open-questionnaire and in-depth interview about community understanding and waste management organization. The respondent answer then converted into number and analyzed statistically using Kruskal-Wallis test. The institutional aspect was identified by interview and scored for AHP analysis. This research predicts more than 66 ton of plastic waste was produced by the communities around Garang watershed that managed, inappropriately. Only less than 40% of the Garang watershed community sells their plastic waste to the waste bank, and the rest were burned or abandoned in vacant land or rivers. Regarding to the waste-management organization aspect, the financial support and community participation aspect should be improved in upstream wather-shed area to enhance waste management communally. In contrast, internal institutions, community participation, and operational institutions are the main aspects that might be enhanced in the downstream areas. A future research needs to be conducted to identify community requirements as a foundation for establishing an appropriate waste management institution.
domestic waste, microplastic, sub-watershed, waste-bank
The Garang River is the main major river that flows from the Ungaran mountains and passes through two administrative areas. The Garang River provides the primary raw water source with a total installed capacity of 1,130 L/sec and an average discharge of 915.79 L/sec [1]. Garang watershed is formed from four sub-watersheds that span an area of 21,277.36 Ha, which includes the Kreo, Kripik, Garang Hulu, and Garang Hilir watersheds [2]. However, the watershed area has decreased due to the increase in population in Semarang City.
Semarang City is an urban area with a population growth rate of 3.05% in 2015-2017 and reached 1.79 million people in 2019 [Department of Population and Civil Registration of Semarang City [3]. Increased population causes land clearing in the Garang watershed for residential and agricultural areas [4]. Over ten years (2005-2015), at least there has been a reduction in the Garang watershed area by up to 22.00% [5]. At least 21.28% of settlements in Semarang City are located on the riverbanks [Statistic Board of Semarang City [6]. The increase in population and residential area in the Garang watershed has implications for increasing anthropogenic activity in waste production, especially plastic. Furthermore, approximately 67% of Semarang City's waste comes from settlements or households [6] and 16% of them are plastic waste. The Garang river watershed area, which has a water catchment area on a densely populated highland, is a source of waste, especially plastic.
The government's waste management in Semarang City only covers about 80% of the total 1229 tons/day of waste production [7]. In addition, handling only includes collection from the source and transportation to the Jatibarang landfill. In other words, about 20% of the total waste generated cannot be handled properly [8]. The systems of community waste management both independently and communally that have not been maximized can result in the release of waste, especially plastic, into the Garang watershed. The Statistical Board of Semarang City [9] survey shows that 0.56% of the population frequently throws their garbage in rivers and waterways.
Plastic waste is difficult to degrade, so it accumulates in the Garang watershed both in the soil and in the water. Plastic waste stored in the soil or in waters is easy to undergo physical changes as a result of physical environmental factors such as temperature, mechanical friction or due to exposure to UV light which results in the formation of microplastics. In other words, the existence of residential areas located in high topography and around the watershed area will be one of the sources of microplastics that enter through the run-off.
Increasing community and neighborhood capacity in waste management institutions needs to be carried out holistically and systematically. To produce permanent and sustainable solutions, it is necessary to identify the main problems, especially related to the understanding and institutionalization of plastic waste management. Therefore, this study aims to analyze the condition and awareness of community plastic waste management in the Garang watershed to increase institutional capacity to reduce plastic pollution.
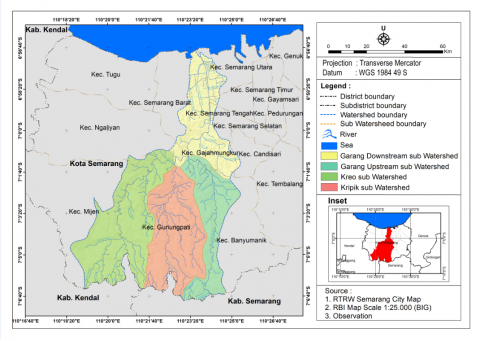
The research was conducted in Semarang City, Central Java, Indonesia, in the Garang watershed area. The research locus covers four areas, namely Kreo, Kripik, Garang-Hulu, and Garang-Hilir watershed with a survey area of 11,451.05 Ha of the total Garang watershed covering an area of 21,277.36 Ha (Figure 1). Geographically, Garang watershed is located at coordinates 110° 18' 28" - 110° 25' 59" East Longitude and between 6° 56' 46'' - 7° 11' 47'' South Latitude.
The total population in this study was 193,703 households, which came from eight sub-districts selected based on the filed observation and secondary data interpretation. Secondary data was collected using google map analysis, regional map and population data of the Semarang City. Respondents are community representatives of families, which living along the river in the Garang watershed, which were selected using random cluster sampling by considering the number of people who live and have activities in the research location. The number of respondents involved [n] was determined using the Slovin formula (Formula 1) with a margin of error (e) of 15% of the total households in each watershed (N).
$n=\frac{N}{\left[1+\left(N \times e^{2}\right)\right]}$ (1)
The target respondents were 44-45 respondents based on the sample calculation for each research area. The amount is then adjusted to the field conditions and the actual number of respondents is obtained (Table 1).
Figure 1. The research area of four Garang sub-watershed. Red-pentagrams shows the sampling points
Table 1. Number of research respondents based on households in sub-watershed areas
|
Garang sub-watershed |
Total household a |
Respondent |
|
|
Targeted |
Actual b |
||
|
Kreo |
37,181 |
44.39 |
50.00 |
|
Kripik |
36,923 |
44.39 |
50.00 |
|
Garang Hulu |
93,558 |
44.42 |
30.00 |
|
Garang Hilir |
26,039 |
44.37 |
45.00 |
|
Total |
193,701 |
178.00 |
175.00 |
Note: a] data source Central Statistics Agency of Semarang City in 2020 with adjustment. b] A total of three respondents were excluded from the analysis due to incomplete information filling out the questionnaire.
Table 2. The total respondents in the Garang watershed are based on demographic data
|
Kategori |
DAS Kripik |
DAS Kreo |
DAS Garang Hulu |
DAS Garang Hilir |
||||||||||||
|
Male |
Female |
Male |
Female |
Male |
Female |
Male |
Female |
|||||||||
|
N |
% |
N |
% |
N |
% |
N |
% |
N |
% |
N |
% |
N |
% |
N |
% |
|
|
Total Respondent |
31 |
62.00 |
19 |
38.00 |
38 |
76.00 |
12 |
24.00 |
21 |
70.00 |
9 |
30.00 |
22 |
62.86 |
13 |
27.14 |
|
Ages (years) |
|
|
|
|
|
|
|
|
|
|
|
|
|
|
||
|
<45 |
13 |
26.00 |
10 |
20.00 |
21 |
42.00 |
4 |
8.00 |
5 |
16.67 |
5 |
16.67 |
9 |
25.71 |
8 |
22.86 |
|
45-55 |
11 |
22.00 |
5 |
10.00 |
16 |
32.00 |
8 |
16.00 |
11 |
36.67 |
3 |
10.00 |
11 |
31.43 |
2 |
5.71 |
|
>55 |
7 |
14.00 |
4 |
8.00 |
1 |
2.00 |
0 |
0.00 |
5 |
16.67 |
1 |
3.33 |
2 |
5.71 |
3 |
8.57 |
|
Job |
|
|
|
|
|
|
|
|
|
|
|
|
|
|
||
|
Public Service Officer |
3 |
6.00 |
2 |
4.00 |
3 |
6.00 |
1 |
2.00 |
2 |
6.67 |
1 |
3.33 |
2 |
5.71 |
- |
- |
|
Unemployed |
1 |
2.00 |
9 |
18.00 |
- |
- |
8 |
16.00 |
- |
- |
6 |
20.00 |
1 |
2.86 |
9 |
25.71 |
|
Outsourcing |
11 |
22.00 |
3 |
6.00 |
13 |
26.00 |
- |
- |
3 |
10.00 |
- |
- |
2 |
5.71 |
- |
- |
|
Permanent Worker |
12 |
24.00 |
3 |
6.00 |
13 |
26.00 |
- |
- |
11 |
36.67 |
1 |
3.33 |
14 |
40.00 |
- |
- |
|
entrepreneur |
4 |
8.00 |
2 |
4.00 |
9 |
18.00 |
3 |
6.00 |
5 |
16.67 |
1 |
3.33 |
3 |
8.57 |
4 |
11.43 |
|
Education |
||||||||||||||||
|
SD/SMP |
10 |
20.00 |
12 |
24.00 |
7 |
14.00 |
2 |
4.00 |
4 |
8.00 |
1 |
2.00 |
4 |
11.43 |
6 |
17.14 |
|
SMA |
12 |
24.00 |
3 |
6.00 |
24 |
48.00 |
7 |
14.00 |
11 |
22.00 |
6 |
12.00 |
15 |
42.86 |
7 |
20.00 |
|
D3/S1/S2 |
9 |
18.00 |
4 |
8.00 |
7 |
14.00 |
3 |
6.00 |
6 |
12.00 |
2 |
4.00 |
3 |
8.57 |
- |
- |
|
Income regional income wage (Rp) |
|
|
|
|
|
|
|
|
|
|
|
|
|
|
||
|
< 2.250.000 |
9 |
18.00 |
12 |
24.00 |
7 |
14.00 |
0 |
0.00 |
3 |
6.00 |
1 |
2.00 |
1 |
2.86 |
4 |
11.43 |
|
2.250.000 |
13 |
26.00 |
4 |
8.00 |
14 |
28.00 |
8 |
16.00 |
7 |
14.00 |
3 |
6.00 |
4 |
11.43 |
8 |
22.86 |
|
> 2.250.000 |
9 |
18.00 |
3 |
6.00 |
17 |
34.00 |
4 |
8.00 |
11 |
22.00 |
5 |
10.00 |
17 |
48.57 |
1 |
2.86 |
Men dominated the respondents involved as household representatives in this study. This is relevant because the majority of household heads are husbands or men. Furthermore, most respondents are high school graduates and work as permanent employees in private companies with an average salary above the regional income wage of Semarang City, around Rp 2.250.000 (157 USD - 158 USD) (Table 2).
This research was conducted using a sequential exploratory mixed-method design involving communities in four sub-watershed Garang areas. The hybrid research methods are intended to produce more comprehensive facts related to waste management aspects that need to be improved and is not limited to data collection mechanisms or instruments. In addition, it is also to justify the qualitative information using quantitative techniques so as to provide a statistically reliable illustration in making a decision of main problem solving.
2.1 Data collection
Research data on daily waste production and household waste management were obtained using a guided survey based on a questionnaire. Furthermore, data on communal waste management was carried out using questionnaires and interviews. The obtained data was tabulated coded, classified and reduced to avoid a bias. Those processes then continued with quantitative calculation using SPSS ver.23 to find out the differences of waste management implementation in the Garang sub-watershed community groups.
2.2 Analytical Hierarchy Process (AHP) for improving communal waste management
Based on data collection, five main aspects were found in determining the success of communal waste management: internal-institutional aspect, financial support, regulation, community participation, and operational procedures. The respondents then assessed the five aspects based on their urgency using the analytical hierarchy process (AHP) score [10, 11].
AHP is intended to determine priority aspects that must be improved which are decided by pair wise comparison. Through this comparison, the differences in priorities between aspects can be explained so as to produce decisions that are more consistent, accommodating, and factual. Furthermore, AHP is suitable for selecting problems based on priority order involving qualitative criteria that are difficult to quantify. In addition, AHP has simple logic, the calculation process is easy to understand, so that the best alternative chosen is the result of a recognized simple mathematical model calculation.
The results of the AHP analysis are expressed in the weighted value (%), which represents the importance of improving one aspect to another. In other words, the recommendations generated from the AHP indicate priority aspects that must be improved in terms of capacity and quality.
Rivers are the main pathway of the plastic waste to enter the ocean. It is estimated that around 1.15 to 2.41 million tons of plastic waste enter the oceans through rivers worldwide [12]. This phenomenon cannot be separated from anthropogenic factor that produced by residential areas around the watershed area. A previous study explains that the plastic waste productivity in line with the population growth that occupies water catchment areas [13], with no exception at the Garang watershed. The anthropogenic factors, especially household activities, contributes in the high plastic waste polution in the Garang river. Based on this study results, daily domestic waste product is estimated around 12% - 20%, including plastic waste, either in food packaging, package wrapping, or plastic bags. In total, community settlements in the four sub-watersheds of the Garang river potentially produce more than 66 tons of plastic waste, daily (Table 3).
Most of the total plastic waste is still not appropriately managed at the household scale. This is illustrated by the number of respondents who do not use the facility of waste bank and sort the waste, instead throw it to the environment. Less than 40% of the people in the Kripik, Kreo, and Garang Hulu sub-watershed sort and sell their garbage to the waste bank, which shows the low level of community participation in reducing plastic waste. However, community participation is relatively high, found in the Garang Hilir area, at least as many as more than 60% of respondents involve the waste bank in managing daily waste (Table 4).
Table 3. A prediction of daily total waste and plastic production in the Garang river district
|
Watershed |
Daily Waste [Kg/ household] |
Plastic Waste [Kg/ household] |
Total Plastic Waste [Kg/ watershed] |
|
Kripik |
1.88 |
0.23 |
8,418.44 |
|
Kreo |
1.82 |
0.37 |
13,905.69 |
|
Garang Hulu |
2.07 |
0.39 |
36,799.48 |
|
Garang Hilir |
1.66 |
0.29 |
7,588.51 |
|
Total |
7.43 |
1.28 |
66,712.12 |
Note: the source of the data is obtained from the results of observations and interviews of respondents
Table 4. Management of household waste by the community in the Garang river basin
|
Waste management |
Kripik |
Kreo |
Garang Hulu |
Garang Hilir |
||||
|
N |
% |
N |
% |
N |
% |
N |
% |
|
|
Burned |
17 |
34.00 |
13 |
26.00 |
- |
- |
1 |
2.86 |
|
Recycle |
- |
- |
- |
- |
- |
- |
- |
- |
|
Sold to the waste bank |
13 |
26.00 |
19 |
38.00 |
4 |
13.33 |
21 |
60.00 |
|
Sorted and then thrown in the trash |
5 |
10.00 |
17 |
34.00 |
5 |
16.66 |
22 |
62.86 |
|
Thrown in the trash |
38 |
76.00 |
18 |
36.00 |
25 |
83.33 |
13 |
37.14 |
|
Discarded in the garden/vacant land |
24 |
48.00 |
20 |
40.00 |
20 |
66.67 |
23 |
63.89 |
|
Dumped into the sewers |
32 |
64.00 |
28 |
56.00 |
21 |
70.00 |
32 |
88.89 |
The activity of handling the plastic waste properly, including sorting, recycling, reusing, or reducing, is still not reflected in the communities’ daily routine in the Garang watershed areas. This is supported by the low public awareness of waste that can pollute the environment (Figure 2). Mainly, the respondents realize that plastic waste is aesthetically disturbing and harmful for health. However, the actions to reduce the waste were only conducted around their homes, not the environment as a whole.
Most respondents admitted that they prefer to burn or dispose of their garbage in vacant land or water drainage rather than recycling it (Table 4). This behavior is triggered by the notion that burning garbage has eliminated plastic waste from their environment. Even though the open combustion process releases toxic chemicals such as dioxins and harmful hydrocarbons into the atmosphere [14]. In addition, poor plastic waste management can increase the entry of plastic waste into the river water.
Worse, plastic waste in the environment can undergo morphological changes due to physical factors such as temperature, ultraviolet, and mechanical forces, which are the source of microplastic pollution [15, 16]. Microplastic is a plastic particle measuring less than 5 mm, then its presence in the environment can inhibit water organism growth [17] and enter the food chain [18, 19]. Community understanding regarding the processing or recycling of waste into goods with higher economic value is also relatively low (Table 5).
The low awareness of residential waste management at the household level shows the low influence of waste management institutions at the neighborhood level in changing people's mindsets. In contrast, the existence of waste management institutions can educate the community to be more concerned about the quality of a zero-waste environment [20]. However, several actions can help increase the community's role in recycling waste, including integrating plastic-elimination activities with waste banks and municipal collections [21]. These activities can simplify the flow of waste distribution and speed up waste handling at the neighborhood level. A fast handling process reduces the accumulation of waste and encourages the community to be more active in handling communal waste.
Figure 2. The respondents with caring behavior in waste management (low-high)
Table 5. Waste management activities at household and neighborhood levels
|
Activity |
Achievement Score |
|||||||
|
Kripik |
Kreo |
Garang Hulu |
Garang Hilir |
|||||
|
Sc. |
Crit. |
Sc. |
Crit. |
Sc. |
Crit. |
Sc. |
Crit. |
|
|
Household-level |
|
|
|
|
|
|
|
|
|
Sorting organic waste [foodstuffs, litter] and inorganic [plastic, rubber, metal]. |
0.47 |
Low |
0.42 |
Low |
0.43 |
Low |
0.59 |
Low |
|
Provision of permanent trash cans in each house. |
0.69 |
Low |
0.60 |
Low |
0.62 |
Low |
0.69 |
Low |
|
Reducing family-scale waste production |
0.40 |
Low |
0.22 |
Low |
0.30 |
Low |
0.24 |
Low |
|
Utilizing organic waste into compost at the household level |
0.31 |
Low |
0.20 |
Low |
0.20 |
Low |
0.19 |
Low |
|
Composting within one month at the household level |
0.24 |
Low |
0.23 |
Low |
0.22 |
Low |
0.18 |
Low |
|
Recycling the waste to make profitable or applicable stuff [recycle] |
0.17 |
Low |
0.34 |
Low |
0.23 |
Low |
0.26 |
Low |
|
Using unused items, such as syrup bottles, shopping bags, etc. |
0.56 |
Low |
0.61 |
Low |
0.55 |
Low |
0.67 |
Low |
|
Waste recycling at the household level |
0.33 |
Low |
0.38 |
Low |
0.35 |
Low |
0.27 |
Low |
|
The amount of waste generated in one day |
0.78 |
High |
0.80 |
High |
0.73 |
High |
0.84 |
High |
|
The amount of plastic waste in one day |
0.96 |
High |
0.83 |
High |
0.82 |
High |
0.87 |
High |
|
Neighborhood level |
|
|
|
|
|
|
|
|
|
Waste management socialization activities, both internal and external to the community |
0.39 |
Low |
0.63 |
Low |
0.67 |
Low |
0.79 |
High |
|
Provision of temporary disposal sites, integrated waste disposal sites, or communal waste bins |
1.00 |
High |
0.82 |
High |
0.63 |
Low |
0.74 |
Low |
|
Provision of the waste bank at the level that is managed by the community |
0.35 |
Low |
0.48 |
Low |
0.38 |
Low |
0.51 |
Low |
|
Community involvement as waste bank management |
0.22 |
Low |
0.27 |
Low |
0.30 |
Low |
0.37 |
Low |
Table 6. Achievements in the implementation of communal waste management at the neigborhood level
|
Aspects |
Implementation Achievement in Waste Management |
F value |
p-value |
|||||||
|
Kripik |
Kreo |
Upstream Garang |
Downstream Garang |
|||||||
|
Score |
Cat. |
Score |
Cat. |
Score |
Cat. |
Score |
Cat. |
|||
|
Internal-Institutional |
60.87 ± 8.80 abd |
Low |
73.88 ± 5.12 b |
Low |
74.24 ± 1.07 ac |
Low |
51.52 ± 1.44 d |
Low |
5.841 |
0.002 |
|
Financial Support |
33.70 ± 8.33 a |
Low |
59.94 ± 4.44 b |
Low |
95.46 ± 2.44 c |
High |
98.49 ± 1.44 c |
High |
79.842 |
0.000 |
|
Regulation |
85.33 ± 3.07 a |
High |
83.23 ± 6.43 a |
High |
89.39 ± 3.21 a |
High |
90.91 ± 1.07 b |
High |
3.726 |
0.017 |
|
Community Participation |
61.18 ± 8.00 |
Low |
68.22 ± 9.37 |
Low |
63.64 ± 4.61 |
Low |
66.23 ± 6.40 |
Low |
0.564 |
0.641 |
|
Operational Procedure |
62.80 ± 6.16 a |
Low |
63.14 ± 5.75 a |
Low |
60.61 ± 5.34 a |
Low |
83.84 ± 6.13 b |
High |
7.506 |
0.000 |
Note: the alphabet superscript (a-e) representing significantly different achievement of each aspect among sub-watershed area. The statistical analysis was performed using Kruskal-Wallis at 95% of confident level
Table 7. The results of the AHP and recommendations for action to improve the performance of communal waste management at the neighborhood level in the community in each watershed
|
Aspects |
The scores of Analytical Hierarchy Process [%] |
|||||||
|
Kripik |
Kreo |
Upstream Garang |
Downstream Garang |
|||||
|
Score |
Action |
Score |
Action |
Score |
Action |
Score |
Action |
|
|
Internal-Institutional |
24.20 |
Concern |
8.94 |
Low |
13.50 |
Consider |
30.58 |
Priority |
|
Financial Support |
34.31 |
Priority |
49.70 |
Priority |
8.21 |
Hold |
11.03 |
Consider |
|
Regulation |
7.92 |
Hold |
5.15 |
Hold |
9.01 |
Hold |
5.77 |
Hold |
|
Community Participation |
29.88 |
Concern |
17.75 |
Consider |
27.50 |
Concern |
36.82 |
Priority |
|
Operational Procedure |
3.68 |
Hold |
18.47 |
Consider |
41.78 |
Priority |
15.80 |
Consider |
|
Consistency Index (CI) |
0.25 |
0.17 |
0.08 |
0.08 |
||||
Note: Consistency index (CI) is under the random index (RI) = 1.49 that representing AHP validity
Several aspects of communal waste management institutions may affect the capacity of an institution to be actively involved in household waste management. Indonesian National Standard [INS] number 3242:2008 explains that the management of residential waste consists of five aspects, namely organizational institutions that move, activate, and direct the waste management system; financial support related to daily operational funding and management of fund flow bookkeeping; regulations or regulations/laws that form the basis for the formation of the organization to the collection of user fees; aspects of community participation, and; operational, technical aspects in the form of waste reduction and handling activities [22]. Institutionally, waste management at the neighborhood level in the sub-watershed Garang area is still relatively low, especially the internal-institutional aspects and community participation (Table 6).
Significantly, the weakest waste management institutions are in Kripik and Kreo watersheds compared to other areas. This is probably because there is still a large area of land that is used as a place to burn garbage. Several findings, such as residents burning trash in their yards and gardens, were quite common. In addition, the two locations, Kreo and Kripik sub-watershed, are in the upper area. This topography condition produces high river currents and carries the plastic waste down along the river [23]. The high river current is also considered as a factor for the community to eliminate plastic waste in their environment. This causally raises the public perception of the need for a waste management institution. Furthermore, throwing garbage in vacant land, rivers, or burning waste is common practical actions in Indonesian society [24]. This behavior is correlated with low community participation in the operations of waste management institutions at the neighborhood level [25]. This is a dangerous act that often occurs, especially by riverbank communities in big cities [26].
The Garang Hulu and Garang Hilir areas, which have a lower topography than the Kripik and Kreo sub-watersheds, experienced a waste disaster due to the accumulation of waste, mainly plastic, from the upstream areas [23]. It may increase community awareness on plastic waste management, thus encouraging them to establish waste management institutions. However, internal-institutional and low community participation are two main aspects with low achievement in plastic-waste control in all sub-watershed areas. In fact, the current waste management process is still carried out independently, either incinerated or disposed into the drainage. [24]. That habit is probably triggered by the community assumption that the waste disposal area is common and acceptable as a final waste disposal site, including the rivers [27]. In addition, some people also rely on the sanitation system built by the city government so that when the garbage collection process is delayed, the garbage will be scattered and carried away by the water.
Efforts to improve the waste management system independently need to be carried out to avoid plastic waste contamination. In addition, waste management institutions and waste banks are currently only used as waste containers, and the community has not yet achieved a competitive product development process [28]. Based on the AHP analysis, the priority aspects of capacity building for waste management institutions are different for each region (Table 7). These results are obtained based on the community's assessment of the need for waste management institutions, both existing and to be held. In the Kripik and Kreo areas, the need for institutional improvement is prioritized on financial support and community participation.
The majority of respondents assume that the funding aspect is needed to ensure the operational implementation of the institution. Funding is sustainable and sufficient to be used to provide procurement and management fees. Furthermore, community participation is considered necessary to be increased to ensure the supply of waste and the running of the value chain. Community participation is the driving force for the management of waste management institutions because the institution's operations are self-supporting. In addition, the internal-institutional, community participation, and operational aspects of the institution are the main aspects that must be improved in the downstream area. Financial support and regulation are the most settled aspects, possibly because the majority of households are financially independent, and there are clear regulations at the city level in waste management.
Several factors that influence waste management are considered as system barriers, including uneven population distribution and density, socio-economic and physical environmental characteristics, attitudes, behavior, and culture in the community [29-31]. The increasing number of residents in the Semarang City causes urban sprawl problems in suburban areas. The outskirts turn into urban areas without being supported with waste disposal facilities [32, 33]. Population growth is directly related to plastic waste productivity starting from the household level. Consequently, the more population becomes dense in an area, the more garbage pile will be produced [34, 35].
Waste management in Indonesia is focused on activities to reduce production and handle waste in a systematic, comprehensive, and sustainable manner [36]. Waste reduction is more clearly defined as activities to limit waste collection, recycling, and reuse [21, 37]. Waste management efforts must be carried out from upstream to downstream through sorting, grouping, and separating waste according to the type, amount, and waste origin. This process is the foundation of an independent waste management process that must be carried out starting from the household level. The sorting process can be followed by recycling the waste into more valuable by-products such as compost and interior decoration.
After the separation process from the household level, the distribution of waste from the source to temporary shelters or final processing sites is crucial [7]. Currently, the waste removal process relies on officials from the government and the private sector by paying a subscription fee. The system is considered adequate because the majority of the community is too far away to reach the final disposal site. Nevertheless, the facts on the ground show that many people still throw garbage on empty land and rivers that are not intended as garbage collection sites. The final waste processing is the safe return of processed forms of waste to the environment.
To increase the effectiveness of waste management in landfills, it is necessary to have a material recovery facility using sorting technology to recycle plastic. The recycling mechanism can be carried out through mechanical processes and other chemical-based technologies [38] or thermal treatment [39] to treat plastic waste. In addition, handling the waste problem needs to integrate various stakeholders, including industry. Industry involvement through reverse logistics models has the economic potential to recover the value of recyclable waste materials [40]. The mechanism of reverse logistics or the return of plastic waste to the industry for recycling and reuse can be an alternative solution in reducing plastic waste at the community level [41].
The independent household management of plastic waste in the four sub-watershed Garang areas, namely Kripik, Kreo, Garang Hulu, and Garang Hilir sub-watershed may need to improved, especially in reducing and sorting their plastic waste; instead, burning or dumping it in vacant land or rivers. The Garang watershed communities’ low awareness about proper-waste management increases plastic contamination in the river, which likely produce microplastics. Undesirable littering behavior to the Garang river correlates to the communities’ low environmental awareness and implicates in needlessness for developing waste management institutions. This result is performed by low community participation in developing the waste management institution, mostly in all aspect, except regulation aspect.
Financial support and community participation aspect are two main features must be increased in upstream areas of Garang watershed. In contrast, internal-institution, community participation, and institutional operation are the main aspects that must be improved in downstream areas. Improvement of the quality of waste management institutions at the neighborhood level needs to be carried out thoroughly through evaluation, socialization, and education on the importance of managing waste independently and social studies on the impact of institutions. These things are expected to form an independent and sustainable waste management institution in eliminating plastic waste. Therefore, further research is needed to analyze the extent of plastic contamination in the Garang watershed to map the potential for microplastic contamination. Furthermore, this study focused only in existed institution, and caused a lack information for developing a right form of the institution for the community. A future research needs to be conducted to identify community requirements as a foundation for establishing an appropriate waste management institution. Also, it is necessary to identify the plastic type that produced by the community to mitigate potential microplastic contamination.
This research was supported by Universitas Negeri Semarang, Central Java, Indonesia. The researchers would like to acknowledge Tjaturahono Budi Sanjoto and Ananto Aji from Geography Department Universitas Negeri Semarang for the technical support.
[1] Alam, O.T.Y., Sarminingsih, A., Nugraha, W.D. (2016). Pengaruh waduk jatibarang terhadap kualitas air sungai garang di intake PDAM Semarang. Jurnal Teknologi Lingkung, 5(2): 1-9.
[2] Sarminingsih, A., Rezagama, A., Ridwan, R. (2019). Simulation of rainfall-runoff process using HEC-HMS model for Garang Watershed, Semarang, Indonesia. Journal of Physic: Conference Series, 1217(1): 012134-012134. https://doi.org/10.1088/1742-6596/1217/1/012134
[3] [DPCR]. (2019). Department of Population and Civic Registration. Jumlah Penduduk Kota Semarang. Semarang City: http://www.dispendukcapil.semarangkota.go.id/statistik/jumlah-penduduk-kota-semarang/2019-12-28, accessed on Dec. 9, 2021.
[4] Hardati, P., Setyowati, D.L., (2019). Population growth in the upper Garang watershed Semarang Regency, Central Java Province, Indonesia. IOP Conference Series: Earth and Environmental Science, 256(1): 012032-012032. https://doi.org/10.1088/1755-1315/256/1/012032
[5] Pigawati, B., Roynaldi, A.D., Desectasari, D.P., Hutama, M.P. (2019). Pengaruh perubahan penggunaan lahan terhadap nilai koefisien aliran permukaan sub das garang kota semarang: Upaya Evaluasi tata ruang kawasan permukiman. In Seminar Nasional Geomatika, 3: 1037-1048. https://doi.org/10.24895/sng.2018.3-0.994
[6] [BPS]. (2017). Badan Pusat Statistika (Statistic Indonesia). Data dan informasi lingkungan hidup provinsi Jawa Tengah. https://jateng.bps.go.id/publication/2021/10/07/26db437d364a8a5edbbeccc8/data-dan-informasi-lingkungan-hidup-provinsi-jawa-tengah-2020.html, accessed on Dec. 9, 2021.
[7] Maspaitella, B.J., Susanty, A., Purwaningsih, R. (2021). Waste transportation route garbage using network analysis method, a research method design. In IOP Conference Series: Materials Science and Engineering, 1072(1): 012025. https://doi.org/10.1088/1757-899x/1072/1/012025
[8] Pertiwi, A., Kiky, S.M.P., Wiwik, B., Ratna, P., Budi, P.S., Arya, R. (2018) Preliminary study on plastic waste handling in Semarang City-Indonesia: Estimated generation and existing management. E3S Web of Conference, 73: 07008. https://doi.org/10.1051/e3sconf/201873 07008
[9] [BPS Kota Semarang]. (2021). Badan Pusat Statistika (Statistic Indonesia). Kota Semarang dalam angka tahun. https://semarangkota.bps.go.id/publication/2021/02/26/cf7000f79cd1c7015c2939fc/kota-semarang-dalam-angka-2021.html, accessed on Dec. 9, 2021.
[10] Nugraha, A.L., Hani’ah, Pratiwi, R.D. (2017). Assessment of multi hazards in Semarang city. In AIP Conference Proceedings, 1857: 100006. http://dx.doi.org/10.1063/1.4987112
[11] Thanki, S., Govindan, K., Thakkar, J. (2016). An investigation on lean-green implementation practices in Indian SMEs using analytical hierarchy process [AHP] approach. Journal of Clean Production, 135: 284-98. http://dx.doi.org/10.1016/j.jclepro.2016.06.105
[12] Lebreton, L.C.M., van der Zwet, J., Damsteeg, J.W., Slat, B., Andrady, A., Reisser, J. (2017). River plastic emissions to the world’s oceans. Nature Communications, 8(1): 1-10. https://doi.org/10.1038/ncomms15611
[13] Kahfi, A. (2017). Tinjauan terhadap pengelolaan sampah. Jurisprudentie, 4(1): 12-25. https://doi.org/10.24252/jurisprudentie.v4i1.3661
[14] Velis, C.A., Cook, E. (2021). Mismanagement of plastic waste through open burning with emphasis on the global south: A systematic review of risks to occupational and public health. Environmental Science and Technology, 55(11): 7186-7207. https://doi.org/10.1021/acs.est.0c08536
[15] Wilkinson, J., Hooda, P.S., Barker, J., Barton, S., Swinden, J. (2017). Occurrence, fate and transformation of emerging contaminants in water: An overarching review of the field. Environmental Pollution, 231: 954-70. https://doi.org/10.1016/j.envpol.2017.08.032
[16] Lahens, L., Strady, E., Kieu-Le, T.C., Dris, R., Boukerma, K., Rinnert, E., Gasperi, J., Tassin, B. (2018). Macroplastic and microplastic contamination assessment of a tropical river (Saigon River, Vietnam) transversed by a developing megacity. Environmental Pollution, 236: 661-671. https://doi.org/10.1016/j.envpol.2018.02.005
[17] Hadiyanto, H., Khoironi, A., Dianratri, I., Suherman, S., Muhammad, F., Vaidyanathan, S. (2021). Interactions between polyethylene and polypropylene microplastics and Spirulina sp. microalgae in aquatic systems. Heliyon, 7(8): e07676. https://doi.org/10.1016/j.heliyon.2021.e07676
[18] He, D., Luo, Y., Lu, S., Liu, M., Song, Y., Lei, L. (2018). Microplastics in soils: Analytical methods, pollution characteristics and ecological risks. TrAC - Trends in Analytical Chemistry, 109: 163-72. https://doi.org/10.1016/j.trac.2018.10.006
[19] Auta, H.S., Emenike, C.U., Fauziah, S.H. (2017). Distribution and importance of microplastics in the marine environment: A review of the sources, fate, effects, and potential solutions. Environment International, 102: 165-76. http://doi.org/10.1016/j.envint.2017.02.013
[20] Prasetiyo, W.H., Kamarudin, K.R., Dewantara, J.A. (2019). Surabaya green and clean: Protecting urban environment through civic engagement community. Journal of Human Behavior in the Social Environment, 29(8): 997-1014. https://doi.org/10.1080/10911359.2019.1642821
[21] Putri, A.R., Fujimori, T., Takaoka, M. (2018). Plastic waste management in Jakarta, Indonesia: Evaluation of material flow and recycling scheme. Journal of Material Cycles and Waste Management, 20(4): 2140-2149. http://doi.org/10.1007/s10163-018-0753-2
[22] [NSI]. (2008). National standardization agency of indonesia. SNI 3242:2008 Tentang Pengelolaan Sampah di Permukiman. Badan Standardisasi Nasional, pp. 1-23.
[23] Setyaningsih, W., Hadiyanto, H., Putranto, T. (2020) Plastic wastes distribution pattern in the COVID-19 era in Kreo sub-watershed basin, Semarang City. E3S Web of Conference, 317: 04026. https://doi.org/10.1051/e3sconf/202131704026
[24] Schlehe, J., Yulianto, V.I. (2018). Waste, worldviews and morality at the South Coast of Java: an anthropological approach. Occasional Papers, 41(6): 41-41. http://www.southeastasianstudies.uni-freiburg.de/Content/files/occasional-paper-series/op41.pdf.
[25] Kaiser, M.L., Hand, M.D., Pence, E.K. (2020). Individual and community engagement in response to environmental challenges experienced in four low-income urban neighborhoods. International Journal of Environmental Research and Public Health, 17(6): 1-25. https://doi.org/10.3390/ijerph17061831
[26] Hanafi, A.S., Sholihah, Q., Martina, M., Deniati, E.N. (2018). Household waste management among riverside communities and other determinants. Jurnal Media Kesehatan Masyarakat Indonesia, 14(4): 368-377. https://doi.org/10.30597/mkmi.v14i4.5091
[27] Limon, M.R., Vallente, J.P.C., Corales, N.C.T. (2020). Solid waste management beliefs and practices in rural households towards sustainable development and pro-environmental citizenship. Global Journal of Environmental Science and Management, 6(4): 441-456. https://doi.org/10.22034/gjesm.2020.04.02
[28] Gunartin, G., Mulyanto, E., Sunarsi, D. (2020). The Role Analysis of Waste Bank in Improving the Community's Creative Economy (Study at Ketumbar Pamulang Waste Bank). Budapest International Research and Critics Institute (BIRCI-Journal): Humanities and Social Sciences, 3(4): 3262-3269. https://doi.org/10.33258/birci.v3i4.1360
[29] Oluwadipe, S., Garelick, H., McCarthy, S., Purchase D. (2021). A critical review of household recycling barriers in the United Kingdom. Waste Management Research, 0734242X211060619. http://doi.org/10.1177/0734242X211060619
[30] Ulhasanah, N., Goto, N. (2018). Assessment of citizens’ environmental behavior toward municipal solid waste management for a better and appropriate system in Indonesia: A case study of Padang City. Journal of Material Cycles and Waste Management, 20(2): 1257-1272. http://doi.org/10.1007/s10163-017-0691-4
[31] Amir, M., Anto, R.P. (2018). A study policy implementation of waste management in Konawe Regency-Indonesia. Journal of Sustainable Development, 11(1): 90-101. http://doi.org/10.5539/jsd.v11n1p90
[32] Muladica, N., Murtini, T.W., Suprapti, A. (2018). Transformation of settlement caused by housing development in suburbs of Semarang. Jurnal Teknik Sipil dan Perencanaan. 20(2): 71-80. http://doi.org/10.15294/jtsp.v20i2.15171
[33] Rakhmatulloh, A.R., Buchori, I., Pradoto, W., Riyanto, B. (2018). The power of accessibility to land price in Semarang urban corridors, Indonesia. Plan Malaysia, 16(1): 118-129. http://doi.org/10.21837/pmjournal.v16.i5.416
[34] Maryono, M., Seruyaningtyas, K., Roynaldi, A.D., Hastuti, C.M., Rahma, N.N., Sudarno, S., Hadiyanto, H. (2020). Regional model development of plastic waste monitoring: Basic framework from population and public market in Central Java-Indonesia. IOP Conference Series: Earth and Environmental Science, 448(1): 1-12. https://doi.org/10.1088/1755-1315/448/1/012098
[35] Lebreton, L., Andrady, A. (2019). Future scenarios of global plastic waste generation and disposal. Palgrave Commun, 5(1): 1-11.http://doi.org/10.1057/s41599-018-0212-7
[36] Neo, E.R.K., Soo, G.C.Y., Tan, D.Z.L., Cady, K., Tong, K.T., Low, J.S.C. (2021). Life cycle assessment of plastic waste end-of-life for India and Indonesia. Resource Conservation and Recycling, 174(7): 105774. https://doi.org/10.1016/j.resconrec.2021.105774
[37] Sakti, A.D., Rinasti, A.N., Agustina, E., Diastomo, H., Muhammad, F., Anna, Z., Wikantika, K. (2021). Multi-scenario model of plastic waste accumulation potential in indonesia using integrated remote sensing, statistic and socio-demographic data. ISPRS International Journal of Geo-Information, 10(7): 1-23. https://doi.org/10.3390/ijgi10070481
[38] Kim, S., Park, C., Lee, J. (2020) Reduction of polycyclic compounds and biphenyls generated by pyrolysis of industrial plastic waste by using supported metal catalysts: A case study of polyethylene terephthalate treatment. Journal of Hazard Material, 392(3): 122464. https://doi.org/10.1016/j.jhazmat.2020.122464
[39] Zhao, X., Xia, Y., Zhan, L., Xie, B., Gao, B., Wang, J. (2019). Hydrothermal treatment of e-waste plastics for tertiary recycling: Product slate and decomposition mechanisms. ACS Sustainable Chemistry and Engineering, 7(1): 1464-1473. https://doi.org/10.1021/acssuschemeng.8b05147
[40] Budihardjo, M.A., Ardiansyah, S.Y., Ramadan, B.S. (2022). Community-driven material recovery facility (CdMRF) for sustainable economic incentives of waste management: Evidence from Semarang City, Indonesia. Habitat International, 119(3): 102488. http://doi.org/10.1016/j.habitatint.2021.102488
[41] Hidayat, Y.A., Kiranamahsa, S., Zamal, M.A. (2019). A study of plastic waste management effectiveness in Indonesia industries. AIMS Energy, 7(3): 350-70. https://doi.org/10.3934/ENERGY.2019.3.350