Mohd Atif* | Mustafa Raza Rabbani | Ammar Jreisat | Somar Al-Mohamad | Taufeeque Ahmad Siddiqui | Huma Hussain | Haseen Ahmed
© 2022 IIETA. This article is published by IIETA and is licensed under the CC BY 4.0 license (http://creativecommons.org/licenses/by/4.0/).
OPEN ACCESS
In this study, we provide new evidence on the relationship between crude oil, exchange rate and stock returns before and after the official announcement of COVID-19 as a pandemic by WHO. Data for the present study consists of the major stock indices of ten emerging markets (Brazil, China, India, Indonesia, Mexico, Russia, Saudi Arabia, South Africa, Taiwan and Thailand), their exchange rates, and prices of Brent crude oil. We employ panel vector autoregression and provide evidence based on panel granger causality, impulse response function and forecast error variance decomposition. Panel granger causality reveals that after the declaration of COVID-19 as pandemic, interdependence between oil price changes and stock returns has increased. We find positive (negative) impact of oil market (exchange rate) shocks on stock returns. Analysis of impulse response suggests that during pandemic shocks to crude oil, exchange rate and stock market have larger and longer own and cross-market impact. Thus, there is a need for sharing timely and adequate information to minimize uncertainties in financial and commodity markets. This would benefit investors by lessening the transmission of shocks during the times of crisis.
crude oil, emerging stock markets, exchange rate, panel vector autoregression, COVID-19
The adverse economic impacts of COVID-19 started to expand after lockdown of Wuhan, a major industrial province of China [1]. The distress increasingly worsened as international flights were suspended and severe lockdown was imposed in several countries. The pandemic which started as a health emergency soon brought economic crisis which resulted in severe precariousness of the financial markets. Both crude oil and stock markets plummeted down [2, 3]. For crude oil and stock markets across the globe, the first quarter of 2020 proved to be one of the worst quarters of all times. Oil prices dipped to its lowest level in nearly 20-years. Between January 02, 2020, and March 23, 2020, S&P500 (USA) fell by more than 31%; FTSE100 (UK) dropped by more than 34%; CAC40 (France) fell over 35%; and Nikkei225 (Japan) declined by more than 27%. Emerging stock markets all over the world also crashed [4, 5]. The stock prices of Brazil (Ibovespa) dropped by over 45%; India's Nifty50 fell over 37%; and Russia's MOEX Index fell by about 26%. Nearly all the stock markets of the world experienced depressing trends [4-7]. Conventional wisdom suggests a negative relation between oil prices and stock returns [8]. As crude oil is a major input for production, transportation and heating processes, its impact on corporate earnings and household savings is obvious. Hamilton [9] provides evidence of negative relation between oil prices and economic growth. The negative impact of oil prices on the stock markets is confirmed by.
However, there are many studies which report a positive relation between oil prices and stock returns. For example, Basher and Sadorsky [10] among others provide positive relation between oil prices and stock returns of emerging markets. Owing to energy necessity, crude oil is the largest traded commodity between the countries involving high-value forex transactions. This large inflow and outflow of forex influence the exchange rate between the currencies involved [11]. Thus, shocks in crude oil price may well affect stock market through the channel of exchange rate [12, 13].
In the context of COVID-19 crisis, this study makes an earnest attempt to examine the links between oil prices, exchange rates and the stock markets. The study employs panel vector autoregression and provides evidence based on panel granger causality, impulse response function and forecast error variance decomposition. Granger causality is one of the most applied tools in time series analysis as it captures the short-term causal relationship between two variables [14]. Impulse response function plots the path of relationship, caused by the impact of the standard deviation of one variable on the other, whereas variance decomposition finds the forecast error caused by the change in another variable. Variance decomposition and impulse response function, not only show the strength of connectedness but also the time-varying property of the relationship [15].
The rest of the study is structured as follows. Section 2 presents review of related literature; section 3 describes the data; section 4 presents methodology followed by results and discussions in section 5; and finally, section 6 concludes the study.
Chen et al. [16] are among the first to study the impact of macroeconomic variables on the stock market. They found that there is no impact of oil prices on stock prices. Similarly, Hamao [17] and Huang et al. [18] and Jones and Kaul [19] are among the earliest studies which explored the relationship between oil prices and the stock market. Hamao [17] and Huang et al. [18] also did not find the evidence of linkage between the two. However, Jones and Kaul [19] considering Producer price index as oil price, found the relationship between oil prices and stock market of Canada and the USA. In the case of Japan and the United Kingdom, the relationship was found to be weaker. Karim et al. [8] also found a weaker relationship between S&P 500 and future oil prices.
Several studies have analyzed the association between oil prices and exchange rates. Krugman [20] is one of the earliest studies based on the relationship between oil prices and exchange rate. In the study, the author developed a theoretical model to examine the effect of change in oil prices on the exchange rate. The study revealed that the short-run effect and long-run effect are in opposite direction. In the short run, increase in oil price would lead to the appreciation of the dollar, but in long-run, the dollar would depreciate [21]. Further, Amano and Van Norden [22] examined the long-term relationship between the domestic price of oil and real effective exchange rate. The study applied Granger causality and found that there is a robust relationship between the real domestic price of oil and real effective exchange rate. Other studies which have explored the relationship are [15, 23, 24].
Enormous literature is available based on the relationship between oil prices and the stock market. Basher and Sadorsky [24] investigated the impact of oil prices on the stock markets in emerging economies. The study used international multi-factor model which allows conditional and unconditional risk factors to assess the impact of oil prices on stock market. The study found a strong relationship between the variables. Maghyereh and Al-Kandari [25] applied rank tests of cointegration to analyse the impact of oil prices on stock markets of the Gulf Cooperation Council (GCC). The study found that there is a non-linear impact of oil prices on the stock market. One more similar study is by Narayan and Narayan [26]. The study considered the impact of oil prices on the stock market of Vietnam from 2000 to 2008. The study found the cointegrating relationship between the variables. Sukcharoen et al. [27] analysed the relationship between oil price and the stock market indices, applying copula-based interdependence on data ranging from 1982 to 2007. The study found that there is largely weak dependence between the oil prices and the stock indices, excluding the USA and Canada. Stock indices of the countries have shown strong dependence with oil prices.
There are other studies also which have considered the same connection, such as Odusami [28], Cong et al. [29], and Miller and Ratti [14], investigated the relationship between the stock markets of OECD and oil price shocks by applying panel threshold cointegration approach on data from January 1995 to 2009. They found a cointegrating relationship between the variables. Bidirectional causality was also found between oil price and stock market indices of OECD and non-OECD countries [14]. Aydogan and Berk [15] analyzed the similar relationship in Turkey. The study applied a variance decomposition model on data ranging from 1990 to 2011. The study found little evidence of any relationship between the oil prices and stock market of Turkey [15]. However, Tursoy and Faisal [30] reported positive relationship between crude oil and stock prices in Turkkey [30].
Apart from linkages between crude oil prices and the stock market, few other financial and macroeconomic factors have also been included in the recent studies. Jain and Ghosh [31] studied the dynamic linkages between crude oil prices, exchange rate and stock market index in India. The findings indicated that a decrease in oil price leads to a decrease in the value of the Indian rupee and benchmark index (Sensex). Shinghal et al. [32] found that in the long-run oil prices affect the exchange rate in Mexico.
As discussed above, there are studies on the relationship between oil prices and stock markets. But the studies based on the linkages in the context of financial crises are limited. Wen et al. [33] examined the contagion effect between oil prices and stock markets of China and the USA. Based on the time-varying copula, the study found that dependence increased between the two. Similarly, Du and He [34] analysed the relationship between WTI and the S&P stock index. The study utilized Granger causality and Kernel-based value at risk measure. The study found an increased bidirectional correlation between the oil and stock market owing to the crisis. In the same way, Bouri [35] analysed the linkage between the crude oil price and Lebanon stock market by applying VAR-GARCH model on weekly data ranging from 1998 to 2014. This study also found that the crisis intensified the relationship. Mensah et al. [36] assessed the long-term relationship between Crude oil prices and the exchange rate of major oil-dependent economies in the pre and post period of the global financial crisis of 2008-2009. It was observed that there is a long-term relationship between oil prices and the exchange rates of major oil-exporting countries, particularly in the post-crisis period.
Mensi [37] explored the co-movement between oil prices and the stock market of Saudi Arabia during the Global Financial Crisis of 2008-2009(GFC). The author applied the value at risk and Wavelet method to study the impact. Findings indicate increased co-movement between the oil prices and the stock market. Ajmi et al. [38] applied the non-linear and asymmetrical causality test to explore the impact of oil prices and the stock market of MENA counties during the financial crisis of 2008-2009. The authors found that the interaction is non-linear between stock markets and oil prices. Fayyad and Daly [39] compared the impact of oil prices on the stock markets of GCC and UK and USA. The authors applied the Vector autoregression on the daily data ranging from 2005 to 2010. Authors found that predictive power and the impulsive response of oil prices increased during the Global financial crisis [40, 41].
In the Context of the COVID-19 crisis, Albulescu et al. [42] investigated the relationship between oil prices and stock markets of the USA during the COVID-19 crisis. The authors applied the wavelet approach to the data from February 2020 to August 2020. Results show that there was a lead-lag relationship between the oil prices and stock markets. Moreover, results show that during the early phase of COVID-19, March, and April 2020, co-movement was found even at the low scales of 3-5 days. Similarly, Sharif et al. [43] analyzed the relationship in the time and frequency domain by applying the wavelet-based granger causality. Authors found the impact of oil price shocks on the US stock market, where the COVID-19 outbreak was found to have a greater effect than the geopolitical and economic uncertainty.
The period also witnessed high volatility of exchange rate. An inverse relationship between the oil prices and the exchange rate was also [44-46]. Li and Wei [47] conducted a study in China. Time-varying based copula indicated that crisis increases the dependence between the oil prices and the stock market and long-run dependency increases more significantly than the short run. The study scrutinized the long-term association between crude oil price and the China stock market during the subprime crisis. The study used a nonlinear threshold cointegration method within a multivariate framework. Three macroeconomic factors (foreign exchange market, domestic economic development, and total foreign trade volume in China) were used as transmission channels between oil price and stock price. The study found that, among the three macroeconomic factors, the exchange rate plays the most significant role in transmitting the impact of oil prices on the stock market particularly after the financial crisis [21].
The impulse response function is a widely applied tool to study the impact of one variable on the other hand [24] applied the variance decomposition, Granger causality, and Impulse response function to study the relationship between the oil prices and exchange rate. The study utilizes variance decomposition as it gives information about random innovations in the system. Similarly, the Impulse response function illustrates the dynamic behavior of one variable on the current and future innovations of another variable. Sahu et al. [48] applied the Variance decomposition and Impulse response, as causality tests do not capture the dynamic nature and degree of strength of the relationship.
Thus, the review of previous studies discloses that enormous literature is available on the association between crude oil prices and the stock market. Studies are available which have considered other financial factors also, such as, exchange rate. The linkage or interdependence has been studied during the crises also. Still, the studies based on the linkages in the context of the crises are limited. The studies based on the impact of COVID 19 are even rarer. The present study utilises panel Vector Autoregressive (pVAR) model with vector of three endogenous variables. The variables are the returns series of crude oil price, exchange rate of ten countries and stock price of benchmark index of ten countries. The analysis is separately carried out for the pre and post COVID-19 announcement. The purpose is to assess transmission of the shock owing to COVID-19.
The way that section titles and other headings are displayed in these instructions, is meant to be followed in your paper.
Data for the present study consists of three sets of series. First data set belongs to the closing price histories of the major indices of the ten emerging markets. These ten markets are the ones which account for the largest weight in 'S&P Dow Jones Emerging Markets Index' in 2019. The names of the countries in alphabetic order along with their respective indices in parentheses are- Brazil (Bovespa), China (Shanghai Composite), India (Nifty 50), Indonesia (Jakarta Stock Exchange Composite Index), Mexico (S&P/BMV IPC), Russia (MOEX Russia Index), Saudi Arabia (Tadawul All Share Index), South Africa (Top 40), Taiwan (FTSE TWSE Taiwan 50 Index) and Thailand (SET 50). The second data set is the exchange rate of the selected countries against the US Dollar. Third data series is the daily prices of the Brent crude oil. Data for all the variables are obtained from Bloomberg from January 1, 2019, to July 31, 2020.
For analysis, all data series are split into two samples. First sample period denoted 'pre-covid-announcement' ranges from January 1, 2019, to March 6, 2020, and the second sample denoted 'post-covid-announcement' is from March 9, 2020, to July 31, 2020. Reason for choosing March 6, 2020, as the split date for the two periods, is that immediately after this date oil prices and almost all the stock markets of the world experienced a sharp decline [49]. Moreover, on March 10, 2020, WHO officially declared Covid-19 as a pandemic [50, 51].
All the analyses are carried out on both the samples separately. Table 1 shows the average closing prices of stock indices, exchange rate and crude oil for both the periods. It is evident that in the second period which is marked by the rapid spread of the COVID-19 pandemic, all the stock indices except the stock index of Taiwan are lower than what they were in the first sample. Similarly, the average exchange rate for all the countries except Taiwan is higher in the second period. The average price of Brent crude oil which was around \$63 in the first period dropped to \$35 in the second period.
Table 2 reports the summary statistics of stock returns and oil price changes. Panel A of Table 2 reports the summary statistics for the pre-covid-announcement period and Panel B reports the summary statistics for the period after the announcement of COVID-19. Panel A of Table 2 shows that average returns of four indices i.e., Indonesia, Mexico, Saudi Arabia and Thailand are negative. During this period, Thailand has the lowest average return i.e., -0.0443% while China has the highest average return of 0.0637%.
Standard deviation in the first period ranges from 0.75% for Taiwan to 1.26% for Brazil. Skewness for all the indices is negative except for India and Mexico. In addition, the values of kurtosis reveal that all the indices have fat tails, and the index returns of Taiwan are most leptokurtic with excess kurtosis of 12%.
From Panel B of Table 2, after the announcement of COVID-19 as a pandemic, all stock indices became more volatile as reflected by the higher values of standard deviations which range from 1.40% for China to 4.02% for Brazil. During this period even the lowest standard deviation is larger than the largest standard deviation in the pre-announcement period. Except for Indonesia, indices of all countries exhibit negative skewness. Moreover, all the indices have much higher leptokurtosis during the second period compared to the first period.
Table 2 reports the summary statistics for returns of Brent crude oil. Daily mean return on crude oil are almost same in both the periods, i.e., -0.056% during pre-announcement and -0.051% during post-announcement.
However, the standard deviation in the crisis period is much higher i.e., 6.85%, compared to 2.04% in the pre-covid period. In addition, oil returns have negative skewness and are slightly more leptokurtic during the second period.
Table 3 reports the summary statistics for changes in the exchange rate for each country during the two time periods. The exchange rate for each country is expressed as units of domestic currency per US Dollar. In this way increase in the value of exchange rate indicates depreciation of the domestic currency vis-à-vis US dollar. From Panel A of Table 3, it is visible that for all countries except for Russia and Taiwan daily mean return on the exchange rate are positive. Similarly, during the period after the announcement of the COVID-19 pandemic, currencies of all countries except Taiwan and Saudi Arabia have positive daily average returns. Daily volatility in changes in the exchange rate is higher during the second period for all countries except for Saudi Arabia which experienced higher volatility during the first period.
Table 1. Average levels of stock price, exchange rate and crude oil
|
Pre-announcement |
Post-announcement |
|||||
|
Country |
Stock |
Exrate |
Crude Oil |
Stock |
Exrate |
Crude Oil |
|
Brazil |
102852 |
4.00 |
63.37 |
86573 |
5.29 |
34.8109 |
|
China |
2929 |
6.92 |
2951 |
7.06 |
||
|
India |
11524 |
70.60 |
9674 |
75.51 |
||
|
Indonesia |
6252 |
14091.72 |
4754 |
14971.63 |
||
|
Mexico |
43209 |
19.20 |
36486 |
23.10 |
||
|
Russia |
2747 |
64.48 |
2660 |
72.91 |
||
|
Saudi Arabia |
8377 |
3.75 |
6960 |
3.76 |
||
|
South Africa |
50099 |
14.50 |
46426 |
17.54 |
||
|
Taiwan |
10920 |
30.77 |
10995 |
29.85 |
||
|
Thailand |
1620 |
31.02 |
1281 |
31.88 |
||
Table 2. Summary statistics for index returns and crude oil
|
crude |
Brazil |
China |
India |
Indonesia |
Mexico |
Russia |
Saudi Arabia |
South Africa |
Taiwan |
Thailand |
|
|
Pre-covid-announcement |
|||||||||||
|
Minimum |
-9.9178 |
-7.2622 |
-8.0392 |
-3.7802 |
-2.7304 |
-2.6793 |
-4.5881 |
-5.6949 |
-4.6471 |
-5.9232 |
-5.1831 |
|
Median |
0.1081 |
0.0305 |
0.0019 |
0.0000 |
0.0000 |
-0.0295 |
0.0470 |
0.0000 |
0.0000 |
0.0321 |
0.0000 |
|
Arithmetic Mean |
-0.056 |
0.0354 |
0.0637 |
0.0024 |
-0.0387 |
-0.0020 |
0.0448 |
-0.0141 |
0.0002 |
0.0493 |
-0.0443 |
|
Maximum |
13.6392 |
3.4939 |
5.4495 |
5.1825 |
2.8933 |
2.4226 |
2.3948 |
3.8325 |
2.1976 |
2.1905 |
2.8998 |
|
Stdev |
2.0407 |
1.2605 |
1.2030 |
0.8828 |
0.7629 |
0.8787 |
0.8260 |
0.9835 |
0.9594 |
0.7566 |
0.7918 |
|
Skewness |
0.1321 |
-1.1139 |
-1.1322 |
0.5684 |
-0.1816 |
0.0580 |
-1.1580 |
-0.7634 |
-1.0364 |
-1.6372 |
-1.6270 |
|
Kurtosis |
8.2195 |
4.2786 |
9.4702 |
5.1938 |
1.4318 |
0.7308 |
5.1245 |
5.3604 |
3.2529 |
12.0395 |
9.5974 |
|
Post-covid-announcement |
|||||||||||
|
Minimum |
-37.3399 |
-15.9938 |
-4.6027 |
-13.9038 |
-6.8051 |
-6.6381 |
-8.6460 |
-16.7554 |
-10.4504 |
-6.0055 |
-11.4282 |
|
Median |
0.4684 |
0.4638 |
0.1121 |
0.2173 |
0.0000 |
-0.0114 |
0.1389 |
0.0000 |
0.1314 |
0.1995 |
0.0692 |
|
Arithmetic Mean |
-0.0513 |
0.0671 |
0.0775 |
0.0099 |
-0.0636 |
-0.1052 |
0.0566 |
-0.0011 |
0.0928 |
0.1133 |
-0.0354 |
|
Maximum |
19.0774 |
13.0228 |
5.5542 |
8.4003 |
9.7042 |
4.7439 |
7.4349 |
6.8315 |
7.9071 |
6.1726 |
7.6531 |
|
Stdev |
6.856 |
4.0247 |
1.4014 |
2.8645 |
2.1804 |
1.9962 |
2.1677 |
2.4038 |
2.6352 |
1.6851 |
2.4601 |
|
Skewness |
-1.8761 |
-1.1815 |
-0.1232 |
-1.3520 |
0.2251 |
-0.4703 |
-0.7615 |
-3.5874 |
-0.8927 |
-0.4133 |
-1.6209 |
|
Kurtosis |
9.855 |
5.0473 |
2.9955 |
5.8556 |
4.0932 |
1.0258 |
5.4402 |
22.8975 |
3.4371 |
2.9857 |
7.6619 |
Table 3. Summary statistics for changes in exchange rate
|
Brazil |
China |
India |
Indonesia |
Mexico |
Russia |
Saudi Arabia |
South Africa |
Taiwan |
Thailand |
|
|
pre-covid-announcement |
||||||||||
|
Minimum |
-1.9811 |
-0.7532 |
-0.9046 |
-1.6179 |
-2.1106 |
-1.5957 |
-0.6683 |
-2.4566 |
-0.9656 |
-1.1981 |
|
Median |
0.0656 |
0.0014 |
-0.0007 |
-0.0036 |
-0.0158 |
0.0005 |
0.0013 |
-0.0132 |
-0.0025 |
-0.0001 |
|
Arithmetic Mean |
0.0519 |
0.0026 |
0.0237 |
0.0059 |
0.0170 |
-0.0015 |
0.0206 |
0.0146 |
-0.0074 |
0.0160 |
|
Maximum |
2.1294 |
1.5796 |
1.7975 |
1.4980 |
2.9469 |
2.0123 |
0.9000 |
2.6081 |
0.9809 |
1.4696 |
|
Stdev |
0.7177 |
0.2530 |
0.3579 |
0.3888 |
0.5615 |
0.5595 |
0.1415 |
0.7968 |
0.2362 |
0.3142 |
|
Skewness |
0.0262 |
1.1568 |
0.5356 |
0.1341 |
0.7163 |
0.4076 |
2.9348 |
0.0788 |
0.0249 |
0.7092 |
|
Kurtosis |
0.3226 |
6.6026 |
1.7666 |
2.3072 |
2.9672 |
1.6396 |
17.8494 |
0.5221 |
4.6573 |
3.1109 |
|
Post-covid-announcement |
||||||||||
|
Minimum |
-3.4916 |
-0.6759 |
-1.4818 |
-3.1176 |
-4.9597 |
-3.3139 |
-0.1158 |
-2.3485 |
-0.8038 |
-0.9479 |
|
Median |
0.0612 |
0.0000 |
0.0282 |
0.0845 |
-0.0401 |
-0.1399 |
-0.0047 |
-0.0653 |
-0.0067 |
0.0000 |
|
Arithmetic Mean |
0.1147 |
0.0106 |
0.0107 |
0.1413 |
0.0872 |
0.0894 |
-0.0009 |
0.0834 |
-0.0114 |
0.0201 |
|
Maximum |
4.6010 |
0.9850 |
1.5063 |
5.1056 |
5.0040 |
7.9392 |
0.2946 |
3.5933 |
0.5460 |
1.0331 |
|
Stdev |
1.5560 |
0.2676 |
0.4700 |
1.1170 |
1.6224 |
1.5742 |
0.0541 |
1.2376 |
0.2326 |
0.3559 |
|
Skewness |
-0.0097 |
0.6755 |
-0.0156 |
0.9246 |
0.4209 |
2.1244 |
2.4415 |
0.6001 |
-0.2150 |
0.4389 |
|
Kurtosis |
-0.1442 |
2.2588 |
1.2574 |
3.9310 |
1.0778 |
8.4661 |
10.9393 |
0.3076 |
1.0629 |
0.7252 |
To examine the relationship between crude oil, exchange rate and stock returns of the selected emerging markets, we employ panel vector autoregression first introduced by Holtz-Eakin et al. [52] and later implemented in GMM framework by Love and Zicchino [53]. Recently, Salisu et al. [23] have also employed panel VAR to examine the impact of crude oil on index returns.
For setting up the panel VAR, we employ a vector of three endogenous variables i.e., $\mathrm{Y}_{\mathrm{t}}^{\prime}=\left[\begin{array}{lll}C_{t} & X_{t} & R_{t}\end{array}\right]^{\prime}$ where $C_{t}, X_{t}$ and $R_{t}$ represent returns on crude oil, exchange rate and stock index respectively. A panel VAR with K endogenous variables and L exogenous variables can be represented as follows [54].
$\mathrm{Y}_{\mathrm{i}, \mathrm{t}}=\sum_{j=1}^{p} \mathrm{Y}_{i, t-j} \mathrm{~A}_{j}+X_{t} \mathrm{~B}+\mu_{i}+\varepsilon_{i, t}$ (1)
where, $Y_{i, t}$ and $Y_{i, t-j}$ are 1×K vectors of endogenous variables; $X_{t}$ is a 1×L vector of exogeneous covariates; $\mu_{i}$ is 1×K vector or country specific fixed effect and $\varepsilon_{i, t}$ is a 1×K vector of error terms. $A_{j}$ and Β are K×K and L×K matrices of coefficients. In our case, the PVAR is given as follows:
$R_{i t}=\sum_{j=1}^{p} \alpha_{j}^{(r)} C_{i, t-j}+\sum_{j=1}^{p} \beta_{j}^{(r)} X_{i, t-j}+\sum_{j=1}^{p} \gamma_{j}^{(r)} R_{i, t-j}$ $+\mu_{i}+\varepsilon_{i t}^{(r)}$ (2)
$X_{i t}=\sum_{j=1}^{p} \alpha_{j}^{(x)} C_{i, t-j}+\sum_{j=1}^{p} \beta_{j}^{(x)} X_{i, t-j}+\sum_{j=1}^{p} \gamma_{j}^{(x)} R_{i, t-j}$ $+v_{i}+\varepsilon_{i, t}^{(x)}$ (3)
$C_{i t}=\sum_{j=1}^{p} \alpha_{j}^{(c)} C_{i, t-j}+\sum_{j=1}^{p} \beta_{j}^{(c)} X_{i, t-j}+\sum_{j=1}^{p} \gamma_{j}^{(c)} R_{i, t-j}$ $+\omega_{i}+\varepsilon_{i t}^{(c)}$ (4)
where
R_(i,t), X_(i,t) and C_t are index returns, exchange rate returns and crude oil returns at time t for country i. α, β and γ are parameters to be estimated; μ_i, ν_i and ω_i are country specific effects in each of the equations; and, ε_(i,t), are error terms in the three equations.
The set of Eqns. (2)-(4) are estimated using GMM in the framework of panel vector autoregression for efficiency gains Holtz-Eakin et al. [52]. The set of equations is estimated separately for the periods before and after the announcement of COVID-19 as a pandemic.
In VAR models, the individual coefficients of lags of variables are usually not analysed. Rather the impact of lags of a variable on another variable is analysed with the help of and F-test. First, an unrestricted VAR is estimated with all the lags of all the variables, then, a restricted VAR is estimated by setting the coefficients of lags of a particular variable equal to zero. If the restriction is supported, then it is concluded that the lags of one variable are not helpful in predicting the other variable. This framework was first proposed by Granger (1969) and since then it is referred to as Granger causality. In our case, if all the α_j^((r) ) in Eq. (2) are jointly zero, then it would imply that changes in crude oil price do not impact stock returns. Or in other words, it will be said that oil returns do not Granger cause stock returns. Similarly, if in Eq. (2) all β_j^((r) ) are zero, then it would indicate that changes in exchange rate do not Granger cause stock returns. Granger causality test is helpful in determining whether history of a variable is helpful in predicting another variable. However, this test does not tell whether the variable has a positive or negative impact on another variable. For example, if Granger causality reveals that oil price changes Granger cause stock returns, then it implies that oil price changes are important for forecasting stock returns, but it does not reveal whether oil price changes have positive or negative impact on stock returns. In addition, Granger causality cannot reveal how long does it take for stock returns to fully absorb the impact of change in oil prices. Towards this purpose, impulse response function and variance decomposition are employed. Specifically, impulse response graph shows whether the impact of a unit shock to the error term in one equation has a positive or a negative impact and for how long this impact persists. variance error decomposition on the other hand tells the proportion of variation in forecast of a variable which is due to own shock versus shocks to the other variables. Because of the dynamic nature of VAR, the shocks to a variable not only affect that variable's future values, but also influence the future values of other variables. Error Variance decomposition reveals as to how much variation in h-step ahead forecast of a variable is explained by own versus other variables' shocks. We have used R and Stata-16 for carrying out the analyses.
Abrigo and Love [54] note that problem of weak instruments arises with GMM estimator in the presence of unit root in the endogenous variables, therefore, we start our analysis by examining whether the variables being modelled have a unit root. Using Levin et al. [55] test, we find that all the three variables rstock, rexrate and rcrude do not have a unit root. Next, we set up panel vector autoregression as specified in Eqns. (2) to (4) and perform panel granger causality test. The results of panel granger causality for pre- and post-pandemic announcement are presented in Table 4. In the pre-announcement period, there is two-way Granger causality between rcrude and rexrate while there is one-way Granger causality from rcrude and rexrate to rstock. In other words, in the pre-announcement period, rcrude and rexrate granger causes rstock but not vice versa.
In the post-announcement period, we again find two-way causality between rcrude and rexrate. During this period, the causality between rcrude and rstock is also two-way while in the pre-announcement period this was one way. This increased interdependence between oil price changes (rcrude) and stock market returns (rstock) is not surprising. After the official announcement of COVID-19 as a pandemic and subsequent sudden spread of virus resulted in the slowdown of economic activity which affected oil demand globally and led to panic selling in the stock market [43-44]. The results of Granger causality further reveal that in the covid period, there is no causality between rexrate and rstock. However, this does not necessarily imply that the exchange rate and stock returns are decoupled in the post-announcement period. Exchange rate and stock returns can very well influence each other through other channels.
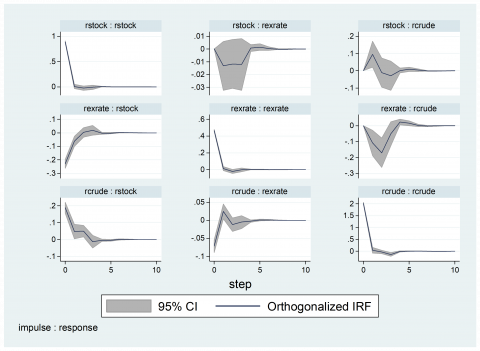
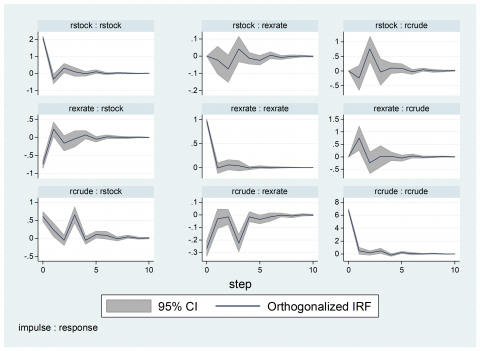
To fully understand the impact of oil price changes on stock returns we also make use of impulse response function (IRF) and variance decomposition based on the panel var of Eqns. (2)-(4). Since it is well known that impulse response and decomposition of forecast error variance depend on the ordering of the variables, therefore the ordering should be based on theoretical grounds. Here, we employ the ordering such that crude oil comes first, followed by the exchange rate and stock returns.
This ordering is also employed by Salisu et al. [56], Salisu and Isah [57] and is also supported by the fact that crude oil is found to be a dominant factor during both the periods as is evident from granger causality results. Figure 1 and Figure 2 show the impulse response graphs for own as well as cross-shocks for the two time periods. These graphs are drawn to represent "impulse: response", i.e. rcrude: rstock represents response of rstock to shocks to rcrude. An examination of both the figures reveals that for all the three variables, the effect of own shocks is larger in the post-covid announcement period. Similar conclusion can be drawn regarding cross-shocks also. If we compare rcrude: rstock graphs in the two figures, we find that shocks to oil price have a larger and longer impact during the pandemic period than the pre-pandemic period.
Moreover, in the post-pandemic-announcement period, if we look at the pattern of the response of stock returns to oil price changes, we find that oil shocks have an oscillating effect on stock returns. That is, initially oil price shocks have positive contemporaneous and one-step ahead effect on stock returns which becomes slightly negative by the second step and then again becomes positive and thereafter gradually dies out in this fashion.
Concerning the response of oil price to stock market shocks, the IRF graphs reveal that during the pre-covid period, stock market shocks have a little impact on crude oil prices, however, during the COVID-19 period, stock market shocks have a larger and nonlinear impact on crude oil prices. The IRF graphs also reveal that exchange rate shocks have a comparatively lesser impact on crude oil during both periods. In addition, the graphs reveal that exchange rate shocks have a negative impact on stock returns implying that dollar appreciation is detrimental to emerging stock markets.
Table 5 presents estimates of 1, 5 and 10 steps ahead decomposition of error variance for both the periods. It is evident that in the period after the announcement of covid, crude oil explains a greater proportion of forecast error variance. For example, before covid crude oil explains about 2.6% and 4.5% error variance for the exchange rate and stock returns respectively while during the covid period, the same values have increased to 11.7% and 14%. Similarly, the contribution of the exchange rate for explaining stock returns error variance increased from 6% to 10%.
Figure 1. Impulse Response graphs for pre-covid-announcement period
Table 4. Results of Granger-causality
|
Dependent |
Excluded |
Pre-announcement |
Post-announcement |
||||
|
rcrude |
|
test-stat |
df |
p-value |
test-stat |
df |
p-value |
|
Rexrate |
17.8 |
3 |
0.00 |
8.27 |
3 |
0.04 |
|
|
rstock |
7.6 |
3 |
0.05 |
14.85 |
3 |
0.00 |
|
|
ALL |
26.2 |
6 |
0.00 |
23.72 |
6 |
0.00 |
|
|
rexrate |
|||||||
|
rcrude |
10.6 |
3 |
0.01 |
29.74 |
3 |
0 |
|
|
rstock |
4.7 |
3 |
0.18 |
5.108 |
3 |
0.16 |
|
|
ALL |
14.2 |
6 |
0.02 |
37.18 |
6 |
0 |
|
|
rstock |
|||||||
|
rcrude |
13.6 |
3 |
0.00 |
39.66 |
3 |
0 |
|
|
rexrate |
9.7 |
3 |
0.02 |
2.063 |
3 |
0.55 |
|
|
ALL |
20.9 |
6 |
0.00 |
42.58 |
6 |
0 |
|
Figure 2. Impulse Response graphs for post-covid-announcement period
Table 5. Forecast error variance decomposition
|
Pre-covid-announcement |
Post-covid-announcement |
||||||
|
Response |
Forecast Step |
Impulse Variable |
Impulse Variable |
||||
|
rcrude |
rcrude |
rexrate |
rstock |
rcrude |
rexrate |
rstock |
|
|
1 |
1 |
0 |
0 |
1 |
0 |
0 |
|
|
5 |
0.98 |
0.01 |
0.00 |
0.97 |
0.01 |
0.01 |
|
|
10 |
0.98 |
0.01 |
0.00 |
0.97 |
0.01 |
0.0138 |
|
|
rexrate |
|||||||
|
1 |
0.02 |
0.97 |
0 |
0.07 |
0.92 |
0 |
|
|
5 |
0.02 |
0.97 |
0.00 |
0.11 |
0.87 |
0.00 |
|
|
10 |
0.02 |
0.97 |
0.00 |
0.11 |
0.87 |
0.00 |
|
|
rstock |
|||||||
|
1 |
0.04 |
0.05 |
0.89 |
0.06 |
0.10 |
0.82 |
|
|
5 |
0.04 |
0.06 |
0.89 |
0.13 |
0.10 |
0.75 |
|
|
10 |
0.04 |
0.06 |
0.89 |
0.14 |
0.10 |
0.75 |
|
In this study, we provide new evidence on the relationship between crude oil, exchange rate and stock returns. In order to conduct the study, we used the major stock indices of ten emerging economies (Brazil, China, India, Indonesia, Mexico, Russia, Saudi Arabia, South Africa, Taiwan, Thailand) along with their exchange rates and Brent crude oil prices. We examine this relationship before and after the official announcement of COVID-19 as a pandemic by WHO. Towards this end, we employ panel vector autoregression and provide evidence based on panel granger causality, impulse response function and forecast error variance decomposition. Panel granger causality revealed that after the declaration of COVID-19 as pandemic, interdependence between oil price changes and stock returns increased. Analysis of impulse response suggests that during pandemic shocks to crude oil, exchange rate and stock market have larger and longer own and cross-market impact. Consistent with the theory we find a positive impact of oil market shocks on stock markets. These results are in line with [24, 30, 47, 57]. However, the results disagree with the findings of [16, 17]. In addition, the results also reveal the negative impact of exchange rate on stock returns. Given the fact that most markets considered are net oil importers, the negative impact of dollar appreciation on stock markets is quite intuitive. These results confirm the findings of [31, 58].
Hence, based on the results of the study, the vital policy implication is the need for consistent and unambiguous policy to minimise uncertainties in various financial markets. This is achievable by enhanced synchronization of monetary and fiscal policies. The efficient execution of the clear policy decisions would decrease the spread of adverse impact of the pandemic across the various sectors of financial markets and the global economy. Such policy would reduce volatility spillover across the sectors. Consequently, investors would also be benefitted. Owing to the increasing spread of COVID-19 and its economic consequences for different countries around the globe, there is a wide scope for further studies. As the events unfold, future studies can include more sectors and countries on diverse parameters, applying varied techniques to comprehend further results in depth.
[1] Hasan, M.B., Mahi, M., Hassan, M.K., Bhuiyan, A.B. (2021). Impact of COVID-19 pandemic on stock markets: Conventional vs. Islamic indices using wavelet-based multi-timescales analysis. The North American Journal of Economics and Finance, 58: 101504. https://doi.org/10.1016/j.najef.2021.101504
[2] Adekoya, O.B., Oliyide, J.A. (2021). How COVID-19 drives connectedness among commodity and financial markets: Evidence from TVP-VAR and causality-in-quantiles techniques. Resources Policy, 70: 101898. https://doi.org/10.1016/j.resourpol.2020.101898
[3] Yousfi, M., Zaied, Y.B., Cheikh, N.B., Lahouel, B.B., Bouzgarrou, H. (2021). Effects of the COVID-19 pandemic on the US stock market and uncertainty: A comparative assessment between the first and second waves. Technological Forecasting and Social Change, 167: 120710. https://doi.org/10.1016/j.techfore.2021.120710
[4] Naeem, M.A., Rabbani, M.R., Karim, S., Billah, S.M. (2021). Religion vs ethics: Hedge and safe haven properties of Sukuk and green bonds for stock markets pre-and during COVID-19. International Journal of Islamic and Middle Eastern Finance and Management. ISSN: 1753-8394.
[5] Rabbani, M.R., Bashar, A., Nawaz, N., Karim, S., Ali, M.A.M., Rahiman, H.U., Alam, M. (2021). Exploring the role of Islamic fintech in combating the aftershocks of COVID-19: The open social innovation of the Islamic financial system. Journal of Open Innovation: Technology, Market, and Complexity, 7(2): 136. https://doi.org/10.3390/joitmc7020136
[6] Habeeb, S., Rabbani, M.R., Ahmad, N., Moh'd Ali, M. A., Bashar, A. (2021). Post COVID-19 challenges for the sustainable entrepreneusrhip. In 2021 International Conference on Sustainable Islamic Business and Finance, pp. 154-158. https://doi.org/10.1109/IEEECONF53626.2021.9686341
[7] Dharani, M., Hassan, M.K., Rabbani, M.R., Huq, T. (2022). Does the COVID-19 pandemic affect faith-based investments? Evidence from global sectoral indices. Research in International Business and Finance, 59: 101537. https://doi.org/10.1016/j.ribaf.2021.101537
[8] Karim, S., Naeem, M.A., Meero, A.A., Rabbani, M.R. (2021). Examining the role of gender diversity on ownership structure-sustainable performance nexus: Fresh evidence from emerging markets. Environmental Science and Pollution Research, 1-16. https://doi.org/10.1007/s11356-021-17459-6
[9] Hamilton, J.D. (1983). Oil and the macroeconomy since World War II. Journal of Political Economy, 91(2): 228-248.
[10] Sadorsky, P. (1999). Oil price shocks and stock market activity. Energy Economics, 21(5): 449-469. https://doi.org/10.1016/S0140-9883(99)00020-1.
[11] Gencer, H.G., Kilic, E. (2014). Conditional correlations and volatility links among gold, oil and Istanbul Stock Exchange sector returns. International Journal of Economics and Financial Issues, 4(1): 170-182.
[12] Salisu, A.A., Ebuh, G.U., Usman, N. (2020). Revisiting oil-stock nexus during COVID-19 pandemic: Some preliminary results. International Review of Economics & Finance, 69: 280-294. https://doi.org/10.1016/j.iref.2020.06.023
[13] Salisu, A.A., Vo, X.V., Lucey, B. (2021). Gold and US sectoral stocks during COVID-19 pandemic. Research in International Business and Finance, 57: 101424. https://doi.org/10.1016/j.ribaf.2021.101424
[14] Miller, J.I., Ratti, R.A. (2009). Crude oil and stock markets: Stability, instability, and bubbles. Energy Economics, 31(4): 559-568. https://doi.org/10.1016/j.eneco.2009.01.009
[15] Aydogan, B., Berk, I. (2015). Crude oil price shocks and stock returns: Evidence from Turkish stock market under global liquidity conditions. International Journal of Energy Economics and Policy, 5(1): 54-68.
[16] Chen, N.F., Roll, R., Ross, S.A. (1986). Economic forces and the stock market. Journal of Business, 383-403. https://doi.org/10.1086/296344
[17] Hamao, Y. (1988). An empirical examination of the arbitrage pricing theory: Using Japanese data. Japan and the World Economy, 1(1): 45-61. https://doi.org/10.1016/0922-1425(88)90005-9
[18] Huang, R.D., Masulis, R.W., Stoll, H.R. (1996). Energy shocks and financial markets. Journal of Futures Markets, 16(1): 1-27. https://doi.org/10.1002/(SICI)1096-9934(199602)16:1<1::AID-FUT1>3.0.CO;2-Q
[19] Jones, C.M., Kaul, G. (1996). Oil and the stock markets. The Journal of Finance, 51(2): 463-491. https://doi.org/10.1111/j.1540-6261.1996.tb02691.x
[20] Krugman, P. R. (1980). Oil and the Dollar. NBER Work. Pap. https://doi.org/10.3386/w0554
[21] Atif, M., Raza Rabbani, M., Bawazir, H., Hawaldar, I.T., Chebab, D., Karim, S., AlAbbas, A. (2022). Oil price changes and stock returns: Fresh evidence from oil exporting and oil importing countries. Cogent Economics & Finance, 10(1): 2018163. https://doi.org/10.1080/23322039.2021.2018163
[22] Amano, R.A., Van Norden, S. (1998). Exchange rates and oil prices. Review of International Economics, 6(4): 683-694. https://doi.org/10.1111/1467-9396.00136
[23] Salisu, A.A., Ebuh, G.U., Usman, N. (2020). Revisiting oil-stock nexus during COVID-19 pandemic: Some preliminary results. International Review of Economics & Finance, 69: 280-294. https://doi.org/10.1016/j.iref.2020.06.023
[24] Basher, S.A., Sadorsky, P. (2006). Oil price risk and emerging stock markets. Global Finance Journal, 17(2): 224-251.
[25] Maghyereh, A., Al-Kandari, A. (2007). Oil prices and stock markets in GCC countries: New evidence from nonlinear cointegration analysis. Managerial Finance, 33(7): 449-460. https://doi.org/10.1108/03074350710753735
[26] Narayan, P.K., Narayan, S. (2010). Modelling the impact of oil prices on Vietnam’s stock prices. Applied Energy, 87(1): 356-361. https://doi.org/10.1016/j.apenergy.2009.05.037
[27] Sukcharoen, K., Zohrabyan, T., Leatham, D., Wu, X. (2014). Interdependence of oil prices and stock market indices: A copula approach. Energy Economics, 44: 331-339. https://doi.org/10.1016/j.eneco.2014.04.012.
[28] Odusami, B.O. (2009). Crude oil shocks and stock market returns. Applied Financial Economics, 19(4): 291-303. https://doi.org/10.1080/09603100802314476
[29] Cong, R.G., Wei, Y.M., Jiao, J.L., Fan, Y. (2008). Relationships between oil price shocks and stock market: An empirical analysis from China. Energy Policy, 36(9): 3544-3553. https://doi.org/10.1016/j.enpol.2008.06.006
[30] Tursoy, T., Faisal, F. (2018). The impact of gold and crude oil prices on stock market in Turkey: Empirical evidences from ARDL bounds test and combined cointegration. Resources Policy, 55: 49-54. https://doi.org/10.1016/j.resourpol.2017.10.014
[31] Jain, A., Ghosh, S. (2013). Dynamics of global oil prices, exchange rate and precious metal prices in India. Resources Policy, 38(1): 88-93. https://doi.org/10.1016/j.resourpol.2012.10.001
[32] Singhal, S., Choudhary, S., Biswal, P.C. (2019). Return and volatility linkages among International crude oil price, gold price, exchange rate and stock markets: Evidence from Mexico. Resources Policy, 60: 255-261. https://doi.org/10.1016/j.resourpol.2019.01.004
[33] Wen, X., Wei, Y., Huang, D. (2012). Measuring contagion between energy market and stock market during financial crisis: A copula approach. Energy Economics, 34(5): 1435-1446. https://doi.org/10.1016/j.eneco.2012.06.021
[34] Du, L., He, Y. (2015). Extreme risk spillovers between crude oil and stock markets. Energy Economics, 51: 455-465. https://doi.org/10.1016/j.eneco.2015.08.007
[35] Bouri, E. (2015). Return and volatility linkages between oil prices and the Lebanese stock market in crisis periods. Energy, 89: 365-371. https://doi.org/10.1016/j.energy.2015.05.121
[36] Mensah, L., Obi, P., Bokpin, G. (2017). Cointegration test of oil price and us dollar exchange rates for some oil dependent economies. Research in International Business and Finance, 42: 304-311. https://doi.org/10.1016/j.ribaf.2017.07.141
[37] Mensi, W., Sensoy, A., Vo, X.V., Kang, S.H. (2020). Impact of COVID-19 outbreak on asymmetric multifractality of gold and oil prices. Resources Policy, 69: 101829. https://doi.org/10.1016/j.resourpol.2020.101829
[38] Ajmi, A.N., Hammoudeh, S., Nguyen, D.K., Sarafrazi, S. (2014). How strong are the causal relationships between Islamic stock markets and conventional financial systems? Evidence from linear and nonlinear tests. Journal of International Financial Markets, Institutions and Money, 28: 213-227. https://doi.org/10.1016/j.intfin.2013.11.004
[39] Fayyad, A., Daly, K. (2011). The impact of oil price shocks on stock market returns: Comparing GCC countries with the UK and USA. Emerging Markets Review, 12(1): 61-78. https://doi.org/10.1016/j.ememar.2010.12.001
[40] Hassan, M.K., Rabbani, M.R., Abdulla, Y. (2021). Socioeconomic impact of COVID-19 in MENA region and the role of Islamic Finance. International Journal of Islamic Economics and Finance (IJIEF), 4(1): 51-78. https://doi.org/10.18196/ijief.v4i1.10466
[41] Raza Rabbani, M., Rahiman, H.U., Atif, M., Zulfikar, Z., Naseem, Y. (2021). The response of Islamic financial service to the COVID-19 pandemic: The open social innovation of the financial system. Journal of Open Innovation: Technology, Market, and Complexity, 7(1): 85. https://doi.org/10.3390/joitmc7010085
[42] Albulescu, C., Mina, M., Oros, C. (2021). Oil-US Stock Market Nexus: Some insights about the New Coronavirus Crisis. Economics Bulletin. https://dx.doi.org/10.2139/ssrn.3823203
[43] Sherif, M. (2020). The impact of coronavirus (COVID-19) outbreak on faith-based investments: An original analysis. Journal of Behavioral and Experimental Finance, 28: 100403. https://doi.org/10.1016/j.jbef.2020.100403
[44] Rabbani, M.R., Kayani, U., Bawazir, H., Hawldar, I.T. (2022). A commentary on emerging market banking sector spill over covid vs gfc pattern analysis. Heliyon, 8(3). https://doi.org/10.1016/j.heliyon.2022.e09074
[45] Rabbani, M.R. (2022). Fintech innovations, scope, challenges, and implications in Islamic Finance: A systematic analysis. International Journal Comput. Digit. Syst.
[46] Shaikh, S.P., Hassan, M.K., Atif, M., Rabbani, M.R. (2022). Do implied volatilities of stock and commodities markets affect bond, conventional and shariah indices differently? Evidence by OVX, GVZ and VIX. Eurasian Econ.
[47] Lei, L., Shang, Y., Chen, Y., Wei, Y. (2019). Does the financial crisis change the economic risk perception of crude oil traders? A MIDAS quantile regression approach. Finance Research Letters, 30: 341-351. https://doi.org/10.1016/j.frl.2018.10.016
[48] Sahu, T.N., Bandopadhyay, K., Mondal, D. (2014). An empirical study on the dynamic relationship between oil prices and Indian stock market. Managerial Finance.
[49] Karim, S., Akhtar, M.U., Tashfeen, R., Raza Rabbani, M., Rahman, A.A.A., AlAbbas, A. (2021). Sustainable banking regulations pre and during coronavirus outbreak: The moderating role of financial stability. Economic Research-Ekonomska Istraživanja, pp. 1-18. https://doi.org/10.1080/1331677X.2021.1993951
[50] Rabbani, M.R., Bashar, A., Nawaz, N., Karim, S., Ali, M.A.M., Rahiman, H.U., Alam, M. (2021). Exploring the role of Islamic fintech in combating the aftershocks of COVID-19: The open social innovation of the Islamic financial system. Journal of Open Innovation: Technology, Market, and Complexity, 7(2): 136. https://doi.org/10.3390/joitmc7020136
[51] Hassan, M.K., Rabbani, M.R., Ali, M.A.M. (2020). Challenges for the Islamic Finance and banking in post COVID era and the role of Fintech. Journal of Economic Cooperation & Development, 41(3): 93-116.
[52] Holtz-Eakin, D., Newey, W., Rosen, H.S. (1988). Estimating vector autoregressions with panel data. Econometrica: Journal of the Econometric Society, 5(6): 1371-1395. https://doi.org/10.2307/1913103
[53] Love, I., Zicchino, L. (2006). Financial development and dynamic investment behavior: Evidence from panel VAR. The Quarterly Review of Economics and Finance, 46(2): 190-210. https://doi.org/10.1016/j.qref.2005.11.007
[54] Abrigo, M.R., Love, I. (2016). Estimation of panel vector autoregression in Stata. The Stata Journal, 16(3): 778-804. https://doi.org/10.1177/1536867x1601600314
[55] Levin, A., Lin, C.F., Chu, C.S.J. (2002). Unit root tests in panel data: Asymptotic and finite-sample properties. Journal of Econometrics, 108(1): 1-24. https://doi.org/10.1016/S0304-4076(01)00098-7
[56] Salisu, A.A., Gupta, R., Bouri, E., Ji, Q. (2020). The role of global economic conditions in forecasting gold market volatility: Evidence from a GARCH-MIDAS approach. Research in International Business and Finance, 54: 101308. https://doi.org/10.1016/j.ribaf.2020.101308
[57] Salisu, A.A., Isah, K.O. (2017). Revisiting the oil price and stock market nexus: A nonlinear Panel ARDL approach. Economic Modelling, 66: 258-271. https://doi.org/10.1016/j.econmod.2017.07.010
[58] Wen, X., Bouri, E., Cheng, H. (2019). The Crude oil–stock market dependence and its determinants: Evidence from emerging economies. Emerging Markets Finance and Trade, 55(10): 2254-2274. https://doi.org/10.1080/1540496X.2018.1522247