Dian Anggraeny Rahim* | Dominicus Savio Priyarsono | Ernan Rustiadi | Yusman Syaukat
© 2022 IIETA. This article is published by IIETA and is licensed under the CC BY 4.0 license (http://creativecommons.org/licenses/by/4.0/).
OPEN ACCESS
The purpose of development in the border area of Kalimantan Corridor is not only physical, and infrastructure development, but the development must reduce poverty, regional disparities, economic disparities, increase income and improve people's welfare. This research was conducted in the border area of the Kalimantan Corridor, which has a direct border with Malaysia. This study had two objectives: the first was using Panel Data Regression, analyzing the program's effect on economic performance such as poverty, human development index, and community per capita income. It used secondary data in 2015-2019, covering education, health, agriculture, marine, road, and market programs. The result is that no program positively affects development performance except marine to poverty. The second is by using the Analytic Network Process (ANP) method, creating a sustainable development strategy towards the border area of Kalimantan Corridor. The respondents were BNPP bureaucrats and academics who understood development planning in the border area. The data used is sourced from Grand Design of Border Area Management 2014-2025, and the result is a sustainable development strategy in the border area of the Kalimantan Corridor. From in-depth interviews, the strategies in the border area to support economic performance are infrastructure, natural resources and human development.
borders, economic performance, strategy
The development of a region is not essentially a temporary interest but a long-term interest. Successful regional development was able to alleviate poverty, reduce the backwash economy and improve the community's welfare [1-3]. Not enough just that, there must be government intervention and strategy in its implementation [4-6]. Focused development strategies and policies will solve the development problems of a region [7, 8]. So is the construction of the border area. The paradigm shift from inward to outward-looking in border management is a breath of fresh air in border management, where the implementation is carried out through strategies made by the government involving the community [8]. There are some growth concepts aimed at the border area. First, it must have a close relationship with various economic activities. Second, it has a multiplier effect on its economic activities [9]. Third, it has a geographical concentration. Fourth, the border area must be a centre of growth to encourage the growth of the surrounding region.
One of the land border areas in Indonesia that border directly with Malaysia is the Kalimantan Corridor. This corridor consists of three provinces, namely West Kalimantan (four directly adjacent districts) - East Kalimantan (two directly adjacent districts), and North Kalimantan (two directly adjacent districts). Kalimantan Corridor has excellent economic potential, especially natural resources. Nevertheless, the economic condition of most areas in the border area is still lagging even if compared to non-border areas in the same province, especially compared to neighbouring countries [10, 11]. China has developed its border area by making the border a rich region [6, 12] and India through cultural programs [13].
Although it has great potential, the Kalimantan Corridor has low economic performance than non-border areas [10]. In 2015-2019, the border area of Kalimantan Corridor had an average percentage of the poor population of 6.63%, while non-border areas in the same corridor amounted to 5.78%. Regional inequality in the border area of Kalimantan Corridor averages 0.4%, at the same time, the non-border area is 0. 1%. The border area's gross domestic product per capita averages Rp 1,820,375/year, while the people in non-border areas Rp 2,622,982/year.
The government has rolled out some policies and programs to address the border problem. The government has also changed the paradigm of border area development, which impacts the construction of road infrastructure, bridges, increased development funds, and improved coordination between ministries and institutions. The goal is not solely the reason for the development of border areas but, in the long term ability to improve the welfare of the community through increased income, poverty reduction, and regional disparities. We start from Presidential Regulation number 12/2012 concerning establishing the National Border Management Agency (BNPP) as a border management agency. Then Government Regulation number 17/2007 on Changes in Direction and Development Policy in the Border Area. Government Regulation number 26/2007 on Spatial Arrangement of National Areas Covering Land-Sea-Air. The last is Presidential Regulation No. 3/2016 related to the Acceleration of National Strategic Projects in the Border Area.
After Nawacita, Indonesia's Border Management Agency (BNPP), as an institution given authority by the government to coordinate development activities in the border area, has coordinated a program of activities aimed at improving the welfare of the community. In fact, until 2019, there are about thirty laws related to the management of border areas in that area. However, there are still some problems facing border area in the Kalimantan Corridor, such as (1) low community income, (2) long distances from regional economic centres, (3) minimal infrastructure to the border area, (4) relatively high poverty, and low optimization of natural resources [10].
For this reason, it is necessary to analyze the influence of government programs running every year on economic performance in the Kalimantan Corridor. Then make strategies for the government so that economic performance increases and sustainable development in the Kalimantan Corridor is achieved.
The location of this study was conducted in the border area of the Kalimantan Corridor, consisting of West Kalimantan, East Kalimantan, and North Kalimantan. This study uses secondary data from 2015 to 2019, sourced from the Border Area Economic Development Roadmap, set by the government, where BNPP is the coordinator in implementing the program.
2.1 Panel data regression
The Panel Data Regression analysis tool is used to determine the effect of border area development programs on economic performance in the Kalimantan Corridor (Table 1). Panel data combines data between time series and cross-section data [14]. Advantages of using a panel data model compared to time series or cross-section data include (1) the number of observations becomes more significant, and (2) reduces identification problems [15]. The economic performance in this analysis is as follows:
Table 1. Economic performance of the border region
|
No |
Economic Performance |
Description |
|
1 |
Poverty |
Percentage of poor people in one district |
|
2 |
Human Development Index |
Human development index value |
|
3 |
Gross Domestic Product |
Gross regional domestic income based on constant prices in 2010 |
The six programs implemented each year are as follow in Table 2.
The model used is:
$\begin{aligned} \operatorname{LnPov}=\beta_{0}+& \beta_{1} \operatorname{LnE} d_{i t}+\beta_{2} \operatorname{LnHealth}_{i t}+\beta_{3} \operatorname{LnAgr_{it}} \\ &+\beta_{4} \operatorname{LnMar_{it}}+\beta_{5} \operatorname{LnRoad}_{i t} \\ &+\beta_{6} \operatorname{LnMarket}_{i t}+\varepsilon_{i t 1} \end{aligned}$
$\begin{aligned} \text { LnHDI }=\beta_{7}+& \beta_{8} \operatorname{LnEd}_{i t}+\beta_{9} \text { LnHealth }_{i t}+\beta_{10} \operatorname{LnAgr}_{i t} \\ &+\beta_{11} \text { LnMar }_{i t}+\text { LnRoad }_{i t} \\ &+\beta_{13} \text { LnMarket }_{i t}+\varepsilon_{i t 2} \end{aligned}$
$G D P=\beta_{14}+\beta_{15} \operatorname{LnEd}_{i t}+\beta_{16}$ Health $_{i t}+\beta_{17} \mathrm{Agr}_{i t}$
$+\beta_{18}$ Mar $_{i t}+\beta_{19}$ Road $_{i t}$
$+\beta_{20}$ Market $_{i t}+\varepsilon_{i t 3}$
Table 2. Development programs in the border area of kalimantan corridor
|
No. |
Programs |
Description |
|
1 |
Education |
The number of funds obtained by border districts in the field of education related to regional development |
|
2 |
Health |
The number of funds obtained by border districts in the field of health-related to regional development |
|
3 |
Agriculture |
The number of funds obtained by border districts in agriculture-related to regional development |
|
4 |
Marine |
The number of funds obtained by border districts in the marine field related to regional development |
|
5 |
Road |
The number of funds obtained by border districts in the field of roads related to regional development |
|
6 |
Market |
The number of funds obtained by border districts in the field of markets related to regional development |
Source: BNPP 2015-2019
2.2 Analytic Network Process (ANP)
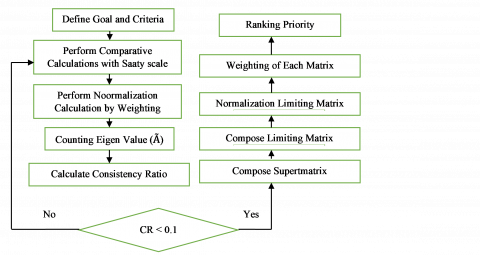
ANP is a decision-making analysis tool based on in-depth interviews conducted on a group of people (respondents) who are considered to know about the problem to be examined [16, 17]. This analysis consists of goal, criterias and alternatives (Figure 1). It also can assist in measuring and synthesizing several factors in a hierarchy or network that is quite diverse. At the same time, the direction of border area development strategy has several factors divided into objectives, criteria, and sub-criteria with various hierarchies and networks [18]. Some studies have used ANP to develop strategies [19-21]. Respondents to this study are planners and decision-makers related to developing border areas in the Kalimantan corridor from government agencies (BNPP) and academics. The interview was conducted through in-depth interviews to explore the needs, policies, and plans of the government related to the development of this region. The stages in an ANP analysis are as follows:
Figure 1. ANP analysis stage
In an ANP, a known consistency index (CI) is the consistency number that must be obtained to state the consistency of respondents when answering various questions. The recommended consistency value is 0 - 0.1. If it exceeds the above value, the respondent's answer is unacceptable and must be reconfirmed [22]. In addition, there is a rater agreement which is a measuring instrument that shows the level of agreement or approval of the answer. The rater agreement value is marked by Kendall's Coefficient of Concordance, which is between 0 and 1. The closer to 1, the rater agreement shows better results (Table 3). The main and is to get consistent numbers with the following:
$W_{i}=\sum_{i=1}^{n} a_{i j} / n$
Then calculate Eigen Value and Maximum Eigen Value.
$\lambda_{1}=\sum_{i=1}^{n} a_{i j} / W_{i}$
$\lambda_{\max }=\sum_{i=1}^{n}\left(a_{i j} / W_{i}\right) / n$
$C I=\frac{\lambda_{\max }-n}{n-1}$
where,
Wi = Weighting
aij /n = Row normalization matrix
n = Number of respondents
λ1 = Eigen Value
λmax = Eigen Value Max
CI = Consistency Index.
Kendall's Coefficient of Concordance uses equations:
$R_{i}=\sum_{i=1}^{n} r_{i j}$
Then:
$R=\frac{m(n+1)}{2}$
And:
$S=\sum_{1=1}^{n}\left(R_{i}-R\right)^{2}$
$W=\frac{12 \sum_{i=0}^{n}\quad d_{i}^{2}}{m^{2} n\left(n^{2}-1\right)}$
where
Ri = The aggregated ranking of criterion i
R = The mean of the Ri values
rij = The rank is given to criterion i by the evaluator group j
m = The number of rater groups rating n factors
S = A sum-of-squares statistic deviation over the row sums of ranking Ri
W = Kendall’s Coefficient of Concordance; 0≤ W≤ 1.
Table 3. Interpretation of agreement
|
Kendall’s Coefficient |
Interpretation |
|
0 |
No agreement |
|
0.1 |
Weak agreement |
|
0.3 |
Moderate agreement |
|
0.6 |
Strong agreement |
|
1 |
Perfect agreement |
3.1 The effect of government programs on poverty
One of the economic consequences in the border region is poverty. In general, poverty is when a person or group cannot get their basic needs such as food, clothing, shelter, education, and proper health. Because the government's economic policies determine the level of public welfare, poverty can also be caused by the failure of economic development planned by the government.
Table 4. The effect of government programs on poverty
|
Variable |
Coefficient |
Std Error |
t-Statistic |
Prob |
|
C |
1.499 |
0.447 |
3.352 |
0.004 |
|
Road |
-0.030 |
0.033 |
-0.913 |
0.375 |
|
Market |
0.024 |
0.033 |
0.719 |
0.483 |
|
Agriculture |
-0.059 |
0.061 |
0.972 |
0.347 |
|
Marine |
-0.082 |
0.023 |
3.590 |
0.003* |
|
Education |
-0.013 |
0.071 |
-0.183 |
0.857 |
|
Health |
0.009 |
0.044 |
0.221 |
0.827 |
|
R- Squared |
0.664 |
|||
|
Durbin-Watson stat |
1.292 |
|||
|
Prob(F-statistic) |
0.039 |
|||
Note: *=Significant 1 percent.
Source: Data processed, 2021
The results showed that the model's determination of 0.664 means that the diversity of independent variables can explain 64.4% of dependent variables (Table 4). In 2015-2019, in the border area of the Kalimantan Corridor, only one government program significantly affected poverty, namely the marine program. This means that for every increase of 1% in a marine program, poverty will decrease by 0.082%. Marine programs in this corridor include fisheries and aquaculture. The area of water in this region is almost close to the South China Sea, covering an area of 26,000 square km, 2,004,000 hectares of public waters, 26,700 hectares of farmed water, and 15,500 hectares of sea. Harvesting fisheries in the border region of this corridor reaches 1 million tons every year. Through this sector, people's incomes increase by an average of 15% annually. The massive increase in the marine sector started in 2014 since land reclamation from coal mining into a lake area for fisheries. This increase in income is undoubtedly directly able to reduce poverty in the border area of the Kalimantan Corridor and improve the community's welfare. In line with this, the local government is also getting serious about improving the community's welfare through the marine program.
Based on local government statistics, poverty at the border of the Kalimantan Corridor increases by 0.05% every year. In order to reduce poverty in the region, the government rolled out various programs. Nevertheless, the truth is that the program has not worked. Road infrastructure and markets have not shown significant results. Similarly, agriculture, education, and health for the community have also not shown significance. However, all these programs are expected to reduce poverty in the border area of the Kalimantan Corridor.
3.2 The effect of government programs on human development index
The human development index is one of the essential indicators to measure success to build people's quality of life. In addition, it is also a strategic instruction that can be used as a measure of government performance. The human development index is one of the allocators of general allocation funds determination. The human development index consists of three main components, namely health, education, and community purchasing power [23].
Table 5. The effect of government programs on human development index
|
Variable |
Coefficient |
Std Error |
t-Statistic |
Prob |
|
C |
4.337 |
0.044 |
98.789 |
0.0000 |
|
Road |
-0.007 |
0.004 |
-1.475 |
0.164 |
|
Market |
0.002 |
0.003 |
0.531 |
0.605 |
|
Agriculture |
0.003 |
0.006 |
0.645 |
0.530 |
|
Marine |
-0.002 |
0.002 |
-1.108 |
0.288 |
|
Education |
0.004 |
0.008 |
-0.526 |
0.608 |
|
Health |
0.008 |
0.005 |
-1.903 |
0.079 |
|
R- Squared |
0.484 |
|||
|
Durbin-Watson stat |
0.508 |
|||
|
Prob(F-statistic) |
0.3617 |
|||
Source: Data processed, 2021
The program that is carried out annually by the government through BNPP includes the three components above. Nevertheless, based on the study results, it is not seen that the program rolled out by the government has a significant influence on the human development index in the border area of Kalimantan Corridor. The three human development index-forming programs (education, health, agriculture, and market development) in this study are positive but not significant (Table 5). This condition occurs because some of these programs do not touch the community directly, plus the geographical conditions of the border area far from the regional economic centre make human development index-related programs ineffective. It is undoubtedly a concern for BNPP as a border manager. It is necessary to strengthen the human development index support program in the future.
3.3 The effect of government programs on gross domestic product
Another indicator in measuring the economic performance of the border region is Gross Domestic Product. Gross domestic product is the final consumption value of goods and services produced by economic sectors operating in domestic territories. The usage consists of components of household consumption, consumption of private for-profit institutions, government consumption, gross fixed capital formation, inventory changes, exports minus imports. Gross development product is one indicator of government performance in a region. The higher a region's gross domestic product indicates a successful economic performance [24].
Table 6. The effect of government programs on gross domestic product
|
Variable |
Coefficient |
Std Error |
t-Statistic |
Prob |
|
C |
22.905 |
3.597 |
6.368 |
0.000 |
|
Road |
0.079 |
0.259 |
0.308 |
0.763 |
|
Market |
0.258 |
0.250 |
-1.029 |
0.322 |
|
Agriculture |
0.422 |
0.468 |
-0.900 |
0.384 |
|
Marine |
-0.426 |
0.224 |
-1.897 |
0.080 |
|
Education |
0.193 |
0.536 |
0.359 |
0.725 |
|
Health |
-0.242 |
-0.691 |
-1.029 |
0.502 |
|
R- Squared |
0.562 |
|||
|
Durbin-Watson stat |
0.832 |
|||
|
Prob(F-statistic) |
0.191 |
|||
Source: Data processed, 2021
Governments work hard to raise people's gross domestic product through various programs and policies, but in 2015 - 2019 there has not been a significant influence from the program rolled out by BNPP (Table 6). Programs related to agriculture as the primary income for the community, in general, have no significant effect on the gross domestic product. Marine, road development, and markets expected as regional economic motors have not significantly influenced a gross domestic product in the border area. Education and health also have no significant effect on gross development products.
3.4 Border area development strategy for improving regional economic performance
There are three criteria for the development of border areas in order to accelerate economic growth and improve economic performance in the border region. Infrastructure development is the first order with physical development, economic infrastructure, electricity infrastructure, road infrastructure, and telecommunications. The second strategy is the development of natural resources with the program of agricultural, forestry, marine, and mining development. The third strategy is human development, emphasizing education and public health program (Table 7).
Table 7. Border area development criteria table
|
Development Criteria |
Points |
Sub Criteria |
Point |
|
Infrastructure |
0.456 |
Physical |
0.420 |
|
Economic |
0.333 |
||
|
Electric |
0.111 |
||
|
Transportation |
0.073 |
||
|
Telecommunication |
0.061 |
||
|
Natural Resource |
0.343 |
Agriculture |
0.570 |
|
Forestry |
0.189 |
||
|
Marine |
0.164 |
||
|
Mining |
0.075 |
||
|
Human Development |
0.201 |
Education |
0.621 |
|
Public health |
0.379 |
Source: Data Processed, 2021
3.4.1 Infrastructure development strategy
Infrastructure plays an essential role in the development of border areas. Massive infrastructure development can reduce regional disparities [25]. Infrastructure also contributes to the economic growth of 60%. When referring to the regional growth theory, resource endowment, and local economic development theory, infrastructure becomes necessary for the economic development of the border area of the Kalimantan Corridor [11].
The first infrastructure development strategy is physical infrastructure by constructing roads and bridges (0.420 points). Kalimantan Corridor has a long distance from the economic centre of the province, so the construction of roads and bridges becomes very important. In addition, the construction of roads and bridges facilitates the distribution of goods and services [26]. The availability of physical infrastructure is a crucial foundation in improving economic growth [26]. The second is economic infrastructure (0.333 points), especially markets, banks, and business cooperatives. To reduce economic lag in the border region, this institution is needed. So far in the border area market is available, but it is weekly, and people shop in neighbouring countries if the market is closed. The third is an electrical infrastructure (0.111 points). Electricity is a primary need at this time, so the electricity needs in the border region need to be met—the fourth island, sea, and air transportation (0.073 points). In line with road infrastructure development, land transportation is the primary interest that needs to be developed because it is necessary for the community. While marine and air infrastructure are also needed to shorten travel time, considering this area is far from the province. The fifth infrastructure, telecommunication (0.061 points), is also one of the community's needs in the border area, so it is worth developing. Telecommunications can reach challenging areas by vehicle.
3.4.2 Natural resource development strategy
The second strategy in border areas is the development of natural resources. All land border areas still make natural resources the primary income for their people. The potential of natural resources in the border region is enormous. This potential can be used as a comparative advantage. In the long term, it is expected to provide a multiplier effect for regional economic activities [27]. The economic improvement of this region will undoubtedly impact improving people's welfare and reducing poverty [28]. The first sector developed is the agricultural/plantation sector (0.570 points). 50% of the people in the border area of the Kalimantan Corridor depend on their lives from the agricultural sector. Agricultural such as rice and pepper become a source of community income. Indeed, this sector has not significantly contributed to the region's gross domestic product and poverty reduction because agriculture is still managed and not yet maximally. The second sector is the forestry sector (0.189 points). Kalimantan is famous for its forests. Forest products consisting of wood, rattan, and others are also a source of community income. The third sector is marine (0.164 points). Unexpectedly, the marine sector can have a significant influence on poverty reduction. It means that government programs in the marine field show the right target. The last development is the mining program (0.075 points). Mining in the border region of Kalimantan is generally of little value. Some mining is controlled by the private sector and does not positively affect the community directly because the mining sector provides taxes to local governments.
3.4.3 Human development strategy
Education (0.621 points) and public health program (0.379 points) are closely related to human resources development. This program is third in the border area development strategy [29]. Qualified humans by themselves can increase the human development index. The above results have not shown the success of government programs to increase the development index. It happens because the extent of the area is not proportional to the budget for the rolling program. Of course, it is an introductory note for the government that there is an increase in the budget.
3.4.4 Rater agreement
Rater agreement in this study has met the CI number ranges from 00.2 to 0.09. Kendall's Coefficient of Concordance is 0.739, which means there is a strong agreement from experts on the strategy made (Table 8).
Table 8. Rater agreement on kalimantan corridor area development strategy
|
Respondent |
CI |
W |
Interpretation |
|
Expert 1 |
0.02 – 0.08 |
0.739 |
Strong Agreement |
|
Expert 2 |
0.03 – 0.09 |
||
|
Expert 3 |
0.02 – 0.07 |
||
|
Expert 4 |
0.04 – 0.09 |
||
|
Expert 5 |
0.02 – 0.08 |
Source: Data Processed, 2021
The construction of the border area is an inevitability. As the gateway of the Republic of Indonesia, it is expected that the Kalimantan Corridor border will become an advanced area. This interest in reducing the backwash economy to other countries also reduces poverty and inequality. Development inequality in the Kalimantan Corridor is caused by three main factors: natural, social, and policy factors. Natural factors include the geographical location, natural resources, and distance of the region to the region's economic centre. Social factors include economic mobility, innovation, and entrepreneurship. In comparison, the policy factor is interpreted as a policy issued by the government through programs and activities that have not solved problems at the border of the Kalimantan Corridor.
Development on the border in Kalimantan Corridor empirically has not succeded to improve economic performance. Based on the government's six main programs through BNPP every year, only one program shows significant positive, namely marine. For the record, the sea area in the border area of Kalimantan Corridor is smaller than the land area, while the primary source of people's income comes from agriculture. However, the agricultural program itself does not significantly affect economic performance. Other programs that do not significantly influence education, health, road construction, and markets, even though the program is a supporting variable for developing border areas.
In the future, the government's strategy to improve economic performance in the Kalimantan corridor by putting forward three strategic criterias, the first strategy of infrastructure development prioritizes the development of physical infrastructure, economic infrastructure, electricity infrastructure, the construction of land, sea, and air transportation systems and the development of telecommunication infrastructure. The second strategy of natural resource development is centred on developing the agricultural sector, forestry sector, marine sector, and mining. The third strategy is the development of human resources through education and public health.
[1] Basta, C. (2015). From justice in planning toward planning for justice: A capability approach. Wagening. Univ. Res. Cent. Neth., 15(2): 190-212. https://doi.org/10.1177/1473095215571399
[2] Brunet-Jailly, E. (2004). Toward a model of border studies: What do we learn from the study of the Canadian‐American border? Journal of Borderlands Studies, 19(1): 1-12. https://doi.org/10.1080/08865655.2004.9695613
[3] Giroux, H.A. (2007). Border crossings: Cultural workers and the politics of education. Routledge. https://doi.org/10.4324/9780203956502
[4] Zhou, Z.J., Zhang, P.Y., Lu, M.M., Gao, Z. (2020). The influence of government intervention on the performance of independent innovation under financial support based on data of listed companies in strategic emerging industries. Math. Probl. Eng., 2020: 1-9. https://doi.org/10.1155/2020/5063986
[5] Lee, S., Ock, Y., Kim, M., Schrock, G. (2021). The regional uneven development and the state intervention to reshape the spatial hierarchy. International Journal of Regional Development, 8(2). https://doi.org/10.5296/ijrd.v8i2.18231
[6] Wu, C.T. (2001). Cross-border development in a changing world: Redefining regional development policies. Contributions in Economics and Economic History, 2: 21-38.
[7] Hayward, S. (1997). Strategies for regional development. Local Econ. J. Local Econ. Policy Unit, 11(4): 376-379. https://doi.org/10.1080/02690949708726356
[8] Rahim, D.A., Priyarsono, D.S., Rustiadi, E., Syaukat, Y. (2021). Analysis of development index of land border area through composite index construction. Mimb. J. Sos. Dan Pembang., 37(2): 130-141. https://doi.org/10.29313/mimbar.v37i2.7946
[9] Jesuit, D.K., Sych, L. (2012). Local economic development and cross‐border networks. International Journal of Public Sector Management, 25(6/7): 473-482. https://doi.org/10.1108/09513551211260667
[10] Johannes, A.W. (2019). Handling social problems in the sub-district of the border areas of Sanggau Regency. J. Sci. Gov. Voice Equat., 4(2): 50-61. https://doi.org/10.33701/jipsk.v4i2.763
[11] Prasetyo, B.A., Priyarsono, D.S., Mulatsih, S. (2013). Infrastructure, economic growth and inequality in Indonesia land borders. Economic Journal of Emerging Markets, 5(2): 99-108. https://doi.org/10.20885/ejem.vol5.iss2.art3
[12] Ying, L.G. (2008). China’s changing regional disparities during the reform period. Econ. Geogr., 75(1): 59-70. https://doi.org/10.1111/j.1944-8287.1999.tb00074.x
[13] Uttama, N.P. (2014). Investment promotion policy in potential border zone. Procedia Economics and Finance, 14: 615-623. https://doi.org/10.1016/S2212-5671(14)00750-3
[14] Agusalim, L., Karim, M., Yaddarabullah, Y. (2019). Indonesia cooperative and members welfare: A panel data analysis. Econ. Dev. Anal. J., 8(1): 9-21. https://doi.org/10.15294/edaj.v8i1.26830
[15] Blundell, R., Mátyás, L. (1992). Panel data analysis: An introductory overview. Structural Change and Economic Dynamics, 3(2): 291-299. https://doi.org/10.1016/0954-349X(92)90008-T
[16] Ozkaya, G., Erdin, C. (2020). Evaluation of smart and sustainable cities through a hybrid MCDM approach based on ANP and TOPSIS technique. Heliyon, 6(10): e05052. https://doi.org/10.1016/j.heliyon.2020.e05052
[17] Chukwuma, E.C., Okonkwo, C.C., Ojediran, J.O., Anizoba, D.C., Ubah, J.I., Nwachukwu, C.P. (2021). A GIS based flood vulnerability modelling of Anambra State using an integrated IVFRN-DEMATEL-ANP model. Heliyon, 7(9): e08048. https://doi.org/10.1016/j.heliyon.2021.e08048
[18] Saaty, T.L., Vargas, L.G. (2013). The analytic network process. international series in operations research & management science. Springer Sci. Media N. Y. https://doi.org/10.1007/978-1-4614-7279-7_1
[19] Fard, F.A., Nasiri, F. (2020). A bi-objective optimization approach for selection of passive energy alternatives in retrofit projects under cost uncertainty. Energy and Built Environment, 1(1): 77-86. https://doi.org/10.1016/j.enbenv.2019.11.005
[20] Promentilla, M.A.B., Aviso, K.B., Tan, R.R. (2014). A group fuzzy analytic network process to prioritize low carbon energy systems in the Philippines. Energy Procedia, 61: 808-811. https://doi.org/10.1016/j.egypro.2014.11.970
[21] Fauzey, I.H.M., Nateghi, F., Mohammadi, F., Ismail, F. (2015). Emergent occupational safety & health and environmental issues of demolition work: towards public environment. Procedia-Social and Behavioral Sciences, 168: 41-51. https://doi.org/10.1016/j.sbspro.2014.10.208
[22] Ozdemir, M.S. (2005). Validity and inconsistency in the analytic hierarchy process. Applied Mathematics and Computation, 161(3): 707-720. https://doi.org/10.1016/j.amc.2003.12.099
[23] Deb, S. (2015). The human development index and its methodological refinements. Social Change, 45(1): 131-136. https://doi.org/10.1177/0049085714561937
[24] Shrotryia, V.K., Singh, S.V.P. (2020). Measuring progress beyond GDP: A theoretical perspective. Emerging Economy Studies, 6(2): 143-165. https://doi.org/10.1177/2394901520983784
[25] Luu, H.N., Nguyen, N.M., Ho, H.H., Tien, D.N. (2019). Infrastructure and economic development in developing economies: New empirical evidence from night-time satellite imagery in Vietnam. International Journal of Social Economics, 46(4): 581-594. https://doi.org/10.1108/IJSE-05-2018-0252
[26] Chen, Y., Ji, W. (2021). Public demand urgency for equitable infrastructure restoration planning. International Journal of Disaster Risk Reduction, 64: 102510. https://doi.org/10.1016/j.ijdrr.2021.102510
[27] Hyman, E.L. (1984). Natural resource economics: Relevance in planning and management. Resources Policy, 10(3): 163-176. https://doi.org/10.1016/0301-4207(84)90031-X
[28] von Böventer, E. (1975). Regional growth theory. Urban Stud., 12(1): 1-29. https://doi.org/10.1080/00420987520080011
[29] Jašková, D., Havierniková, K. (2020). The human resources as an important factor of regional development. International Journal of Business and Society, 21(3): 1464-1478. https://doi.org/10.33736/ijbs.3364.2020