Muhammad Abi Berkah Nadi* | Nurfaizia | Meutia Nadia Karunia | Wimpie Agoeng Noegroho Aspar | Willy Barasa | Ahmad Fudholi
© 2022 IIETA. This article is published by IIETA and is licensed under the CC BY 4.0 license (http://creativecommons.org/licenses/by/4.0/).
OPEN ACCESS
Resonance could occur as a wave propagates through the soil resulting from seismic vulnerability activities. The resonance impact resulting from the local site effects may cause civil infrastructures failure such as railway bridge collapse. This study presented possibilities of the resonance in the BH77 railway bridge in Lampung, Indonesia. Characteristics of the site effect around the bridge were evaluated using microtremor data. Measurements were made at nine locations, with two points were on the bridge, and seven other points were scattered around the bridge. Microtremor data were analyzed using the Horizontal to Vertical Spectral Ratio (HVSR) method to find natural frequencies and amplification factors. Furthermore, the site effect around the bridge was analyzed using the natural frequency, the amplification factor, and the seismic vulnerability index (Kg) to have site effect characteristics. Results of the study indicated that the research area showed amplification factors (A0) ranging from 5.15 to 12.19. The site natural frequency obtained from the study was about 4.01-7.27 Hz. The seismic vulnerability index in the study area was 4.2-19.4. The obtained natural frequency (F0) on the bridge had a value between 5.20 and 6.19 Hz, and the natural frequency value at the site was 4.01-7.27 Hz, respectively. This phenomenon indicated that there would be a possibility of resonance on the railway bridge. It is interesting to note that this case study might be beneficial to practicing engineers and researchers.
amplification factors, micrometer data, natural frequency, railway bridges, seismic vulnerability index, spectral ratio, resonance
The growing times are always followed by the development of transportation, whether it is long-distance, medium, or only urban transit. Trains are one of the preferred modes of mass transportation because trains are orderly schedules, an adequate comfort level, and relatively low operating costs. Therefore, trains make as one of the preferred selected modes of transportation. However, the utilization of rail transportation must be accompanied by a convenient level of service, either railway facilities or the means of railway support (railroad infrastructure). As one of the railroad infrastructures, the railway bridge is one of the most vital components, so that the safety of the railway bridge is essential to be taken into account.
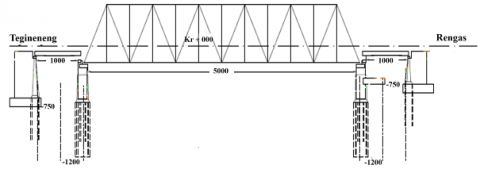
The BH77 railway bridge is one of the railway bridges under the management of the regional division (DIVRE) IV of Tanjung Karang, Lampung. Figure 1 represents a longitudinal concept of the railway bridge. The bridge condition is relatively old. The pattern of structures is almost identical to most railway bridges in Indonesia, making the BH77 railway bridge selected as the research object. In addition, this railway bridge has been subjected to gradual deterioration over time and is now structurally possible deficient. Rehabilitation and extension of the lives of this structure raise necessary maintenance and safety issues. One of the levels of service and safety factors that should be considered from this bridge is the possibility of resonance of this railway bridge. The resonance might occur due to airwaves, water, or wave propagation through the soil resulting from seismic vulnerability activities. In this research, the resonance impact resulting from the local site effects was studied and analyzed.
Figure 1. Sketch of the longitudinal BH77 railway bridge
In some earthquakes, the magnitude of the damage resulting from seismic activity covers the location distance with hypocentre, the magnitude, and site-effect geology. In some cases, earthquakes can even have a serious impact on areas far from the hypocentre, although with a small magnitude. This is due to local geological conditions (local site effect), such as the case of The Kebumen earthquake in 1943. In the Kebumen earthquake, the earthquake with a scale of 8.4 SR caused severe damage in Imogiri, Cawas, and Bantul, which those locations are far away from the hypocentre. In contrast, Kulon Progo, Purworejo, and Gunung Kidul, close to the source, do not cause fatality damage.
Damage resulting from local geological factors (site effect) can be characterized based on several factors, such as the natural frequency (F0), amplification (A0) as well as the index of Seismic Vulnerability (kg) obtained from micrometre data. Microtremor utilizes ambient vibration that spreads beneath the surface of the earth. The microtremor data can be analyzed by the Horizontal and Vertical Spectral Ratio (HVSR) method, which was proposed by Nakamura [1]. The HVSR method utilizes the ratio between the horizontal wave spectrum and the vertical waves on the surface, so the H/V curve is obtained. The H/V curve itself contains amplification information, as well as natural frequencies. Therefore, in this study, it is necessary to use microtremor data to analyze side effect magnitudes of vibration to the railway bridge.
Microtremor measurement is one method that can be used to know the characteristics of the soil (site effect) as well as the natural frequency of civil infrastructures. Microtremor is a wave that propagates on a sedimentary layer surface. The microtremor is a natural vibration generated by activity people, vehicle traffic, factory machinery, and earthquakes. In this study, the microtremor data were utilized to determine the characteristics of sediments and natural frequencies of the railway bridge using the HVSR method. Result findings of the research study showed that the study area indicated amplification factors (A0), the site natural frequency (F0) as well as the natural bridge frequency, and the potential seismic vulnerability index (Kg). Furthermore, there will be the phenomenon of a possibility of resonance on the railway bridge.
2.1 Related literature review
Characteristics of seismic tremor and micrometer data were reviewed. Dynamic characteristics of the surface layers were evaluated using a relatively new method proposed by Nakamura [1]. Microtremor studies that aim to determine how much the resonance frequency, seismic vulnerability level, and estimation of sediment layer thickness on seismic trajectories have been produced [2-4]. However, this technique has never been used to predict the resonance potential of a railway bridge.
Saputra et al. [5] performed an assessment of seismic vulnerability effects on residential buildings. The study used logistic regression and geographic information system (GIS) in order to understand the potential building damage probability. Micrometer measurement was done by means of a portable digital seismograph equipped with a velocity sensor consisting of horizontal and vertical components. Characteristics analysis of seismic vulnerability index was obtained. Earthquake distribution damage showed a parallel phenomenon to the existing fault lines [6].
Research on the possibility of the previous double resonance was performed [7-9]. The case of double resonance on the Salt and Silea bridges in Italy was indicated by comparing the value of the natural frequency of the bridges with the natural frequency of soil around the bridge using microtremor data. Furthermore, Grimaz et al. [8] found that the natural frequency of both bridges has a value that is almost the same as the natural frequency of the surrounding region. Therefore both bridges were potentially in double resonance condition. By considering the aforementioned, it is necessary to study micrometer data in relation to the resonance of railway bridges.
2.2 Data retrieval techniques
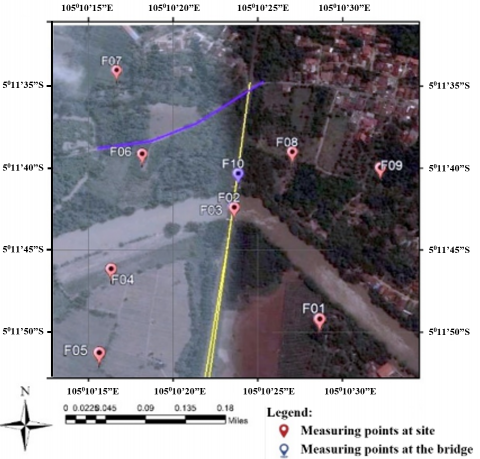
The data retrieval techniques used in this research are field measurement techniques using microtremor data. There were ten measuring points of micrometer stations, consisting of seven measurement points around the railway bridge and three other points on the railway bridge to find out the natural frequency of the railway bridge. Micrometer stations F02, F03, and F10 were placed right on the railway bridge. Micrometer stations F01, F04, F05, F06, F07, F08, and F09 were placed on the bridge surrounding area. The value of the natural frequency of the bridges will be compared with the natural frequency of soil around the bridge using microtremor data in order to understand the potential possibility of the double resonance and potential seismic vulnerability index (Kg). Figure 2 represents locations of the measurements at the railway bridge and surrounding area as the acquisition points in the field.
Figure 2. Proposed acquisition points in the field
The equipment used in the measurement is a set of three-component seis thermometers that includes vertical (up-down) components and two horizontal (north-south and east-west) components. The measuring duration of each point is about 40 minutes. From the measurement, the microtremor data was obtained in the form of zip format, subsequently converted into the suitable format using Geopsy software.
Furthermore, the obtained micrometer data were processed by the Horizontal to Vertical Spectral Ratio (HVSR) method using Geopsy software. HVSR itself is a method that uses the horizontal and vertical surface wave spectrum in a site to obtain quantitative data on the local geological information of the area. Nakamura [1] assumed that knowing the geological condition of an area is sufficient by measuring the wave spectrum on the surface. Because in the hard rock layer (bedrock), the ratio between the horizontal spectrum to the vertical spectrum is almost similar, or in the form of a mathematical equation and can be written in the following Eq. (1).
$\frac{S_{H B}}{S_{V B}}=1$ (1)
SHB is a horizontal spectrum, and SVB is a vertical spectrum; both are in hard rocks. Therefore, to know the local geological conditions, simply measuring the spectrum on the surface and Eq. (1) mathematically can be written in the following form of Eq. (2).
$T_{S I T E}=\frac{S_{H S}}{S_{V S}}$ (2)
The results of HVSR processing are H/V curves with amplification factors (A0) as a peak, while the peak frequency is the natural frequency (F0). The field measurement data are characterized based on these natural frequencies (F0), amplification factors (A0), and seismic vulnerability indexes (Kg). The microtremor data of the railway bridge are used only natural frequency data (F0) and to be compared to the data from around the railway bridge to know the possibility of double resonance.
3.1 Microtremor data
The results of this research are microtremor data. Subsequently, the microtremor data are processed using the HVSR method and plotted in the form of figures. During field observation, the micrometer at the F08 station did not transmit the natural frequency. Therefore, the processing of micrometer data at the F08 station could not proceed. Figure 3 shows the H/V ratio of the processing results. The H/V ratio curves are obtained from the data processing results using the Horizontal to Vertical Spectral Ratio (HVSR) method. It can be seen from Figure 3 that the peak H/V ratio curves measured at the railway bridge occurred at a frequency equal to 5 Hz. In comparison, the peak H/V ratio curves measured at the railway bridge surrounding occurred at a frequency not equal to 5 Hz. The peak H/V ratio curves measured in the western part of the railway bridge took place at a frequency of less than 5 Hz. In contrast to those, the peak H/V ratio curves measured in the eastern part of the railway bridge took place at a frequency of greater than 5 Hz. The average peak H/V ratio curves generated from Micrometer stations F03 and F09 range from 16 to 18.
Magnitudes of natural frequencies (F0), amplification factors (A0), and seismic vulnerability indexes (Kg) are tabulated and presented in Table 1. It can be seen from Table 1 that the highest natural frequency (F0) occurs at station F01 in which is located at the eastern part of the railway bridge. The lowest natural frequency (F0) occurs at station F05, located at the western part of the railway bridge. All micrometer stations in the western part of the railway bridge exhibit relatively lower natural frequencies (F0). The natural frequencies (F0) in the western part of the railway bridge ranges from 4.01 to 4.67 Hz.
All micrometer stations in the eastern part of the railway bridge exhibit relatively higher natural frequencies (F0). The natural frequencies (F0) in the eastern part of the railway bridge range from 5.95 to 7.27 Hz. All micrometers installed at the railway bridge exhibits moderately medium-high natural frequencies (F0). The natural frequencies (F0) at the railway bridge ranges from 5.03 to 6.19 Hz.
The highest amplification factor (A0) takes place at the micrometer station F06, and the lowest amplification factor (A0) occurs at the micrometer station F09. The amplification factors at station F06 and station F09 are 5.15 and 12.19, respectively. The highest seismic vulnerability index (Kg) is recorded from the micrometer station F09. The lowest seismic vulnerability index (Kg) is recorded from the micrometer station F01. Both micrometer stations, F01 and F09, were placed in a densely populated residential area.
Figure 3. H/V ratio curves of processing results
Table 1. Data processing results [10]
|
Station |
Easting |
Northing |
F0 (Hz) |
A0 |
Kg |
|
F01 |
519337.01 m E |
9425592.26 m S |
7.27 |
5.51 |
4.167374 |
|
F02 |
519194.20 m E |
9425793.43 m S |
5.03 |
5.17 |
5.307214 |
|
F03 |
519192.38 m E |
9425796.21 m S |
5.20 |
- |
- |
|
F04 |
518983.96 m E |
9425681.12 m S |
4.67 |
9.52 |
19.4394 |
|
F05 |
518974.06 m E |
9425537.42 m S |
4.01 |
6.38 |
10.15251 |
|
F06 |
519026.90 m E |
9425897.99 m S |
4.25 |
5.15 |
6.243899 |
|
F07 |
518969.88 m E |
9426074.43 m S |
4.22 |
6.32 |
9.458854 |
|
F09 |
519455.00 m E |
9425864.71 m S |
5.95 |
12.19 |
24.96109 |
|
F10 |
519201.59 m E |
9425858.31 m S |
6.19 |
- |
- |
3.2 Natural frequency (F0)
It is known that the natural frequency is the number of waves that propagate on a layer of each unit of time. The natural frequency of a region differs from other areas, depending on the geological conditions of the area. The natural frequency of a part plays an important role in the impact caused by earthquake activities. Areas with a low natural frequency tend to experience more extended earthquake shock periods, resulting in the more powerful effect of the resulted damage. Likewise, when a region has a high natural frequency, the shaking period felt in an area is smaller. Therefore, the resulting damage is also more minor.
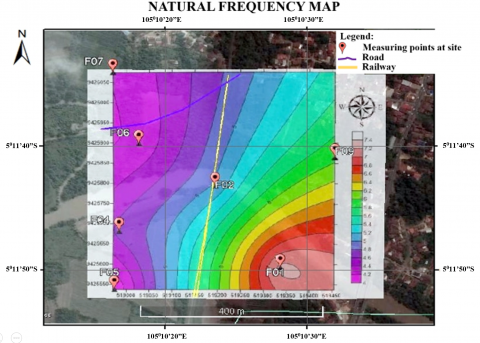
In addition to the natural frequency on-site, the natural frequency of a building is also essential to know. In a building with the same natural frequency as the natural frequency of the area around the building, the building will be very vulnerable to vibrations resulting from the vibration activities surrounding the building. The processing of microtremor data using the Horizontal to Vertical Spectral Ratio (HVSR) method, then a natural frequency value (F0) is plotted in the form of a map. Figure 4 shows a natural frequency distribution map of the research area.
Figure 4. Natural frequency distribution map of research area
It can be noticed from Figure 4 that the research area exhibits a natural frequency value (F0) ranging from 4.01 to 7.27 Hz. The natural frequency numbers are in the same range as the natural frequency numbers reported by Barasa et al. [10], which were generated from numerical simulations. Referring to the Kanai Classification [11] on the classification of natural frequency values, it can be concluded that the soil type in research location is included in the category of soil type II and I, respectively. Soil type II comprises thin alluvium consisting of sandy gravel, sandy hard clay loam, or clay (loam), while the soil type at the point F01 is included in classification type I. According to the Kanai classification [11], soil type I is a tertiary or older rock consisting of hard-pebble coarse sandstone.
It is understood that the natural frequency value (F0) is defined as the frequency value at the time of the maximum amplitude on the H/V curve. The value represents the geological condition of an area. The smaller the natural frequency value of the region, the greater the period perceived vibrations in the area, causing more significant damage resulting from seismic activity. The area that consists of a thick layer of primary sedimentary soil exhibits a natural frequency value that tends to be lower than the area with thin sediment. In summary, it can be concluded that the thicker layers of sediment area, the smaller the value of the natural frequency, therefore the more significant the damage generated due to seismic activity.
Based on the map of Figure 4, it is known that the research area consists of a natural frequency value (F0) that tends to be uniform, i.e., in the range of 4-5 Hz, however at one point of study in the F01 area indicates a higher natural frequency value, i.e., 7.27 Hz. The magnitude of the values can be caused by differences in geological conditions and sediment thickness in the area. It is likely to be thinner than other research points. Based on the data processing results, it can also be noted that the magnitude of the values of natural frequency in the region formed a pattern. The pattern follows the size of natural frequency changes. The size of the frequency tends to decline from east to west. It is interpreted as a result of the thickness difference of sediment that tends to increase from east to west.
3.3 Amplification factors (A0)
Amplification is defined as the wave amplitude enlargement that occurs due to differences in properties between layers. In other words, seismic waves propagate into hard rock (bedrock) will experience magnification when meeting with layers (sediment). Amplification occurs when a wave propagating in a medium meets another medium that is softer than the previous medium. The more contrast between the two layers, the more amplification that occurs will also be more significant.
In this study, the amplification factor (A0) was obtained from the peak of the HVSR curves from the microtremor data obtained via field measurements. The HVSR method utilizes the microtremor data's horizontal and vertical spectrum ratios to get the natural frequency values (F0) and the amplification factors (A0). The amplification factors in HVSR were obtained from the maximum amplitude of the vertical axis of the H/V curves. Subsequently, the amplification factors were plotted in the form of a map. Figure 5 illustrates an amplification factor distribution map of the research area.
Figure 5. Amplification factor distribution map of research area
Figure 5 indicates that the amplification factor at the research site ranges from 5.15 to 12.19. The value of the amplification factors of the research area is more than 5. This value is similar to the value of the amplification factors for the Liwa area, as reported by Arifin et al. [12]. It can also be seen that the value of the amplification factors in the area tends to be lower in the middle area, namely at the point of F01, F02, and F06. These values do not correlate with the magnitude of natural frequency values (F0). The amplification factor is influenced by the velocity of the wave propagating beneath the surface. The speed of amplification factors tends to get bigger with the rapid diminishing of waves beneath the surface. The density of rocks influences the speed of the wave propagating below the surface itself in a region. Soft soils tend to slow down wave propagation beneath the surface of the earth. Therefore, the larger the damage is generated, as is the opposite. Thus, the magnitude of the amplification of an area can be associated with how soft the soil is in an area is, which eventually causes the greater shaking that a region feels due to seismic activity.
The amplification factors (A0) are tabulated and presented in Table 2. The classification of the amplification factors (A0) followed the classification suggested by Setiawan [13] from his study.
Table 2. Classification of research location based on amplification factors [13]
|
Zone |
Classification |
Amplification |
Location |
|
1 |
Low |
A<3 |
- |
|
2 |
Medium |
3≤A <6 |
F01, F02, F06 |
|
3 |
High |
6≤A <9 |
F05, F07 |
|
4 |
Very High |
≥9 |
F04, F09 |
Based on the classification of Table 2, it can be noted that the research area is categorized as medium to very high amplification values. Locations of F04 and F09 exhibit very high amplification factors, while areas with high amplification are at the area of F05 and F07. Meanwhile, the medium amplification factor is at the site of F01, F02, and F06. The difference in amplification value indicates that amplification in a region may vary depending on the soil condition and history of weathering in the area. It can be noticed that the medium amplification factor is located in between very high amplification factor zones.
3.4 Seismic vulnerability index (Kg)
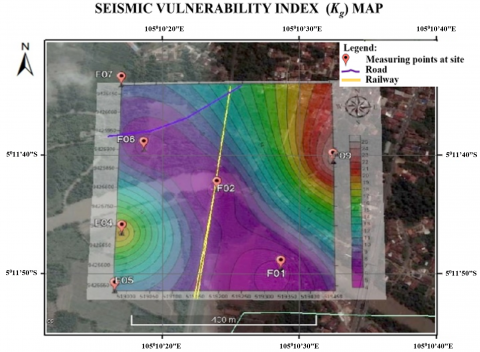
The seismic vulnerability index value (Kg) is a magnitude used to determine the risk of damage caused by seismic activity. The seismic vulnerability index is influenced by the amplification factor and natural frequency of an area. The greater the seismic vulnerability index of an area, the more significant the impact of damage occurring in the area. The smaller the index of the seismic vulnerability of an area. Therefore, the damage resulting from the seismic activity will also be more minor. The value of the seismic vulnerability index is proportional to the amplification factor and is inversely proportional to the natural frequency. The conducted research shows various values of the seismic vulnerability index. The seismic vulnerability index is plotted in the form of a map. Figure 6 shows a seismic vulnerability index distribution map of the research area.
It can be seen from Figure 6 that the seismic vulnerability index values tend to be lower in the middle. The index value of the seismic vulnerability is directly proportional to the amplification factor and in contrast to the natural frequency. Therefore, it can be concluded that the smaller the natural frequency of the region, the more vulnerable index in the area. This area is subjected to potential damage by seismic activity. Conversely, the greater the amplification of an area, the more significant damage in the area due to seismic activity. This study shows that the index value of the seismic vulnerability (Kg) ranges from 4.2 to 19.4. It relates to the magnitude of the amplification factor and the natural frequency of an area.
Figure 6. Seismic vulnerability index distribution map of research area
3.5 Double resonance
In this research, the natural frequency on the railway bridge and on-site around the bridge was measured using the microtremor. The microtremor data were processed using the Horizontal to Vertical Spektral Ratio (HVSR) method so that the H/V curves were obtained. Natural frequency values obtained from the H/V curves were then compared with the natural frequency results of spectrum analysis to know the natural frequency of the horizontal spectrum. Comparison values of natural frequencies obtained at the railway and the site around the railway bridge are presented in Table 3.
Based on the microtremor data, it can be noted that the natural frequency of the railway bridge tends to be the same as that of the surrounding environment, which is at a range of 5.2-6.2 Hz, while the surrounding area exhibits a natural frequency of 4.0-7.2 Hz. However, according to the HVSR microtremor study performed by Gosar [14], the natural frequency of this structure is dominated by horizontal components.
Table 3. Natural frequency comparison on the bridge to the site around the bridge
|
Location |
F0 (Hz) |
F0 (Hz) Longitu-dinal |
F0 (Hz) Transvers- al |
F0 (Hz) Site |
Resonance |
|
Bridge S |
5.2 |
4.7 |
4.6 |
4.0-7.2 |
v |
|
Bridge N |
6.2 |
4.6 |
3.1 |
Billah and Scanian [15] mentioned that double resonance could occur when the natural frequency in a building structure exhibits a similarity of ± 1 Hz with the natural frequency of the surrounding environment. Therefore, it can be concluded that the railway bridge BH77 would potentially exhibit double resonances.
Based on the current study, it can be summarized that the research area around the railway bridge BH77 exhibits a natural frequency value (F0) of 4.01-7.27 Hz, while the railway bridge BH77 exhibits a natural frequency value of 5.20-6.19 Hz. The value of amplification factor (A0) in the research area ranges from 5.15 to 12,19. Therefore, Survey of the current geometric data from the bridge or flyover structure is important for structural analysis and maintenance decision. by Nadi et al. [16]. The value of natural frequency in the research area is in the range of 4.01-7.27 Hz. According to the Classification of Kanai [11], the soils are in the classification of type I and II, namely have a layer of sediment consisting of thin alluvium with a thickness of thinner than 10 meters, and tertiary or older rocks composed of harsh, hard-gravel sandstone rocks. The value of the seismic vulnerability index (Kg) of the research area ranges from 4.2 to 19.4, where the seismic vulnerability index tends to be lower in the middle area of the research area.
Based on microtremor data, it is known that the comparison of natural frequency values (F0) BH77 for railway bridge and those values for the surrounding site both have a natural frequency value that is almost the same. This condition would potentially exhibit double resonances. However, it is necessary to validate with other methods because measurements are not possible in the mass center of bridges caused by extreme terrain obstructed.
This paper is part of the national research priority of railways performed at ITERA and the Research Center of Technology for Transportation System and Infrastructure (PR TSPT) - National Research and Innovation Agency (BRIN), Indonesia. The study can be conducted with support from OR TSPT - BRIN and ITERA via LPDP grants. Without financial support from those agencies, this study would have been impossible. The authors would like to express their gratitude for the financial support received from the institutions. The authors would also like to thank the reviewers who actively provided constructive suggestions.
|
A0 |
amplification factors, dimensionless |
|
F0 |
natural frequencies, Hz |
|
Kg |
Seismic vulnerability index, dimensionless |
|
mE |
east |
|
mS |
south |
|
SHB |
a horizontal spectrum, dimensionless |
|
SVB |
a vertical spectrum, dimensionless |
|
$T_{\text {SITE }}$ |
transfer function at a site, dimensionless |
[1] Nakamura. (1989). A method for dynamic characteristics estimation of subsurface using microtremor on the ground surface. Japan: Quarterly Report of Railway Technical Research Institute (RTRI), 30(1): 25-33. http://worldcat.org/oclc/3127232
[2] Syahruddin, M.H., Aswad, S., Palullungan, E.F., Syamsuddin, M. (2014). Determination of the sediment thickness profile of the Makassar city trajectory with microtremor. Jurnal Fisika, 4(1): 17-25. https://doi.org/10.15294/jf.v4i1.3861
[3] Setiawan, B., Jaksa, M., Griffith, M., Love, D., (2018). Estimating bedrock depth in the case of regolith sites using ambient noise analysis. Engineering Geology, 243: 145-159. https://doi.org/10.1016/j.enggeo.2018.06.022
[4] Ipmawan, V.L., Permanasari, I.N.P., Siregar, R.N. (2019). Determining soft layer thickness using ambient seismic noise record analysis in Kota Baru, South Lampung. Makara Journal of Science, 23(1): 39-43. https://doi.org/10.7454/mss.v23i1.10802
[5] Saputra, A., Rahardianto, T., Revindo, M.D., Delikostidis, I., Hadmoko, D.S., Sartohadi, J., Gomez, C. (2017). Seismic vulnerability assessment of residential buildings using logistic regression and geographic information system (GIS) in Pleret Sub District (Yogyakarta, Indonesia). Geoenvironmental Disasters, 4(11): 1-33. https://doi.org/10.1186/s40677-017-0075-z
[6] Daryono, Sutikno, Sartohadi, J., Dulbahri, Brotopuspito, K.S. (2009). Assessment of local site effects in the Bantul graben using a seismic vulnerability index based on micrometer measurements. Jurnal Kebencanaan Indonesia, 2(1): 456-467.
[7] Yau, J.D. (2001). Resonance of continuous bridges due to high-speed trains. Journal of Marine Science and Technology, 9(1): 14-20. https://doi.org/10.51400/2709-6998.2430
[8] Grimaz, S., Malisan, P., Barazza, F., Carniel, R. (2013). Rapid instrumental check of vulnerability parameters on bridges for seismic risk mitigation purposes. Bollettino di Geofisica Teorica ed Applicata, 54(3): 205-215. https://doi.org/10.4430/bgta0076
[9] Ribes-Llario, F., Zamorano-Martín, C., Morales-Ivorra, S., Real-Herráiz, J. (2016). Study of vibrations in a short-span bridge under resonance conditions. Journal of Vibroengineering, 18(5): 3186-3196. https://doi.org/10.21595/jve.2016.16531
[10] Barasa, W., Aspar, W.A.N., Purnomo, D.A., Nadi, M.A.B., Fiantika, T., Primadiyanti, S.P. (2022). Assessment of an existing steel railway bridge structure. Presented at the Sriwijaya Int. Conf. on Eng. and Tech. 2021 (2021 SICETO 25-26 Oct.), to be published in AIP Proceeding Publication LLC, Melville, NY., USA.
[11] Kanai, K. (1983). Engineering Seismology. University of Tokyo Press, Tokyo, Japan. https://doi.org/10.1002/eqe.4290110511
[12] Arifin, S.S., Mulyanto, B.S., Marjiyono, Setianegara, R. (2014). Determination of zones prone to earthquake shocks based on analysis of the microtremor HVSR amplification value and analysis of the dominant period in the Liwa area and its surroundings. Jurnal Geofisika Ekxplorasi, 2(1): 30-40. http://dx.doi.org/10.23960/jge.v2i01.217
[13] Setiawan, J.R. (2009). Seismicity microzonation of Yogyakarta and surrounding areas. Thesis, Bandung Institute of Technology, Bandung. https://docplayer.info/63817049-Mikrozonasi-seismisitas-daerah-yogyakarta-dan-sekitarnya-tesis-jb-januar-herry-setiawan-nim.html.
[14] Gosar, A. (2007). Microtremor HVSR study for assessing site effects in the Bovec Basin (NW Slovenia) related to 1998 Mw5.6 and 2004 Mw5.2 Earthquakes. Engineering Geology, 91: 178-193. http://dx.doi.org/10.1016/J.ENGGEO.2007.01.008
[15] Billah, K.Y., Scania, R.H. (1991). Resonance, Tacoma narrows bridge failure, and undergraduate physics textbooks. American J. of Phys., 59(2): 118-124. https://doi.org/10.1119/1.16590
[16] Nadi, M.A.B., Fauzan, S.A. (2019). Analysis image-based automated 3D crack detection for post-disaster bridge assessment in flyover mall Boemi Kedaton. Journal of Science and Applicative Technology, 2(1): 2581-0545. https://doi.org/10.35472/281449