Ahmed M.S. Mohammed* | Tetsuya Ukai
© 2021 IIETA. This article is published by IIETA and is licensed under the CC BY 4.0 license (http://creativecommons.org/licenses/by/4.0/).
OPEN ACCESS
University campuses play a significant role in city transformation to the extent that depends on campuses’ openness and location. Therefore, open campuses provide various sets of values to city urbanization different from gated ones. Thus, this study provides a comparative syntactic and socio-spatial analysis between a gated campus and an open one in two different urban settings using space syntax methodology and cell statistical analysis to highlight the impact of campus’s openness and location on city’s urban growth. Case studies were chosen from Kyushu University to compare between Ohashi campus and Ito campus. Both campuses and a surrounding buffer area of 5 km radius have been analysed using angular segment analysis to examine campuses’ integration and accessibility. Furthermore, socio-economic data were adapted with syntactic analysis results to show the potential effects of campuses on their surrounding socio-spatial temporal change from 2008 till 2017. Results have shown that Ito campus has the potentials to contribute to the urban growth of Fukuoka city more than Ohashi campus. However, Ito campus’s accessibility limitations have shown to hinder its impact on city’s transformation due to its far location unlike Ohashi campus. Therefore, campus’s openness and location could promote or hinder city urbanization in intentional or ingenuous ways.
urbanization, space syntax, socio-spatial analysis, open campus, gated campus
In order to have a better understanding of the physical relation between the campus and the city, the term ‘campus’ need to be clarified and redefined in the context of its respective city. At universities, the word ‘campus’ usually refers to the place or the location where university different activities take place. However, in the context of the city, ‘campus’ refers to the isolated urban setting (sometimes gated) where different sets of activities that belong to a specific community take place. Therefore, university campus is usually defined as the sum of locations with university-related functions that could be located outside the city, gated within the city, or integrated with it [1]. Moreover, campus-city physical relationship could be defined topologically in a set of five different relationships; as the campus could equal, disjoint, touch, contain or overlap the city. Some campuses may have one or two physical relationships with the city which could be considered as campuses in transition [2]. Campuses in transition have more than one physical relationship with the city due to constant spatial transformation resulted from city urbanization [3]. Therefore, campuses and their respective cities exist in a dynamic connection that could change and evolve over time to the extent that depends on the openness of the campus and its location according to the city.
Furthermore, functional relationship between the campus and the city depends mainly on how far the campus is located from the city. Although recent campus development trends show that universities become dependent on the presence of non-academic types of spaces, the cost of development will be more expensive if associated advantages of campus-city relations are neglected [4]. Therefore, universities need to make the most use of their campuses’ location to benefit from cities’ functional services and amenities. As cities and universities could provide various types of functions (such as retail and leisure services, residential services, infrastructure amenities, academic services, and related businesses) that could benefit both [5]. Thus, the greater the distance between the campus and the city, the more complex the relation becomes, physically and functionally. Therefore, the more integrated and accessible the campus is, the more possibilities to share functions with the city [6]. As a result, higher degrees of dependence of universities are usually accompanied with higher cost competing with resources for research and education. Accordingly, decision makers should consider which type of campus model to be adopted according to city’s context and urban growth; as universities are considered to be socially and culturally active physical places, which means that, besides their spatial component, they are in charge of the social and cultural awareness of the city located in Ref. [7, 8].
Recently, many universities have sought to engage with the city to seek for a more resilient, healthier, and productive urban landscape. These urban campuses influence their surrounding neighbourhoods by mixing diverse disciplines and practices with academics. By adopting such an urban campus model, the public would be put forward by its presence and voice which in turn results in a campus that is dynamically engaged with its city [9]. Therefore, universities end up being as attractors for knowledge workers as well as real estate developers and agents for urban change [10, 11]. Moreover, University students’ engagement with the city unleash cities’ potentials for a safer environment and better social welfare [12, 13]. Therefore, university engagement with its surrounding communities needs to be physical and functional; that requires the urban campus to be open with free borders. Unlike gated campuses that are dependent on their own or as known as autonomous self-sufficient campuses [14]. Campus’s openness is deeply connected with its publicness and relation to the public realm which can be clearly seen in types of informal encounters [15], social vitality [16], and communication and discussion that occur in campus’s surroundings [17]. Therefore, the difference between gated and open campuses goes way beyond the fence around the borders, but it is much deeper and more interconnected with city’s urbanization and growth, both physically and functionally. Additionally, in order to understand their impact on the city, campuses need also to be seen through the impact that students bring to the area.
1.1. Literature review
1.1.1 Campus-city relationship
Research has shown different aspects of campus-city relationship including safety and security, spatial configuration, transportation modes, residential patterns and smartness and greenness. Each one of those aspects plays its role in the relation between the campus and its city that could benefit or detriment both. Although campuses may help in city’s revitalization, they could be considered as hot spots for crimes. Research on the proximity to university campuses and crime rates has shown that areas around campuses are known for burglary and robbery incidents. Offenders usually seek for areas with high traffic of victims and campuses are known for their high presence of people. Therefore, neighbourhoods surrounding campuses may face numerous challenges on how to maintain safety and security [18, 19]. On the other hand, campuses are considered safer compared to their surroundings; as university administration tend to provide lots of safety procedures for their students and staff [20, 21]. Moreover, campus-city relationship goes beyond safety and security to include transportation modes in the city as the city need to provide the required capacity to transport students and staff. Therefore, public transit has shown to be the preferable mode of transportation between student [22]. However, biking and walking are considered better for the city as it encourages students to interact with the surrounding environment which could be reflected on local economies and students’ lifestyles [23, 24].
Furthermore, campuses’ location according to the city affects students’ housing preferences which in turn affects residential patterns in the city. Universities are usually accompanied with high demand of accommodation that couldn’t be covered in most cases by the institution alone. Thus, real estate companies and private sector benefit from housing demand which result in neighbourhoods near to campuses with high concentrations of students as known as ‘student areas’. These areas are usually preferred by students due to the availability of facilities and amenities that benefit them [25, 26]. However, student areas are also known for their downsides such as noise, vandalism or drunk students walking late at night which affects the neighbourhood image and milieu [27]. On the other hand, campuses have shown to be seeds for smartness and innovation in cities. Research has proven that smart cities concept could be achieved by starting from building level to campus level then to city level; and university campuses could help in making that possible [28-30]. This shows how deep connected the relation between campuses and cities is. However, this relation couldn’t be maintained unless there are strong physical relation between the campus and its surroundings. Therefore, this paper tries to reveal the impact of campus openness and location on the city which would open the door for an enriching connection between universities and cities.
1.1.2 Studentification and the city
Due to the influx of post-secondary students who belong to colleges and universities, a gentrification process occurs in the city which is usually referred as ‘studentification’. Studentification process is considered as another form of campus’s impact on the city [31]. Studentification can be seen through its social, economic, cultural, and physical impact on the city. Studentification’s social impact on the city can be seen through what’s known as seasonal immigration which occurs as a result of students moving in and out of the city. This leads to the displacement of long-term residents to another area of the city where studentification didn’t take place yet [32]. Another social impact could be noticed from the change that happens in the area due to large numbers of students as students are known to live in downgraded lower-cost neighbourhoods seeking for lower rent [33]. Moreover, studentification could also be seen through the economic situation in the area where students exist. Students could impact local economies positively or negatively depending on where studentification occurs. For example, unlike western world, research has shown that studentification occurs in China helped villagers to improve their livelihood and spacious housing demand without any displacement [34]. However, in western world, research has shown that studentification corrupts public spaces affecting local economies in negative ways [35]. Furthermore, Cultural effects brought by studentification could be seen through the change happening in the neighbourhood due to the displacement of original residents or by the diverse cultures brought by foreign students [36]. However, the extent to which the cultural diversity in the neighbourhood occurs based on studentification much depends on the physical aspects of the environment and the location of the campus according to its city. Therefore, the social, economic, or cultural impact brough by studentification could be considered as a by-product of campus-city physical relationship [33, 37, 38].
1.2 Research positioning
Previous literature has shown various after-effects result from university campuses and their functional and physical connections to the city. Research trends tend to focus more on the social or economic part of the problem. However, factors that affect campus-city physical relationship have been moderately discussed in previous research. Therefore, this study tries to explore the impact of campus openness and location on city’s transformation. It also tries to highlight the effect of universities on their cities and how cities respond in return. Moreover, cities have shown to transform in a natural way as known as ‘The natural urban transformation process’ [39]. Therefore, this paper tries also to position the role of university campuses in the urban transformation process. This paper investigates campus-city physical relationship by conducting a comparative syntactic and socio-spatial analysis between two campuses of Kyushu University (Ito campus and Ohashi campus) to explore the different impact of gated and open campuses on their suburban or urban surroundings.
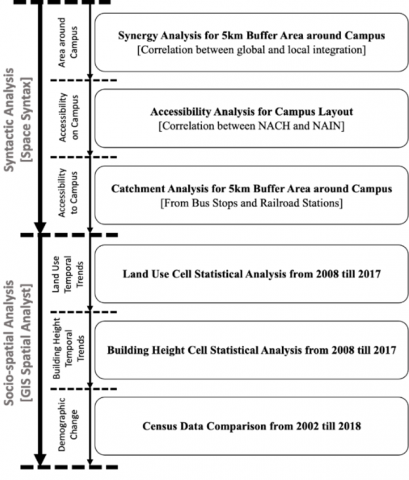
In order to assess the impact of university campuses on the city, different syntactic and statistical measures have been applied to have a holistic view of the impact of university campuses on the city. Table 1 shows detailed information about materials and methods used in this study.
2.1 Study area
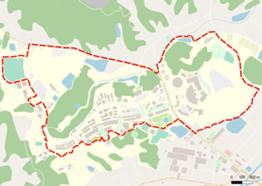
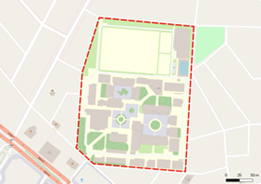
Ito and Ohashi campuses were selected from Kyushu University which is a public university located in Fukuoka City in the southwest of Japan. Ohashi campus is a gated campus for Graduate School of Design at Kyushu University. Ito campus is an open urban campus that contains nine different schools of Kyushu University. Unlike Ohashi campus, Ito campus is located in the outskirts of Fukuoka City in a countryside like area away from urbanized settlements (Table 2). Ito campus is considered a relatively new campus compared to Ohashi campus, as the first school, out of nine schools, built in Ito campus was the Engineering School in 2005. Ito campus was built as a large new campus to replace Hakozaki Campus which is the old campus of Kyushu University. On the other hand, Ohashi campus was established in 1968 as Kyushu Institute of Design and then it was merged with Kyushu University in 2003.
2.2 Syntactic analysis
Ito and Ohashi campuses were analysed using space syntax methodology to examine their spatial configuration and relation to city’s network [40]. Space syntax method has been established at University College of London in the Bartlett School of Architecture. It consists of analytical techniques that has been developed over years of research based on the theories founded by Bill Hillier [40, 41]. Space syntax methodology illustrates the relation between the social structure of the space and its spatial configuration, as spatial configuration is one of the factors that define the interaction and encounters of people in spaces [42]. Therefore, the more integrated the space, the more interaction between people occurs [41]. In order to represent the space to be analysed in a syntactic way, axial lines are drawn to represent the longest and fewest lines which users can see or move. Then, these lines are broken down into sets of perceivable observations or segments to be analysed [43].
Table 1. Materials and methods
|
Method |
Platform |
Processed Data |
|||
|
Data Type |
Data Collection Time |
Data Source |
Data Delivery |
||
|
Syntactic Analysis |
Space Syntax Toolkit (QGIS) |
Street network for 5km radius buffer area around Ito campus |
August 2021 |
Open Street Map |
Drawn manually |
|
Street network for 5km radius buffer area around Ohashi campus |
|||||
|
Ito campus layout |
|||||
|
Ohashi campus layout |
|||||
|
Bus Stations Location in 5km radius buffer area around Ito and Ohashi campuses |
June 2017 |
Japanese National Land Survey Database |
Downloaded |
||
|
Railroad Stations Location in 5km radius buffer area around Ito and Ohashi campuses |
December 2015 |
||||
|
Socio-spatial Analysis |
Spatial Analyst Tools (ArcGIS) |
Land use Data of Fukuoka City |
2008, 2012 and 2017 |
Fukuoka City Urban Affairs Bureau |
Provided by an official request |
|
Building Height Data of Fukuoka City |
|||||
|
Demographic Analysis |
Microsoft Excel |
Census Data |
From 2002 to 2018 |
Fukuoka City Open Database |
Downloaded |
Table 2. Comparison between Ito and Ohashi campuses
|
Info. |
Ito Campus |
Ohashi Campus |
|
Campus Model |
Open Campus |
Gated Campus |
|
Location |
Nishi Ward |
Minami Ward |
|
Area |
2,717,130 m2 |
63,058 m2 |
|
No. of Schools |
9 |
1 |
|
Campus Layout |
- - - Campus Borders |
- - - Campus Borders |
Different syntactic measures could be extracted from the angular segment analysis such as integration and choice. Integration is a to-movement potential that could represent the presence of people based on the activity potentiality in the space [44]. Integration can also be divided into two main measures: global integration and local integration. Global integration is measured all over the system. However, local integration is the integration measured in a specific area of the system. The correlation between global and local integration is known as synergy which shows that the system is well integrated on macro and micro scale; and it’s easier to get from one space to another without spatial interference or visual congestion [45]. On the other hand, choice is a representation of through-movement potential which could show the presence of people based on movement potentiality in the space [46]. The correlation between integration and choice represent accessibility which means that spaces that are likely to be desired distention have also higher movement potentiality. Moreover, Normalised Angular Integration (NAIN) and Normalised Angular Choice (NACH) are two other syntactic measures that normalise previously mentioned integration and choice to be able to compare two different systems or urban settings to provide a better understanding of how different systems work [47].
For syntactic analysis, Ito campus and Ohashi campus have been analysed using Space Syntax Toolkit (SST) in Quantum Geographical Information System (QGIS) Software. Campuses layout and surrounding buffer area of 5km radius were analysed to provide a comparison between both campuses and their surroundings to understand the spatial configuration of each campus and how it relates to the surrounding network. In order to avoid the edge effect and provide more accurate results [48], a circle of 5km radius were taken as the campus in the centre of it. Analysed systems were drawn using QGIS and street networks from Open Street Map (OSM). First, axial lines were drawn for areas of the study then converted to segment lines. Segments maps have been verified using SST to avoid any errors before starting the angular segment analysis. Values of global and local integration for the 5km buffer area were recorded to examine synergy in campuses’ locations. Furthermore, values of NAIN and NACH of campuses were correlated to examine accessibility on-campus. Then, catchment analysis of 800 meters (10 minutes’ walk) were conducted from nearest bus stops and railroad stations to have a better assessment of accessibility to campuses. Locations for bus stops and railroad stations were downloaded from the Japanese National Land Survey Data [49].
2.3 Cell statistical analysis
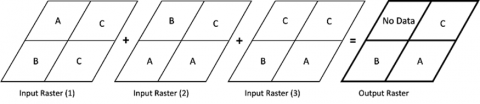
Moreover, cell statistical analysis was conducted to examine land use and building height temporal changes from 2008 till 2017. Land use and building height data form 2008 till 2017 were provided by Fukuoka City Urban Affairs Bureau. Cell statistical analysis was conducted using spatial analyst toolkit in Geographical Information System (ArcGIS) software [50]. First, land use and building height vector layers for 2008, 2012 and 2017 were converted to raster layers of 200x200m for land use and 100x100m for building height. When converting to raster layers, cell assignment has been chosen to be maximum combined area for land use layers and cell centre for building height layers. Maximum combined area method means that if the cell overlays more than one feature, cell’s value will be assigned to have the value of the combined feature with largest area. On the other hand, Cell centre method means that the value of the cell will be the same value of the polygon that overlaps the centre of the cell. Maximum combined area method has been chosen for land use layers to examine the dominant land use type in the area of the study for a 10-years period. However, cell centre method has been chosen for building height layers to ensure finer distribution of raster cells due to small areas of building polygons compared to land use polygon. After raster conversion, the three raster layers for 2008, 2012, 2017 were merged using cell statistics tool in ArcGIS to provide a raster layer that contain the major repeated value in each cell of the merged layers. For example, if a cell has a ‘residential use’ value in two layers and a ‘commercial use’ value in one layer the output value for the merged raster cell will have a ‘residential use’ value because it is the major value (Figure 1). Same was done to building height raster layers for 2008, 2012 and 2017. However, in building height raster layer a cell of 100mx100m was chosen to ensure finer grained layer suitable for building scale. By doing so, cell statistical analysis would give us a map that shows the dominant land use and building height in each cell to understand area’s temporal trends [51]. Moreover, census data were downloaded from Fukuoka City Open Data Website to examine demographic change in the area as well [52] (Figure 2).
Figure 1. Cell statistics analysis [majority type]
Figure 2. Research methodology schema
3.1 Syntactic analysis results
3.1.1 Syntactic analysis of areas around campuses
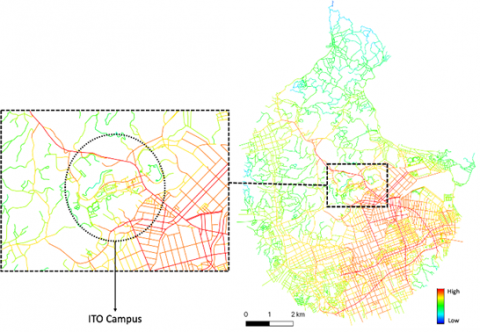
Figure 3. Ito Campus area (Integration Rn)
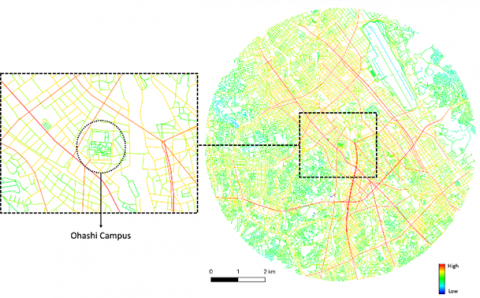
Figure 4. Ohashi Campus area (Integration Rn)
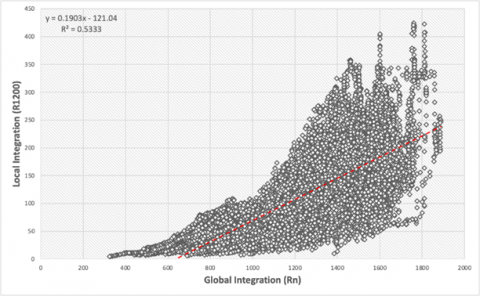
Figure 5. Chart shows the correlation between global and local integration in Ito Campus area
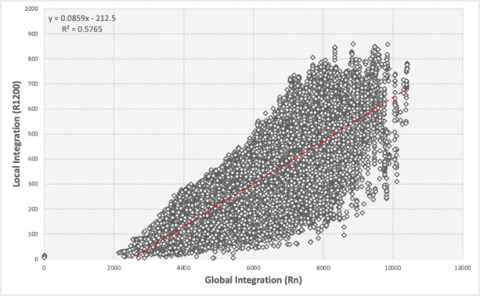
In order to understand the potentiality of the surroundings of campuses, global and local integration for the area around selected campuses have been examined. Figure 3 and Figure 4 show global integration (Rn) maps for Ito campus and Ohashi campus respectively. Red lines represent routes with high integration values and blue lines represent lower values. Areas near to Ito campus has shown to have high values of integration which means that these areas have more potentiality to be having more activity compared to other routes. Moreover, Ito campus itself has shown moderate and lower values of integration. The campus is also directly connected to route 567 which has high value of integration. On the other hand, unlike Ito campus, Ohashi campus has shown low values of integration. However, it is located in a well-integrated area and surrounded by streets with higher values such as Nisseki-dori and Shiobaru 59 streets. This shows that Ohashi campus is considered isolated from the surrounding area; as it is only connected to the surroundings through two access points only: The front gate from Nisseki-dori street and the back one from Shiobaru 59 street. Moreover, the correlation between global and local integration has been examined to view the synergy of the spatial network around campuses. Both campuses have shown moderate correlation between global integration and local integration (R1200m). The correlation coefficient (R2) values are 0.53 and 0.58 for Ito campus and Ohashi Campus respectively (Figure 5 and Figure 6). This means that there is a moderate correlation between global and local integration of areas around the campus; and these parts of the city are moderately integrated on macro and micro scales. This shows that Ito campus has more potentiality to be integrated with the city more than Ohashi campus, as Ohashi campus is isolated with gates and fences unlike Ito campus which has an open style.
Figure 6. Chart shows the correlation between global and local integration in Ohashi Campus area
3.1.2 Syntactic analysis of campuses’ layout
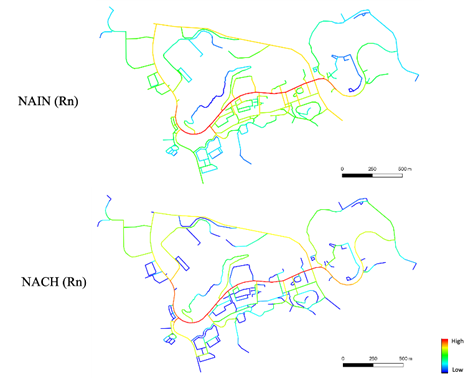
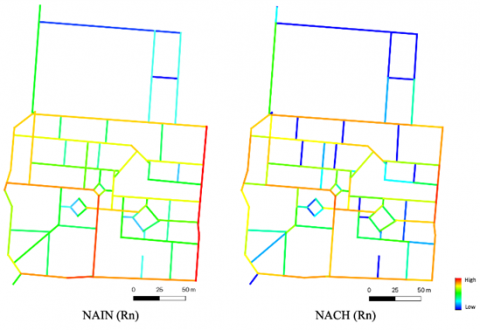
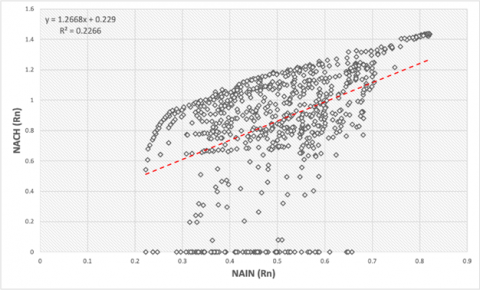
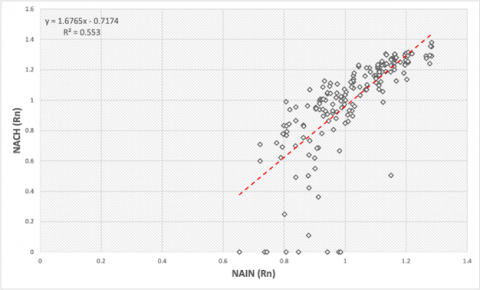
To understand accessibility on-campus, NACH (Rn) and NAIN (Rn) for both campuses have been calculated to view the correlation between them. As shown in Figure 7, Ito campus has shown low values for NACH and NAIN, as the main street inside the campus (Big Orange street) only has recorded having higher values. On the other hand, Ohashi campus has shown moderate and high values for NACH and NAIN scattered in a consistent way inside the campus; which shows a balance of potential activity and movement on Ohashi campus compared to Ito campus (Figure 8). Moreover, to validate the results, the correlation between NAIN and NACH for both campuses have been examined and results show that R2 for Ito campus and Ohashi campus are 0.23 and 0.55 respectively (Figure 9 and Figure 10). This shows that Ohashi campus has better accessibility on-campus than Ito campus which has shown lower correlation. This means that routes at Ohashi campus that are likely to be desired destinations have also a potentiality of movement. This also means that important routes at Ohashi campus, such as routes heading to the fountain, which have more potentiality of activity and movement are more accessible and easier to get to compared to Ito campus.
Figure 7. Ito Campus (NAIN Rn, NACH Rn)
Figure 8. Ohashi Campus (NAIN Rn, NACH Rn)
Figure 9. Chart shows the correlation between NAIN (Rn) and NACH (Rn) in Ito Campus
Figure 10. Chart shows the correlation between NAIN (Rn) and NACH (Rn) in Ohashi Campus
3.1.3 Catchment analysis
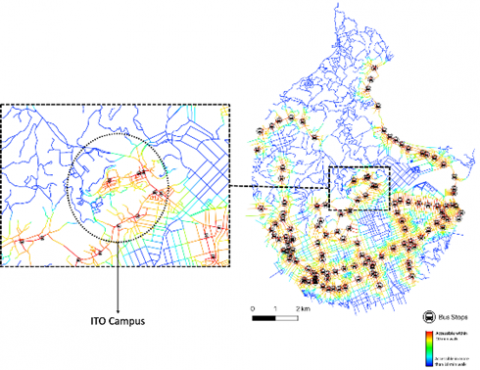
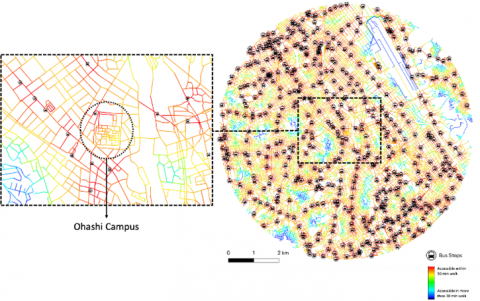
Figure 11. Ito Campus catchment analysis 800m (Bus Stops)
Figure 12. Ohashi Campus catchment analysis 800m (Bus Stops)
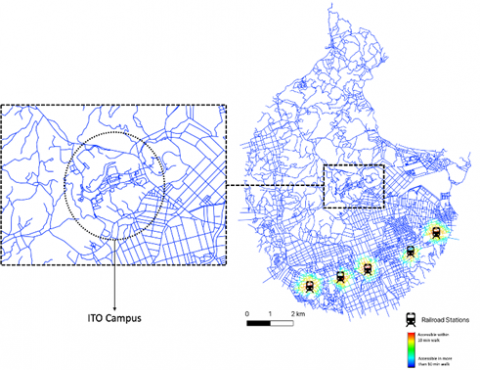
Figure 13. Ito Campus catchment analysis 800m (Railroad Stations)
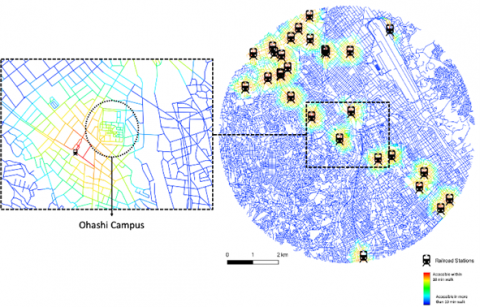
Furthermore, to understand accessibility to campuses, a catchment analysis of 800m (which is the equivalent to 10 minutes’ walk) have been calculated from bus stops as well as railroad stations. Figure 11 and Figure 12 show areas accessible from bus stops around Ito campus and Ohashi campus respectively with red colour for accessible areas in 10 minutes’ walk and blue colour for areas accessible in more than 10 minutes’ walk. Both campuses have shown to be accessible in 10 minutes from surrounding bus stops. However, due to the scale of Ito campus, some parts of it need more than 10 minutes to reach on foot such as West 2 and West 4 buildings. Similarly, catchment analysis from railroad stations have been calculated for both campuses. Figure 13 shows that Ito campus is located far away from the nearest railroad station (Kyudai Gakkentoshi Station), and it may require another way of transportation to reach. On the other hand, Ohashi campus has shown to be accessible in 10 minutes’ walk from the nearest station (Ohashi station) and in a little over 10 minutes from another near-by station (Takeshita station) as well (Figure 14). This could be understood in the context of campuses’ location according to the city as Ohashi campus is located in the core of the city which makes it accessible by different modes of transportations unlike Ito campus which is located in the outskirts of the city.
Figure 14. Ohashi Campus catchment analysis 800m (Railroad Stations)
3.2 Socio-spatial temporal analysis results
As explained earlier, Ito campus is a relatively new compared to Ohashi campus. Therefore, land use and building height temporal trends were examined starting from 2008 till 2017; as Fukuoka City Urban Affairs Bureau conducts data collection survey every five years. Areas of 2km buffer zone around campuses were highlighted to focus on surrounding land use and building height in 20 minutes’ walk range as students and staff would probably decide to live within 20 minutes’ walk from campus. Moreover, business owners would also be interested of areas within 20 minutes’ walk from campus to benefit from existing students. Therefore, cell statistical analysis has been limited to 2km buffer area around both campuses.
3.2.1 Land use cell statistical analysis
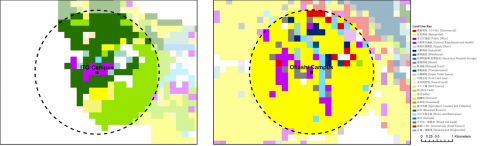
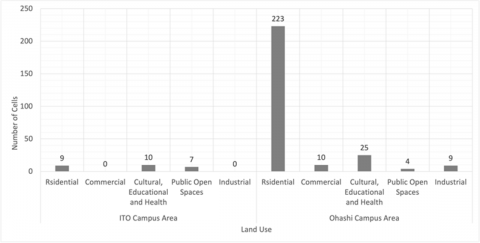
Land use cell statistical analysis has shown a wide range of land uses that existed around Ohashi campus from 2008 till 2017 including residential, commercial, and industrial areas. On the other hand, Ito campus has been surrounded mainly by mountain forests, green public spaces, fields and few residential lands (Figure 15). Figure 16 shows the big difference in the number of land use cells between Ito campus area and Ohashi campus area. Interestingly, for around 10 years, the area around Ito campus has had more cultural, educational and health cells than residential cells. Moreover, Ito campus area hasn’t had any commercial cell at all for around 10 years since the campus was established. On the other hand, Ohashi campus, which is smaller in size and has a smaller number of students compared to Ito campus, has 10 commercial cells around it. If we compare commercial to residential use ratio in areas around both campuses, we will find out that area around Ohashi campus has one commercial cell for each 22.3 residential cells compared to Ito campus area which has zero commercial cells. Moreover, Ohashi campus area has more industrial cells and cultural, educational and health cells more than Ito campus area. However, Ito campus area has more public green spaces more than Ohashi campus area which is predictable due to the location of Ito campus. Keeping in mind the size difference between two campuses, we would say that Ohashi campus area has been more privileged with land uses than Ito campus area since 2008.
3.2.2 Building height cell statistical analysis
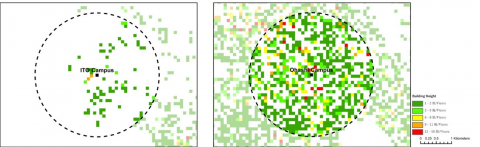
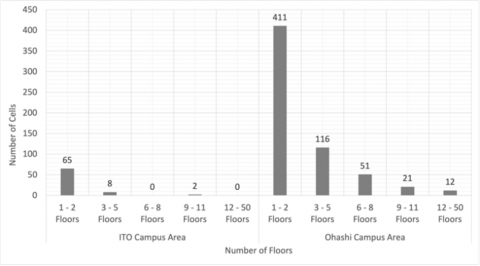
Building height cell statistical analysis has shown that Ito campus area is surrounded by low-rise buildings with few high-rise buildings that belong to the campus. On the other hand, Ohashi campus area has a variety of low-rise, mid-rise and high-rise building scattered around the campus in all directions. This shows that Ohashi campus area is considered to be highly urbanized area for the 10 years-period from 2008 till 2017 unlike Ito campus area which is considered as a suburban area (Figure 17). Moreover, cell statistics show that 97% of cells in Ito campus area are low-rise building cells )with a height of 1 to 5 floors(, while high rise building cells occupy only 3% of the cells (with a height of 9-50 floors). On the other hand, around 86% of cells in Ohashi campus area belong to low-rise buildings and around 5% of the cells belong to high-rise buildings (Figure 18). Additionally, the distribution of mid-rise and high-rise building cells in Ohashi campus area is considered more consistent than Ito campus area. This gives us an overview of the urban morphological form in both areas from 2008 till 2012.
Figure 15. Land use cell statistical analysis to examine temporal changes from 2008 till 2017
Figure 16. Chart shows land use in 2km buffer area around campuses [Cell Statistics]
Figure 17. Building Height cell statistical analysis to examine temporal changes from 2008 till 2017
Figure 18. Chart shows building height in 2km buffer area around campuses [Cell Statistics]
Figure 19. Census data comparison between Ito and Ohashi Campuses Areas
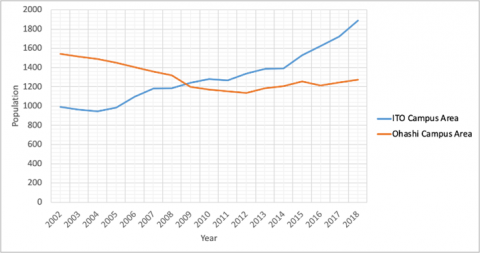
3.2.3 Census data comparison
In order to examine the effect of campuses location on the demographic change, census data has been collected for areas around campuses from 2002 till 2018. Census data has been limited to include citizens aged from 15 to 24 years old which includes university students’ age. For Ito campus, census data has been limited for Motooka Elementary School District which is the same district where the campus is located. For Ohashi campus, census data has been limited to include Shiobaru Elementary School District which is the same district where the campus is. As shown in Figure 19, there is a noticeable steady increase in the youth population around Ito campus. However, area around Ohashi campus has shown a noticeable decrease in the youth population which is normal in Japan; as Japan is known to be a super aging society [53]. So, having an increase in number of youths in Ito campus area is an indication of studentification and youthification of the area which in return affects its urban growth.
Syntactic analysis has shown that Ito campus has more potentiality to be integrated with the network grid of the city due to its open borders. Unlike Ohashi campus, Ito campus has also more potentiality to contribute to the publicness of Kyushu University, as the public can view and access campus common facilities which allow more communication and interaction between the university and the city. On the other hand, Ohashi campus has shown to be located in a well- integrated area of the city, but due to its gates and fences, it is considered isolated from the city despite being in the core of it. This shows that an open campus could be located in the outer peripheries of the city and be integrated with the city more than a gated campus located in the heart of it. However, this comes with downsides, as for Ito campus to be integrated with the city, the campus had to respect the surrounding spatial network which in turn affected accessibility on campus. On the other hand, accessibility in Ohashi campus has been reported to be better than Ito campus thanks to its gates that isolate the campus from the surroundings, so the spatial configuration of the campus is designed to serve its needs away from the surroundings.
Furthermore, syntactic analysis has also shown that Ohashi campus has been reported to be more accessible compared to Ito campus. Therefore, Ito campus could be considered a car dependent campus, as students and staff need to use railroad trains to reach the nearest station to the campus, then they take a bus or cycle instead. Moreover, Ito campus has nine different schools, so it has more students and staff than Ohashi campus which has one school only. Therefore, the capacity needed to transport students and staff to and from Ito campus, besides its accessibility limitations, affect energy consumption and carbon emissions resulted from commuting which in turn affects sustainability in the city. Additionally, campuses’ accessibility affects students’ residence preferability, as students and staff may prefer to live near by the campus to save time and money needed to commute to school. This has been reported in census data that showed that the population of youth is steadily increasing around Ito campus which is considered unique in an aging country like Japan [53]. This also shows the extent to which a campus can affect youthification and studentification of an area.
Although syntactic analysis has shown that Ito campus has more to offer to the city than Ohashi campus, socio-spatial temporal trends have shown that the impact of Ito campus on its surroundings is not significant unlike what was expected from the syntactic analysis. Ito campus area has shown to be a countryside residential area with less amenities than what would be expected based on campus size and number of students and staff that exist in it. On the other hand, Ohashi campus area has shown to be located in a highly accessible urbanized area which helped the campus to be surrounded with a variety of land uses and different range of building heights. Despite the fact that the syntactic analysis has shown that Ohashi campus is isolated from the city, its existence near to the core of the city helped the campus to contribute to the urbanization of the area which has been reflected from the socio-spatial analysis.
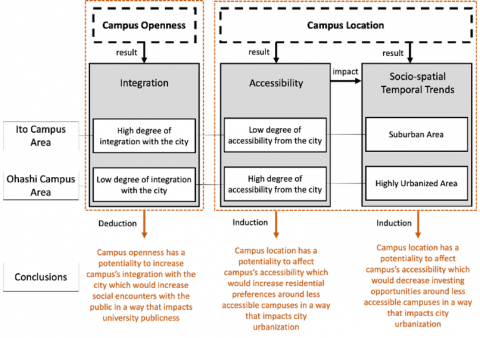
Figure 20. A schematic simplification of conclusions
We can deduce that campus openness has a potentiality to increase campus’s integration with the city which would increase social encounters with the public in a way that impacts university publicness. Hence, Ito campus has a potentiality to contribute to the university publicness more than Ohashi campus. Furthermore, we can induce that campus location has a potentiality to affect campus’s accessibility which would increase residential preferences around less accessible campuses in a way that impacts city urbanization. That explains why there is a steady increase of population around Ito campus, as it is less accessible compared to Ohashi campus. In other words, if the campus is accessible, students can live anywhere in the city, but if the campus is less accessible, students may prefer to live near to their campus. We can also induce that campus location has a potentiality to affect campus’s accessibility which would decrease investing opportunities around less accessible campuses in a way that impacts city urbanization (Figure 20). Stakeholders and decision makers wouldn’t be much interested to invest around less accessible campuses. However, accessible campuses may draw their attention. That explains why Ito campus has remained as residential and educational area with lots of mountain forests for almost 10 years. We can also conclude that the location of the campus according to the city impacts the surrounding built environment more than the openness of it. Therefore, decision makers, stakeholders and university administrators should co-design campus development process in the early stages to make the best use of campuses’ locations. By doing so, many downsides of campus-city relations will be prevented, and numerous design challenges would be avoided [54].
Campus-city physical and functional relationship with the city play a significant role in city’s transformation. However, the extent to which this transformation takes place depends on many different factors including the design of the campus itself and its openness to the surroundings. Moreover, the location of the campus according to the city is considered a vital factor that affects city’s urban growth. Therefore, this study has examined different factors to which campuses could affect their respective cities’ urbanization process. Two different campuses of Kyushu University were selected to view their relationship with Fukuoka City in Japan. By using space syntax methodology and socio-spatial analysis, results have shown that there are two main factors that contribute to city’s revitalization: the location of the campus and its openness. Results have shown that open campuses (like Ito campus) are more integrated with the city than gated ones which increases opportunities for communication and interaction with the public. Subsequently, this contributes to campus’s publicness and the image of the area where the campus is located. Moreover, results have also shown that the location of the campus affects its accessibility attribute which results in a demographic change that could be seen through census data, as the area around the campus started to get youthified in a faster pace. On the other hand, socio-spatial analysis has shown that despite the potentials that open campuses may offer for the city, the location of the campus has a higher impact than its openness. Ohashi campus area has shown to occupy a variety of land uses and building heights unlike Ito campus area which has remained as a suburban area since 2008.
We should also keep in mind that there are other factors that could affect city urbanization including city’s national masterplans, governmental agendas, the location of city’s major workplaces, local city centres, housing complexes and so on. This study has been limited to study the impact of university campuses as one of the main urban settings that exist in most cities. Due to the complexity of studying the impact of specific urban settings on cities, this research tried to use a mix of different methodologies and urban analytics to study the impact of universities on the city from different approaches. This paper also sets an example of how to adapt space syntax methodology with other urban analytics methods to have a more holistic view of socio-spatial temporal trends. Therefore, adapting space syntax methodology with socio-economic data is considered essential to have the full picture and assess the situation in an evidence-based method. This study needs to be extended in the future by including more campuses from different cities not only in Japan but also in other cities all around the world to examine university campuses’ local and global impact. This research could be also extended to adapt other socio-economic data such as land prices and rent prices to visualise campuses’ impact on the city in a deeper way. Future research could also expand the research problem to include the impact of campus location on the nearest nodality such as railroad stations or local city centres.
Authors would like to thank Fukuoka City Urban Affairs Bureau for providing essential data for conducting this research. Authors would also like to thank anonymous reviewers and editor in-chief for their valuable comments and feedback. This paper is part of the PhD thesis of the first author which is funded by the Japanese Ministry of Education, Culture, Sports, Science and Technology (MEXT).
[1] den Heijer, A.C. (2011). Managing the university campus: Information to support real estate decisions. Eburon Academic Publishers.
[2] Magdaniel, F.C. (2016). Technology Campuses and Cities: A Study on the Relation Between Innovation and the Built Environment at the Urban Area Level. TU Delft. The Netherlands.
[3] Magdaniel, C., den Heijer, A.C., de Jonge, H. (2018). The locations of innovation described through thirty-nine tech-campuses. Competitiveness Review: An International Business Journal, 28(1): 58-74. https://doi.org/10.1108/CR-01-2017-0014
[4] Chapman, P.M. (2006). American Places: In Search of the Twenty-First Century Campus. Westport, United States: Praeger Publishers.
[5] den Heijer, A.C., Magdaniel, C. (2018). Campus–City Relations: Past, Present, and Future. In: Meusburger P., Heffernan M., Suarsana L. (eds) Geographies of the University. Knowledge and Space, vol 12. Springer, Cham. https://doi.org/10.1007/978-3-319-75593-9_13
[6] Namvar, N., Elnokaly, A., Mills, G. (2019). The role of university in city transformation. Proceedings of the 12th International Space Syntax Symposium, 1: 1-17.
[7] Fassi, D. (2020). Campuses and the City. In: Fassi D., Landoni P., Piredda F., Salvadeo P. (eds) Universities as Drivers of Social Innovation. Research for Development. Springer, Cham. https://doi.org/10.1007/978-3-030-31117-9_2
[8] Neuman, D.J. (2013). Building Type Basics for College and University Facilities. Second Edition. New Jersey, United States: John Wiley & Sons.
[9] Haar, S. (2011). The City as Campus: Urbanism and Higher Education in Chicago. University of Minnesota Press.
[10] Magdaniel, F. (2013). The university campus and its urban development in the context of the knowledge economy. EURA Conference-Cities as Seedbeds for Innovation, Enschede, the Netherlands.
[11] Way, T. (2016). The urban university ’s hybrid campus. Journal of Landscape Architecture, 11(1): 42-55. https://doi.org/10.1080/18626033.2016.1144673
[12] Sayed, A.M. (2021). Using urban gamification to promote citizen participation for designing out graffiti in public spaces. http://hdl.handle.net/2324/4495581, accessed on Nov. 14, 2021.
[13] Mohammed, A.M.S., Hirai, Y. (2021). Utilising urban gamification for sustainable crime prevention in public spaces: A citizen participation model for designing against vandalism. International Journal of Sustainable Development and Planning, 16(1): 25-38. https://doi.org/10.18280/ijsdp.160103
[14] Hebbert, M. (2018). The campus and the city: a design revolution explained. Journal of Urban Design, 23(6): 883-897. https://doi.org/10.1080/13574809.2018.1518710
[15] Schwander, C., Kohlert, C., Aras, R. (2012). Campusanalyst: Towards a spatial benchmarking system. Proceedings of the 8th International Space Syntax Symposium, pp. 3-6. http://sss8.cl/8083.pdf.
[16] Kim, Y. (2009). Difference of place vitality in two central plazas. Proceedings of 7th International Space Syntax Symposium, Stockholm, Sweden.
[17] Greene, M., Penn, A. (1997). Socio-spatial analysis of four University Campuses: The implications of spatial configuration on creation and transmission of knowledge. Proceedings of 1st international Space Syntax Symposium, London, UK.
[18] Cundiff, K. (2021). Colleges and community crime: An analysis of campus proximity and neighborhood crime rates. Crime & Delinquency, 67(3): 431-448. https://doi.org/10.1177/0011128720974312
[19] Weisburd, D., Groff, E.R., Yang, S.M. (2012). The criminology of place: Street segments and our understanding of the crime problem. Oxford University Press. https://doi.org/10.1093/acprof:oso/9780195369083.001.0001
[20] Cohen, L.E., Felson, M. (1979). Social change and crime rate trends: A routine activity approach. American Sociological Review, 44(4): 588-608. https://doi.org/10.2307/2094589
[21] Fox, J.A., Hellman, D.A. (1985). Location and other correlates of campus crime. Journal of Criminal Justice, 13(5): 429-444. https://doi.org/10.1016/0047-2352(85)90043-1
[22] Etminani-Ghasrodashti, R., Paydar, M., Hamidi, S. (2018). University-related travel behavior: Young adults’ decision-making in Iran. Sustainable Cities and Society, 43: 495-508. https://doi.org/10.1016/j.scs.2018.09.011
[23] Blumenberg, E., Taylor, B., Smart, M., Ralph, K. (2012). What’s youth got to do with it? Exploring the travel behavior of teens and young adults. UC Berkeley: University of California Transportation Center.
[24] Klein, N.J., Smart, M.J. (2017). Millennials and car ownership: Less money, fewer cars. Transport Policy, 53: 20-29. https://doi.org/10.1016/J.TRANPOL.2016.08.010
[25] Moos, M. (2016). From gentrification to youthification? The increasing importance of young age in delineating high-density living. Urban Studies, 53(14): 2903-2920. https://doi.org/10.1177/0042098015603292
[26] Rugg, J., Rhodes, D., Jones, A. (2000). The nature and impact of student demand on housing markets. York Publishing Services for the Joseph Rowntree Foundation.
[27] Selwyn, N. (2008). ‘High-jinks’ and ‘minor mischief’: A study of undergraduate students as perpetrators of crime. Studies in Higher Education, 33(1): 1-16. https://doi.org/10.1080/03075070701794759
[28] Ahvenniemi, H., Huovila, A., Pinto-Seppä, I., Airaksinen, M. (2017). What are the differences between sustainable and smart cities? Cities, 60: 234-245. https://doi.org/10.1016/j.cities.2016.09.009
[29] Rösch, C., Bräutigam, K., Kopfmüller, J., Stelzer, V. (2018). Indicator-based sustainability assessment of the German energy system and its transition. Energy, Sustainability and Society, 7(1): 1-13. https://doi.org/10.1186/s13705-016-0103-y
[30] Verstaevel, N., Boes, J., Gleizes, M.P. (2018). From smart campus to smart cities issues of the smart revolution. IEEE Smart World/SCALCOM/UIC/ATC/CBDCom/IOP/SCI 2017, Conference Proceedings, pp. 1-6. https://doi.org/10.1109/UIC-ATC.2017.8397400
[31] Smith, D.P. (2005). ‘Studentification’: The gentrification factory? NewYork: Routledge.
[32] Gu, H., Smith, D.P. (2019). ‘Living off the campus’: Urban geographies of change and studentification in Beijing, China. Urban Geography, 41(2): 205-224. https://doi.org/10.1080/02723638.2019.1659071
[33] Kinton, C., Smith, D.P., Harrison, J., Culora, A. (2018). New frontiers of studentification: The commodification of student housing as a driver of urban change. The Geographical Journal, 184(3): 242-254. https://doi.org/10.1111/GEOJ.12263
[34] He, S. (2014). Consuming urban living in ‘villages in the city’: Studentification in Guangzhou, China. Urban Studies, 52(15): 2849-2873. https://doi.org/10.1177/0042098014543703.
[35] Grabkowska, M., Frankowski, J. (2016). Close to the city centre, close to the university’. Are there symptoms of studentification in Gdańsk, Poland? Bulletin of Geography: Socio-economic Series, 32(32). https://doi.org/10.1515/bog-2016-0016
[36] Toprak, I., Ünlü, A., Van Nes, A. (2017). Diachronic assessment of cultural diversity in historic neighbourhoods using space syntax: Studies of three neighbourhoods in Istanbul. XI SSS: 11th International Space Syntax Symposium, Instituto Superior Técnico, Portugal.
[37] Kinton, C. (2013). Processes of destudentification and studentification in Loughborough. Loughborough, UK. https://core.ac.uk/download/pdf/288381202.pdf.
[38] Kinton, C., Smith, D., Harrison, J. (2016). De-studentification: emptying housing and neighbourhoods of student populations. Environment and Planning A: Economy and Space, 48(8): 1617-1635. https://doi.org/10.1177/0308518X16642446
[39] van Nes, A., Ye, Y. (2014). The theory of the natural urban transformation process: The relationship between street network configuration, density and degree of function mixture of built. http://citeseerx.ist.psu.edu/viewdoc/download?doi=10.1.1.964.2543&rep=rep1&type=pdf, accessed on Nov. 14, 2021.
[40] Hillier, B., Hanson, J. (1989). The Social Logic of Space. London, UK: Cambridge University Press.
[41] Hillier, B. (2007). Space is the Machine: A Configurational Theory of Architecture. London, UK: Space Syntax.
[42] Dawson, P. (2003). Analysing the effects of spatial configuration on human movement and social interaction in Canadian Arctic communities. In 4th International Space Syntax Symposium, London, UK, pp. 37.1-37.14.
[43] Penn, A. (2003). Space syntax and spatial cognition: or why the axial line? Environment and Behavior, 35(1): 30-65. https://doi.org/10.1177/0013916502238864
[44] Kim, Y.O. (1999). Spatial configuration, spatial cognition and spatial behaviour: The role of architectural intelligibility in shaping spatial experience. University College London, London, UK.
[45] Hillier, B. (2008). Space and spatiality: What the built environment needs from social theory. Building Research and Information, 36(3): 216-230. https://doi.org/10.1080/09613210801928073
[46] Turner, A. (2001). Angular analysis. Proceedings of the 3nd International Symposium on Space Syntax, USA, pp. 1-11.
[47] Hillier, B., Yang, T., Turner, A. (2012). Normalising least angle choice in Depthmap-and how it opens up new perspectives on the global and local analysis of city space. Journal of Space syntax, 3(2): 155-193.
[48] Gil, J. (2015). Examining " Edge Effects ": Sensitivity of spatial network centrality analysis to boundary conditions. Proceedings of 10th International Space Syntax Symposium, London, UK. https://www.researchgate.net/profile/Jorge-Gil-5/publication/281856927.
[49] Japanese National Land Survey Agency. (2017). Japanese National Land Survey Data. https://nlftp.mlit.go.jp/ksj/index.html, accessed on Sep. 14, 2021.
[50] ESRI. (2001). ArcGIS spatial analyst: Advanced GIS spatial analysis using raster and vector data. ESRI White Paper, pp. 1-17.
[51] van Nes, A., Yamu, C. (2021). Introduction to Space Syntax in Urban Studies. Springer. https://doi.org/10.1007/978-3-030-59140-3
[52] Japanese Open Government Data. (2019). Open Data of Fukuoka City. https://www.open-governmentdata.org/fukuoka-city/, accessed on Sep. 14, 2021.
[53] Muramatsu, N., Akiyama, H. (2011). Japan: super-aging society preparing for the future. The Gerontologist, 51(4): 425-432. https://doi.org/10.1093/geront/gnr067
[54] Mohammed, A.M.S., Hirai, Y. (2021). Investigating the Relationship between problems and solutions in design: Insights from frame innovation. American International Journal of Contemporary Research, 11(1): 9-20. https://doi.org/10.30845/aijcr.v11n1p2