Hengwei Wang | Xiangmei Zhou | Xingyu Liu* | Xinyi Fu | Hongsheng Zhao
© 2021 IIETA. This article is published by IIETA and is licensed under the CC BY 4.0 license (http://creativecommons.org/licenses/by/4.0/).
OPEN ACCESS
As the basis of land resource allocation and land use planning, land-use functions (LUFs) are important indicators for evaluating the sustainable development of land and environments. It is essential to evaluate the LUFs of a specific area from the perspective of land-use comprehensive functions. This paper takes 38 districts and counties in Chongqing, China, as an example to construct a state-space model from three aspects, production factors, living factors, and ecological factors, which affect the functions of land resources. The paper continues to construct an evaluation index system and determine indicators by entropy methods to calculate and evaluate the spatial differentiation of land-use functions in Chongqing. The results show that the value of land-use multi-functions in Chongqing can be divided into three levels. The results are characterized by the gradual weakening of the main urban area and the polarization effect is strong. The distribution characteristics of this result are caused by the differences in traffic conditions, geographical location, the quality of natural conditions, economic levels, planning policies, etc. In the end, this paper proposes relative suggestions for the facet of eco-friendly production and development to strengthen future policy guidance. Future studies can continue to improve the index system and study the spatio-temporal effects of LUFs from a microscopic perspective to make the results more accurate.
land-use functions, land ecological–production–living spaces, spatial differentiation, state–space model, Chongqing
Land is an important natural resource for the survival of human beings and represents a basis for the development of a country or a region. It has ecological, productive, and living support functions and supports various productions and constructions of human society. The materialization characteristics of the land determine the type of land use, and also determines its unique production–living–ecology function characteristics [1-3]. Based on this, the multi-functional evaluation of land use is the basic work of sustainable land use, which can improve land use efficiency and the maximum use of land resources, and have a positive effect on controlling greenhouse gas emissions [4-7]. It also provides a basis for coordinating land science, as well as promote the sustainable development of regional social economy.
The concept of land-use functions (LUFs) was first proposed in the European Union’s Sixth Framework SENSOR Project (Sustainability Impact Assessment: Tools for Environmental Social and Effects of Multifunctional Land Use in Europe Regions, SENSOR), which refers to private and public goods and services provided by different land use modes [7]. The first proposed multi-function of land use mainly includes three functions, namely, social, economic, and environmental functions [8-10]; Later, relevant scholars added ecological factors to the environmental function [11]. According to the national development strategy, Chinese scholars have divided land use multi-functions into three dimensions, namely, productive functions, living functions, and ecological functions [12]. For now, research on land use versatility has been focused on ecology [13], agriculture [14-16], sustainable development [17, 18], regional dynamic assessment, and space research [19-21]. The research methods also have gradually changed from qualitative research to quantitative research [8, 22-23]. However, most studies on land use multi-functional assessments have focused on national and provincial levels, while few studies have focused on municipal levels [24, 25].
With the rapid development of urbanization and industrialization, urban populations are aggregating and some land resources have been overexploited, which has caused the transformation, weakening, and even disappearance of land supporting functions [26]. There is an urgent need to carry out objective and scientific research and the evaluation of the LUFs.
The 18th National Congress of the Communist Party of China proposed that improving the pattern of national space development, promoting intensive and efficient production spaces, creating suitable living spaces, moderating and beautifying ecological space [27]. This strategy has put forward new requirements for the comprehensive evaluation of LUFs in this new period. Based on this, a study on the spatial differentiation of the LUFs of ecological–production–living spaces could provide a scientific guide for land use planning and management [28], also serving national efforts for optimizing spatial development patterns [29]. On January 21, 2020, the Department of Natural Resources issued a guideline for evaluating the carrying capacity of resources and the environment and for the suitability of the development of territorial space, reflecting the country’s current need to optimize development patterns of territorial spaces and lead green development.
As a typical inland city in southwestern China, and as an important economic center in the upper reaches of the Yangtze River, Chongqing is one of the environmental protection areas of China’s main functional areas [30]. It has the regional characteristics of having a “huge city, huge countryside, huge mountain area, and huge warehouse” [31]. Since Chongqing became a municipality directly under the Central Government, its economy and society have both developed rapidly [32]. At the same time, the problem of a shortage of land resources has become increasingly prominent. The pressure between production, human life, and ecology is rapidly intensifying [33]. It is urgent for this region to improve the efficiency of land use scientifically and coordinate the development of ecological space, productive space, and living space, and pay attention to the multi-functions of land use. Therefore, this article will use land multi-functional evaluation methods and take 38 districts or counties in Chongqing as the research area, then establish a state–space model based on the indicators that affect the LUFs in order to evaluate and contrast. Finally, this article will provide references for the development of differentiated land-use policies. This study has an important and practical significance for future industry selection and spatial distribution, development scale control, and regional ecological security in Chongqing, which may provide decision-making references for the sustainable assessment of land use in Chongqing and for spatial planning and optimization.
The remainder of this paper is organized as follows. Section 2 introduces the study area and study methods, including the state–space model. Section 3 analyzes how to calculate the value of the LUFs and provides the results. Section 4 presents a discussion of the results.
2.1 Study area
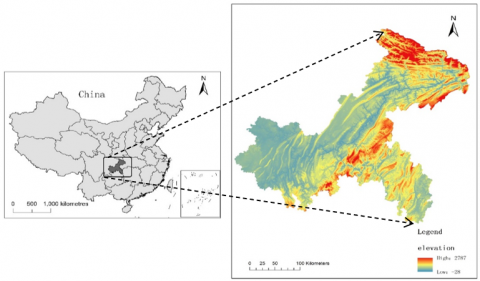
Chongqing is located in the southwest of China and along the upper reaches of the Yangtze River. It covers the transition zone between the Tibetan plateau and the middle and lower Yangtze plain between 28.10°-32.13° N and 105.11°-110.11° E. Its east and southeast borders are adjacent to the Hubei and Hunan provinces. To the west is Guizhou, and the west and north are adjacent to Sichuan, and the northeast is connected to Shanxi and Hubei. The city is 470 km wide from east to west and 450 km wide from north to south, covering a total of 82,402.95 km2, which is 2.39 times that of the total area of Beijing, Tianjin, and Shanghai, among which the built-up central downtown area covers 647.78 square kilometers. The location of Chongqing is shown in Figure 1.
2.2 Data sources
The original data for the calculation of this study were collected from the “Survey Data of Land Use Change of Chongqing, 2017”, which were provided by the Chongqing Planning and Natural Resources Bureau (1), along with the “Statistical Yearbook of Chongqing, 2018” (2), and “The Environment Bulletin of Chongqing, 2017” (3).
2.3 State–space model
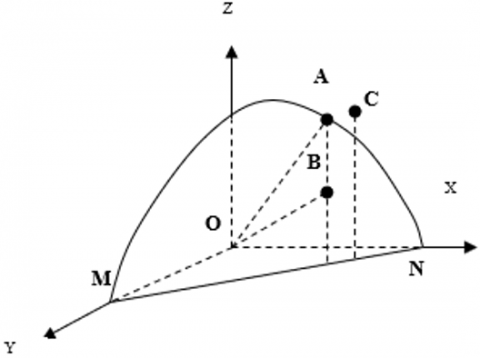
In order to quantitatively measure the LUFs in Chongqing, the state-space model was used according to relevant researches. The state–space model is a Euclidean geometrical space model for quantitatively describing the state of a system [34]. It is usually composed of the 3D state–space axis, which represents the elements of the state vector. In this model, any carrying state of the urban system within a certain scale can be represented by carrying state points. The carrying state point that represents the ideal state of the urban system is the position of the urban carrying capacity in the state space. The use of the carrying state point in the state–space method can be loaded with different conditions in a certain area or a certain time [35].
Figure 1. Geographical location and digital elevation map (DEM) of Chongqing, China
Figure 2. The state–space model
The factors which affect the LUFs can be summarized as the ecological factors (X), productive factors (Y), and living factors (Z). The LUFs and condition of the state–space model are expressed in Figure 2.
In this model, the LUFs can be expressed as the vector modulus from the origin (O) to the state point (B) (as line OB) to indicate the size of them. Their mathematical expression is written as follows:
$\mathrm{R}=|\mathrm{M}|=\sqrt{\sum_{\mathrm{i}=1}^{\mathrm{n}} \mathrm{x}_{\mathrm{i}}^{2}}$ (1)
where, R is the size of the LUFs and Xi is the coordinate value of factors in the model. Considering the different influences degree of factors, the mathematical expression can be improved as follows:
$\mathrm{R}=|\mathrm{M}|=\sqrt{\sum_{\mathrm{i}=1}^{\mathrm{n}} \mathrm{w}_{\mathrm{i}} \mathrm{x}_{\mathrm{i}}^{2}}$ (2)
where, Wi is the weight of Xi.
After selecting the corresponding data and using Eq. (2), the scores of the LUFs can be calculated separately.
2.4 Methods
2.4.1 Construction of indicators system
Based on the relevant academic achievements and the principles of science and practicality, this paper selects three categories of factors which include ecology, production, and human life, with a total of 20 indicators, according to the state–space model.
The indicators of LUFs are shown in Table 1.
Table 1. Indicators of land-use functions (LUFs). GDP: Gross domestic product
|
Object |
Factor |
Indicator |
Data sources |
|
Values of LUFs (A) |
Ecological factors(B1) |
Water resources per capita (C1) |
The Environment Bulletin of Chongqing |
|
Ecological area ratio (C2) |
Survey Data of Land Use Change of Chongqing, 2017 |
||
|
Forest coverage rate (C3) |
|||
|
Air quality index (C4) |
The Environment Bulletin of Chongqing |
||
|
Environment noise (C5) |
|||
|
Transport noise (C6) |
|||
|
Productive factors(B2) |
GDP per unit area (C7) |
Survey Data of Land Use Change of Chongqing, 2017; Statistical Yearbook of Chongqing, 2018 |
|
|
Per capita construction land area(C8) |
|||
|
Real estate output per unit area (C9) |
|||
|
Investment in fixed assets per unit area (C10) |
|||
|
Intensity of land development and utilization (C11) |
|||
|
Total value of import and export per unit area (C12) |
|||
|
Total retail sales of consumer goods per unit area (C13) |
|||
|
Living factors(B3) |
Density of population (C14) |
Statistical Yearbook of Chongqing, 2018 |
|
|
Urbanization rate (C15) |
|||
|
Highway area per capita (C16) |
Survey Data of Land Use Change of Chongqing, 2017; Statistical Yearbook of Chongqing, 2018 |
||
|
Urban per capita disposable income (C17) |
|||
|
Rural per capita disposable income (C18) |
|||
|
Public library collection per unit area (C19) |
|||
|
Balance of deposits in financial institutions per capita(C20) |
2.4.2 Normalization of the indicators
There are two types of indicators, where one is an efficiency indicator and the other is a cost indicator. With respect to “efficiency indicators”, a larger value of the indicator is better.
$\mathrm{Z}_{\mathrm{ij}}=\frac{\mathrm{X}_{\mathrm{ij}}-\mathrm{X}_{\mathrm{imin}}}{\mathrm{X}_{\mathrm{imax}}-\mathrm{X}_{\mathrm{imin}}}$ (3)
where, Xij are the efficiency indicators.
$Z_{\mathrm{ij}}=\frac{X_{\text {imax }}-X_{i j}}{X_{\operatorname{mimax}}-X_{\operatorname{minin}}}$ (4)
where, Xij are the cost indicators.
When the indicators are normalized, the original data can be standardized into a range of 0-1.
2.4.3 Determination of Weights
In the study, the entropy method was applied to determine the weight of an index. The entropy method is an objective valuation method which can avoid the influence caused by the error of subjective influence. Its calculation formula can be expressed as follows:
Calculate the entropy Si of indicators i:
$S_{i}=-k \sum_{j=1}^{n} Z_{i j} I n Z_{i j}$ (5)
where, k > 0 and k = 1/lnn, where n refers to the number of research objects. Here, n = 38.
1) Calculate the coefficient of variation:
$\mathrm{T}_{\mathrm{i}}=1-\mathrm{S}_{\mathrm{i}}$ (6)
2) Calculate the weight value:
${{\text{W}}_{\text{i}}}={}^{{{\text{T}}_{\text{i}}}}/{}_{\sum\limits_{\text{i}=\text{1}}^{\text{m}}{{{\text{T}}_{\text{i}}}}}$ (7)
The weight values of LUFs are shown in Table 2.
Table 2. The weight values of LUFs
|
Object |
Factor |
Indicator |
Weight value |
|
Values of LUFs (A) |
Ecological factors (B1) 0.1339 |
(C1) |
0.0377 |
|
(C2) |
0.0156 |
||
|
(C3) |
0.008 |
||
|
(C4) |
0.0072 |
||
|
(C5) |
0.0047 |
||
|
(C6) |
0.0606 |
||
|
Productive factors (B2) 0.5316 |
(C7) |
0.1128 |
|
|
(C8) |
0.0071 |
||
|
(C9) |
0.0783 |
||
|
(C10) |
0.0674 |
||
|
(C11) |
0.0277 |
||
|
(C12) |
0.1085 |
||
|
(C13) |
0.1299 |
||
|
Living factors (B3) 0.3345 |
(C14) |
0.1104 |
|
|
(C15) |
0.0157 |
||
|
(C16) |
0.0056 |
||
|
(C17) |
0.0061 |
||
|
(C18) |
0.0117 |
||
|
(C19) |
0.132 |
||
|
(C20) |
0.0529 |
According to the above, the LUFs can be calculated separately (Table 3).
Table 3. The scores of LUFs
|
Area |
A |
B1 |
B2 |
B3 |
Area |
A |
B1 |
B2 |
B3 |
|
Yuzhong |
0.8928 |
0.124 |
0.9933 |
0.8992 |
Kaixian |
0.1846 |
0.4785 |
0.0213 |
0.0976 |
|
Jiangbei |
0.3611 |
0.3139 |
0.2535 |
0.4983 |
Wushan |
0.183 |
0.4817 |
0.0309 |
0.0755 |
|
Shapingba |
0.3582 |
0.2785 |
0.4001 |
0.3132 |
Pengshui |
0.1827 |
0.4834 |
0.0216 |
0.0744 |
|
Shizhu |
0.3005 |
0.7954 |
0.0303 |
0.1235 |
Yunyang |
0.182 |
0.4829 |
0.0255 |
0.0684 |
|
Wuxi |
0.2992 |
0.8133 |
0.0314 |
0.0362 |
Wanzhou |
0.1816 |
0.3448 |
0.0788 |
0.2027 |
|
Yubei |
0.2989 |
0.3116 |
0.1685 |
0.4279 |
Dazu |
0.1768 |
0.3903 |
0.0545 |
0.1666 |
|
Tongnan |
0.2683 |
0.6939 |
0.0421 |
0.1403 |
Tongliang |
0.1743 |
0.3567 |
0.0481 |
0.1904 |
|
Nanan |
0.2515 |
0.2876 |
0.1934 |
0.3107 |
Bishan |
0.1701 |
0.2993 |
0.065 |
0.2096 |
|
Dadukou |
0.2489 |
0.2668 |
0.2031 |
0.3019 |
Wulong |
0.1698 |
0.4225 |
0.0212 |
0.1182 |
|
Jiulongpo |
0.2455 |
0.3264 |
0.1731 |
0.2999 |
Liangping |
0.1651 |
0.3955 |
0.0366 |
0.1292 |
|
Chengkou |
0.2433 |
0.6567 |
0.0265 |
0.0561 |
Yongchuan |
0.1634 |
0.2526 |
0.0689 |
0.2161 |
|
Rongchang |
0.2352 |
0.5733 |
0.0561 |
0.1698 |
Fengdu |
0.1596 |
0.4057 |
0.0267 |
0.0956 |
|
Banan |
0.221 |
0.4421 |
0.0519 |
0.252 |
Hechuan |
0.1559 |
0.2884 |
0.0415 |
0.1914 |
|
Xiushan |
0.2131 |
0.5679 |
0.0173 |
0.0785 |
Fuling |
0.1498 |
0.2737 |
0.0401 |
0.1859 |
|
Beibei |
0.2071 |
0.3519 |
0.0863 |
0.2585 |
Changshou |
0.1475 |
0.2649 |
0.0625 |
0.1754 |
|
Nanchuan |
0.2056 |
0.5005 |
0.0316 |
0.1567 |
Fengjie |
0.1407 |
0.3704 |
0.0227 |
0.0584 |
|
Youyang |
0.2053 |
0.5577 |
0.0149 |
0.0334 |
Zhongxian |
0.1284 |
0.264 |
0.0374 |
0.1386 |
|
Qianjiang |
0.2035 |
0.5264 |
0.031 |
0.1064 |
Qijiang |
0.1146 |
0.2121 |
0.0274 |
0.1417 |
|
Jiangjin |
0.1956 |
0.4079 |
0.0472 |
0.2103 |
Dianjiang |
0.1133 |
0.2135 |
0.0373 |
0.1337 |
3.1 Evaluation and analysis of all kinds of LUFs in Chongqing
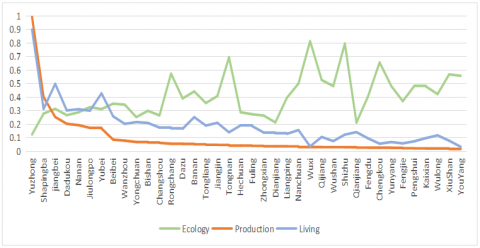
Each district’s factor layer LUFs can be calculated separately (Figure 3).
3.1.1 Land ecological functions
According to the evaluation results, the land ecological functions can be divided into three categories, namely, a high score range between 0.6 and 1, including Wuxi, Shizhu, Chengkou, and Tongnan; a medium score range between 0.3 and 0.6, including Rongchang, Xiushan, and the other 20 districts; and a low score range between 0 and 0.3, including Bishan, Hechuan, Nanan, etc., amounting to a total of 12 districts.
Figure 3. Line chart of each district’s factor layer LUFs
The ecological function index is the premise and guarantee of the sustainability of the comprehensive functions of a given area of land. A better understanding of the level of land ecosystem health in a region is helpful for policymakers for developing measures for eco-space management [36]. Wuxi, Shizhu, Chengkou, and Tongnan, which are in the leading level, are located in the border area of Chongqing. They are in the east, northeast, and west, respectively and are far away from the main city.
Wuxi, Chengkou and Shizhu are located in the highest and most rugged area. The relative elevation differences of them were 2657.4m, 2204.2m and 1815.1m, and the ecological land area ratios were 71.37%, 77.73% and 83.17%, respectively. It can be seen that due to the above natural or geographical reasons, urban construction and development in this region are relatively insufficient, and its natural ecology has not been destroyed. Correspondingly, due to the good natural environment, the air quality in these two areas is better. It means that they have obvious advantages in ecological environments. Among them, Wuxi and Chengkou are located in the northeast of Chongqing, the farthest area from the main city. And this area is also important ecological barrier protection areas in the Three Gorges Dam area and represents a key ecological agriculture development area in Chongqing. Their urban planning is positioned as a demonstration area for ecological priority green development, a livable area for high-quality life and a world-class destination for ecological culture tourism and health care.
As for Shizhu, it has vigorously developed green characteristics for the tourism industry there. The proportion of ecological land is more than 70%, and the proportion of agricultural land is relatively high. There are few industries above the scale in the region, so the ecological level of the region is relatively optimistic. However, Tongnan is located at a lower altitude with relatively developed traffic. As a new industrial base of Chengdu–Chongqing, due to its late development, Tongnan has learned from the development experience of other regions, as well as paying attention to new industrial methods for pollution and treatment. At the same time, there are territories with flat terrain, fertile soil, and arable land resources in Tongnan.
In addition to the advantaged geographical location and environmental conditions, the factors that can exert the greatest benefits in the ecological function of land use, such as the sustainable industrial models such as tourism (Shizhu model) and industrial ecological management (Tongnan model) are also worth referring and learning.
3.1.2 Land productive functions
Land productive functions can also be divided into three categories, namely, the high score range between 0.6 and 1, which contains only one main district, Yuzhong; the medium score range between 0.1 and 0.6, including Shapingba and the other 5 main districts; and the low score range between 0 and 0.1, including Beibei, Wanzhou, etc., amounting to a total of 31 districts.
It can be seen from the production functions index that the economic development of Chongqing is too concentrated in space, where its distribution is extremely uneven. Relevant research has shown that the economic, infrastructure, and market features have a considerable positive influence on land use efficiency and functions [37]. Capital and talent are too concentrated in the main urban area of Chongqing, which leads to the productive functions of Yuzhong District being higher than those of other districts and counties. At the same time, the districts and counties whose production functions are in the middle level are all adjacent to Yuzhong District. Yuzhong District, as the center of Chongqing’s commercial, financial, information, and culture districts, as well as representing the water and land transportation hub, along with the surrounding areas, is more likely to receive financial support for urban construction, such that this attracts all kinds of talent enterprises. With a long history of development, the appearance of the city is constantly updated and the facilities are perfect, forming a virtuous circle. To be specific, the traffic in these areas is smooth; gathering all kinds of modern service industries and modern commerce and trade industries, and the proportion of the tertiary industry there is large. Additionally, these areas are small in area, the gross GDP is high, and the real estate development trend is good. As a result, the per capita GDP index and per capita real estate output index is much higher than in other districts and counties. It is worth noting that although Yuzhong District has the highest land production function; its land ecological function is the lowest.
3.1.3 Land living functions
Similarly, the results of the living factor also have three grades, namely, the high score range between 0.6 and 1, also containing Yuzhong only; the medium score range between 0.2 and 0.6, including Jiangbei, Yubei, and some other districts; and the low score range between 0 and 0.2, including Hechuan, Tongliang, and the other remaining areas.
Corresponding to the production functions, the living functions of Yuzhong District are still much higher than in other areas. However, the middle level of the region is more widely distributed, mainly located in the main city, the southwest side of the main city, and Wanzhou District in the northeast. These areas have medium urbanization rates and large resident populations. Therefore, this has promoted the construction level of better urban living facilities, more per capita road area, and better educational resources. Particularly, although Wanzhou District is far away from the main urban areas, it is located in the belly of the Three Gorges Reservoir Region, which is the material distribution center of east Sichuan, northeast Chongqing, east Hubei, west Shanxi, south Guizhou, east Hunan, and west Hunan. The railway, highway, port, airport, and bridge construction projects there are relatively complete. The area has also absorbed the population of northeast Chongqing and Dazhou in Sichuan. It can be seen that its living facilities offer a better investment and can obtain enough funds for urban renovation and upgrades.
It can be observed from the analysis above that the spatial distribution of the LUFs of Chongqing is extremely unbalanced. The land productive functions weaken gradually outward from the main urban area with a great difference, showing a strong polarization effect, while the land ecological functions show the opposite. The changing trend of the LUFs is consistent with that of productive functions. The distribution characteristics of it are caused by the differences in traffic conditions, geographical locations, natural conditions, economic levels, spatial function positioning, and planning policies. Overall, the ecological, living, and production functions in Chongqing have not been developed synchronously.
3.2 Evaluation grade of comprehensive LUFs in Chongqing city
According to the evaluation index system, it can be concluded that the productive functions are the most important factor affecting the comprehensive LUFs, while the second factor is the data of living functions and the least is the data of ecological functions. Among the evaluation factors, the factors with greater weight are the “public library collection per unit area” (C19), the “density of population” (C14), the “total retail sales of consumer goods per unit area” (C13), and the “output of local average real estate” (C9). Due to the differences in development conditions and the goal of development in each county, there are great differences in the number of these indicators, which indicates that the comprehensive LUFs in the districts and counties of Chongqing are not balanced in terms of space.
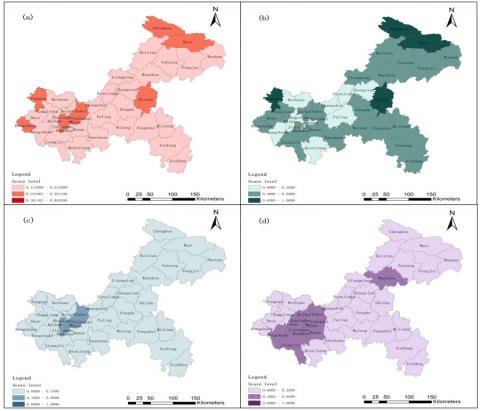
Based on these diagrams (Figure 4 and Figure 5), comparative analysis, and references to related research results, we can provide a regional comparison combined with the specific situation of the regional development. Thus, the comprehensive LUFs have been divided into the following three grades, listed below.
The high score area includes Yuzhong only. Yuzhong is one of nine main urban areas of Chongqing, the smallest area, with more superior location conditions. It is located in the urban center of Chongqing and the interchange of Yangtze River and Jialing River, and the urbanization rate is 100%. As the land in this area bears much more economic activities and social activities, the economy develops rapidly, where the land productive and living functions in Yuzhong are above the rest of the districts studied here. However, due to the lack of natural resources, small area, and high urbanization rate, the land ecological functions are the lowest here.
Figure 4. Hierarchical figures: (a) The hierarchical figure of LUFs functions; (b) the hierarchical figure of land ecology functions; (c) the hierarchical figure of land production functions; (d) the hierarchical figure of land living functions
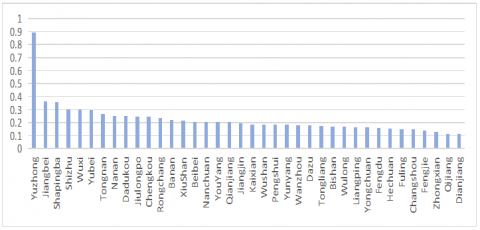
Figure 5. The line chart of each district’s LUFs
The medium score area includes 11 districts (counties). The LUFs can be divided into two categories, namely, areas with strong ecological functions but weak productive and living functions, and areas with weak ecological functions and middling production and living functions. The former type mainly includes Chengkou, Wuxi, Shizhu, Tongnan, and Rongchang, which can be found along the border of Chongqing. They are scattered at the junction of the northeast, east, and west of Chongqing with the neighboring provinces. The latter type mainly includes Nanan, Shapingba, the Dadu port area, Jiulongpo, and Jiangbei, which are close to Yuzhong District. They are located in the center of Chongqing, the same as Yuzhong, which is the metropolitan area, so the land productive and living functions are relatively high. Further, the areas are carrying on the population and the industry transfer and the diffusion of Chongqing, so there is much space for further improvement.
Shizhu, Wuxi, Tongnan, Chengkou, and Rongchang are not economically developed areas, and their productive functions are at a low level. However, due to the high ecological functions there, they are the natural ecological greenway to maintain the ecological security of the metropolitan area, which will mainly play a role in the ecological maintenance function in the future.
The low score area includes Banan, Beibei, Xiushan, Nanchuan, Youyang, and the other 26 districts. These districts are relatively large in size, but due to the limitation of a mountainous terrain topology and location statuses that are not in the dominant position, most of them have a limited degree of development. They will continue to carry out population and industry transfer and diffusion from developed areas from as far as possible and give full play to their ecological maintenance functions at the same time.
3.3 The evaluation results of the LUFs of Chongqing
3.3.1 The LUFs of Chongqing are extremely unbalanced in space
According to the data processing and analysis above, the LUFs of Chongqing can be classified as high, medium, and low score grades, and the overall distribution pattern shows a greater polarization effect. The intensity of it gradually weakens from the center’s main urban areas and then outward due to the geographical location, resources, and the differences of spatial policy, which leads to the comprehensively unbalanced regional development.
Chongqing is located in southwest China and along the upper reaches of the Yangtze River. The main urban area is at the intersection of the Yangtze River and Jialing River, with an excellent geographical location and traffic conditions. It is the center of Chongqing’s developed economic area. The production function of land resources has been fully exploited here, and a typical "point to axis" development pattern has gradually developed into a network structure after spreading. The several main urban areas in central Chongqing have superior geographical conditions, so they are inevitably positioned as the centers of economic development. Therefore, the intensive use of land has a significant effect, the economic production activities are prosperous, and the comprehensive LUFs are high.
In other districts where the LUFs are low due to terrain reasons, the production and living functions of land are limited due to the large area of hills and mountains. The districts spreading out from the central region are relatively weakened because of their positioning and function of economic production and development, and the characteristics of more natural resources and higher forest coverage (such as Shizhu and Wuxi, etc.) reflect their ecological service functions, thus reducing their LUFs. However, the low intensity of land development leads to the maintenance of their ecological functions at a relatively strong level.
Overall, the spatial heterogeneity of Chongqing is at a high level.
3.3.2 Indicators of productive factors have the greatest impact on the evaluation value of the LUFs
According to the principle of information entropy, the higher the entropy value is, the stronger the disorder degree of the evaluation element is and vice versa. The weight of the productive factor layer (B2) accounts for 0.5316, more than half of 1, indicating that the indicators of this layer have the greatest impact on the evaluation value of the LUFs. The changing trend of LUFs in Chongqing is also roughly consistent with the changing trend of land productive functions. Consistent with scarce urban land resources, the evaluation of the productive land use intensity is crucial for sustainable urban land use [38]. It can be seen that the developed degree of economic production in a region can largely reflect the functions of its land resources.
3.3.3 The productive and living functions gradually weaken outwards from the main city, while the ecological functions are reversed
It can be seen that there are differences among the different factors according to the superposition analysis of the scoring results and the cluster chart, namely, where the land productive and living functions gradually weaken from the main city to the outside, while the land ecological functions show the opposite. The results show that the relationship between the development of economic production and ecological protection is not well balanced in land use development, which leads to the reverse correlation between the two.
4.1 Research value of this paper
This study deeply analyzed the distribution characteristics and formation reasons of land use function of each district in Chongqing, and constructed the evaluation model and index system of LUFs from three aspects of ecology, production and living, which can better reflect the complex interaction between multiple functions of land use.
Compared with existing studies:
Firstly, in terms of research content, this study considers the comprehensive functions of production, ecology and living of land use, rather than analyzing only one unilateral function. Like most studies, this study examines the LUFs at the mesoscale of administrative district. In addition, there are relatively few related studies on mountainous cities. Chongqing is a typical mountainous city, mainly characterized by complex topographic fluctuations and multi-level urban spatial structure, and its LUFs is different from other plain cities. Therefore, this study can be used as a reference for similar mountain city land use research.
Secondly, in terms of research methods, due to different research purposes and emphases, the classification system and evaluation index system of LUFs have not formed a unified framework in existing studies, but most scholars select evaluation indexes from three dimensions of economy, society and environment. In reference, on the basis of existing research, this study gave full consideration to the index system of regional differences, constructed "production-living-ecological evaluation index system, make the production in Chongqing space, living space and ecological space recognition more accurate, in line with the national policy direction, which is of important guiding significance for land use planning for the future.
Thirdly, in terms of the research results, this study concluded that the LUFs in Chongqing reflects spatial heterogeneity, and the urban development mode with land as the carrier is "point-axis" type and is gradually developing into a network structure. In addition, this study also believes that the productive function of land plays the most important role in urban development, that is, land should bear more economic activities to maximize the utilization of land resources, but it is difficult to balance the productive function and ecological function of land.
In future studies, we should try to establish a standard index system that can accurately describe the multi-function of land use, and improve it in data selection and weight assignment. In order to make the evaluation result more accurate, it should also be the focus of future research to realize the micro-scale specific to the plot or grid in the research unit.
4.2 Policy implications
According to different levels of LUFs, differentiated land development and utilization guidance and control should be carried out in terms of ecological, productive, and living functions, and sustainable land use promotion strategies should be formulated to optimize the spatial distribution of land resources.
On the basis of maintaining the city functions, elucidating how to strengthen urban green spaces and improve ecological benefits should be considered in high LUFs areas, especially high land productive function area. In areas with high land ecological functions but low productive functions, it is necessary to consider how to continue to safeguard the ecological conservation functions, implement the development concept of "clear waters and green mountains are gold and silver", and rationally develop and utilize existing land resources, avoid extensive land use, and promote production and development. At the same time, national land and space planning should pay more attention to improving the land living functions and increase investment and policy support for rural infrastructure, such as education, healthcare, and social security, thereby improving residents’ living environments and constructing beautiful villages. The government is supposed to make great efforts to develop agricultural tourism and eco-tourism by using existing green ecological resources to ensure that the development of urban and rural residents enjoy equal opportunities. Finally, controlling soil erosion should be taken into account, a serious problem in Chongqing which is an important obstacle to the sustainable development of ecological functions in this area [39].
4.3 Limitations and future research
Additionally, due to the availability of data, this article selected relevant data from Chongqing for evaluation in 2017 and has only conducted a comparative study of spatial differences, which does not reflect the holistic changes in the space–time dynamics there. This may have inadvertently discarded some other better indicators while selecting some that indirectly reflect the situation of given LUFs. Further improvements in subsequent studies will have greater research and reference value.
In this paper, through a state–space model, an index system for evaluating "ecology–production–life" LUFs is constructed reasonably here, and the entropy weight method has been used for weight distribution. Through the calculation and operation of the data, the score values and spatial differentiation characteristics of the LUFs in the districts and counties of Chongqing have been obtained. The results show that, firstly, the scores of LUFs in Chongqing can be divided into three grades, namely, the high score range between 0.6 and 1, the medium score range between 0.3 and 0.6, and the low score range between 0 and 0.3. Secondly, the scores of the LUFs in Chongqing present a spatial differentiation effect that gradually weakens from the main urban area to the surrounding districts and counties, which is consistent with the spatial change form of the land production functions, but contrary to the spatial change form of the land ecological functions. Thirdly, the LUFs in Chongqing shows a strong polarization effect numerically, which reflects the imbalance of land use and development in Chongqing.
Through the analysis and discussion above, this paper proposes the following suggestions: first, the government should rationally utilize the land production functions of the main urban areas with high production functions to improve the land use efficiency and further enhance the ecology and improve the quality of green living spaces, where then the urban development will be more sustainable under the constraints of ecological and cultivated protection. Second, in the surrounding districts and counties with low comprehensive LUFs and underdeveloped land, the planning policy is supposed to continue to maintain their green conservation function and exploit resources such as eco-tourism, so as to promote economic development and improve the land production functions.
This work was supported by the China Postdoctoral Science Foundation (2015M572435), the Chongqing Social Science Planning Project (2019QNGL21), the National Natural Science Foundation of China (No. 41901232; 41930757).
[1] Steffen, W., Crutzen, P.J., McNeill, J.R. (2007). The Anthropocene: Are humans now overwhelming the great forces of nature. AMBIO 2007, 36: 614-621. http://dx.doi.org/10.1579/0044-7447(2007)36%5B614:TAAHNO%5D2.0.CO;2
[2] Liao, G., He, P., Gao, X., Deng, L., Zhang, H., Feng, N., Zhou, W., Deng, O. (2019). The production–living–ecological land classification system and its characteristics in the hilly area of Sichuan Province, southwest China based on identification of the main functions. Sustainability, 11: 1600. https://doi.org/10.3390/su11061600
[3] Peng, L., Wang, X.X. (2019). Multifunctional land‐use value mapping and space type classification: A case study of Puge County, China. Natural Resource Modeling, 2(13): 1-24. https://doi.org/10.1111/nrm.12212
[4] Mander, W.U., Iggering, H., Helming, KE. (2007). Multifunctional Land Use: Meeting Future Demands or Landscape Goods and Services. Berlin Heidelberg: Springer-Ver Lag. https://doi.org/10.1007/978-3-540-36763-5_1
[5] Sullivan, L.O., Creamer, R.E, Fealy, R., et al. (2015). Functional land management for managing soil functions: A case study of the trade-off between primary productivity and carb on storage in response to the intervention of drainage systems in Ireland. Land Use Policy, 47: 42-54. https://doi.org/10.1016/j.landusepol.2015.03.007
[6] Huang, A., Xu, Y.Q., Hao, J.M., Sun. P.L., Liu, C., Zheng, W.R. (2017). Development and prospect of multifunctional evaluation of land use. China Land Science, 31(4): 88-97. https://doi.org/10.11994/zgtdkx.20170315.133056
[7] Pérez-Soba, M., Petit, S., Jones, L. (2008). Land use functions — a multifunctionality approach to assess the impact of land use changes on land use sustainability. In: Helming K., Pérez-Soba M., Tabbush P. (eds) Sustainability Impact Assessment of Land Use Changes. Springer, Berlin, Heidelberg. https://doi.org/10.1007/978-3-540-78648-1_19
[8] Wiggering, H., Dalchow, C., Glemnitz, M., et al. (2006). Indicators for multifunctional land use: Linking socio-economic requirements with landscape potentials. Ecological Indicators, 6(1): 238-249. https://doi.org/10.1016/j.ecolind.2005.08.014
[9] De, G. (2006). Rudolf. Function-analysis and valuation as a tool to assess land use conflicts in planning for sustainable, multi-functional landscapes. Landscape and Urban Planning, 75(3/4): 175-186. https://doi.org/10.1016/j.landurbplan.2005.02.016
[10] Kienast, F., Bolliger, J., Potschin, M., et al. (2009). Assessing land-scape functions with broad-scale environmental data: Insights gained from a prototype development for Europe. Environmental Management, 44(6): 1099-1120. https://doi.org/10.1007/s00267-009-9384-7
[11] Paracchini, M.L., Pacini, C., Jones, M.L.M., et al. (2011). An aggregation framework to link indicators associated with multi-functional land use to the stakeholder evaluation of policy options. Ecological Indicators, 11(1): 71-80. https://doi.org/10.1016/j.ecolind.2009.04.006
[12] Li, G.D., Fang, C.L. (2016). Quantitative identification and analysis of urban ecological-production-living spatial functions. Geography, 71(1): 49-65. https://doi.org/10.11821/dlxb201601004
[13] Barbie, E.B., Koch, E.W., Silliman, B.R., et al. (2008). Coastal ecosystem-based management with nonlinear ecological functions and values. Science, 319: 321-323. https://doi.org/10.1126/science.1150349
[14] David, A. (2004). Multifunctionality, agricultural policy, and environmental policy. Agric. Resour. Econ. Rev., 33: 8-17. https://doi.org/10.1017/S1068280500005591
[15] Schober, B., Helming, K., Wiggering, H. (2010). Assessing land use change impacts: A comparison of the SENSOR land use function approach with other frameworks. Journal of Land Use Science, 5(2):159-178. https://doi.org/10.1080/1747423X.2010.485727
[16] Aubry, C., Ramamonjisoa, J., Dabat, M.H., et al. (2012). Urban agriculture and land use in cities: An approach with themultifunctionality and sustainability concepts in the case of Antananarivo (Madagascar). Land Use Policy, 2012(2): 429-439. https://doi.org/10.1016/j.landusepol.2011.08.009
[17] Callo-Concha, D., Denich, M.A. (2014). Participatory framework to assess multifunctional land-use systems with multicriteria and multivariate analyses: A case study on agrobiodiver sity of agroforestry systems in Tomé Açú, Brazil. Change and Adaptation in Socio-EcologicalSystems, 1(1):40-50. https://doi.org/10.2478/cass-2014-0005
[18] Kates, R.W., Clark, W.C., Corell, R., et al. (2001). Sustainability science. Science, 292(5517): 641-642. https://doi.org/10.1126/science.1059386
[19] Xue, Z., Zhen, L. (2018). Impact of rural land transfer on land use functions in western China’s Guyuan based on a multi-level stakeholder assessment framework. Sustainability, 10(5): 1376. https://doi.org/10.3390/su10051376
[20] Wang, F., Dong, Y.X. (2015). Dynamic evaluation of land use and diagnosis of obstacle factors based on grey relational projection method: A case study of Guangzhou. Journal of Natural Resources, 30(10): 1698-1713. https://doi.org/10.11849/zrzyxb.2015.10.009
[21] Zhen, L., Wei, Y.J., Xie, G.D., et al. (2010). A regional analysis of the multifunctional dynamics of land use in China. Journal of Ecology, 2010(24): 6749-6761.
[22] Taleai, M., Sharifi, A., Sliuzas, R., et al. (2007). Evaluating the compatibility of multi-functional and intensive urban land uses. International Journal of Applied Earth Observation and Geoinformation, 9(4): 375-391. https://doi.org/10.1016/j.jag.2006.12.002
[23] Reidsma, P., Knig, H., Feng, S., et al. (2011). Methods and tools for integrated assessment of land use policies on sustainable development in developing countries. Land Use Policy, 28(3): 604-617. https://doi.org/10.1016/j.landusepol.2010.11.009
[24] Cai, E.X., Jing, Y., Liu, Y.L., Yin, C.H., Gao, Y., Wei, J.Q. (2018). Spatial-temporal patterns and driving forces of ecological-living-production land in Hubei Province, central China. Sustainability, 10(1): 66. https://doi.org/10.3390/su10010066
[25] Xiang, H., Yang, QY., Su, K.C., et al. (2019). Spatiotemporal dynamics and obstacles of the multi-functionality of land use in Xiangxi, China. Applied Sciences, 9(18): 3649. https://doi.org/10.3390/app9183649
[26] Zhang, J., Fu, M., Zhang, Z., Tao, J., Fu, W. (2014). A trade-off approach of optimal land allocation between socio-economic development and ecological stability. Ecol. Model., 272: 175-187. https://doi.org/10.1016/j.ecolmodel.2013.10.008
[27] Hu, J.T. (2012). Unswervingly advance along the path of socialism with Chinese characteristics and strive to complete the building of a moderately prosperous society in all respects. Report on the 18th National Congress of The Communist Party of China. Jianghuai, 2012(11): 4-20.
[28] Liu, Y., Zeng, C., Cui, H., Song, Y. (2018). Sustainable land urbanization and ecological carrying capacity: A spatially explicit perspective. Sustainability, 10(9): 3070. https://doi.org/10.3390/su10093070
[29] Huang, J.C., Lin, H.W., Qi, X.X. (2017). Progress in the study of Sansheng space for land space optimization. Progress in Geography, 36(3): 378-391.
[30] Du, J.Q., Wang, J.S., Zhang, T., et al. (2008). A study on environmental-friendly land use evaluation in Chongqing. China Land Science, 22(12): 17-24. https://doi.org/10.3969/j.issn.1001-8158.2008.12.003
[31] Hua, J., Tu, J.J., Lu, D.B., Zhang, G., Yang, A.Q. (2012). Spatiotemporal difference analysis of regional economic development in Chongqing. Journal of Southwest University (Natural Science Edition), 34(4): 129-133.
[32] Chongqing Municipal Bureau of Statistics (CMBS). Chongqing Statistical Yearbook 2016.
[33] Zhang, X. (2014). Evaluation of Sustainable Utilization of Land Resources in Chongqing. Chongqing University, 10-32.
[34] Deng, B., Hong, F.Z., Long, R.J. (2003). Regional ecological carrying capacity of quantitative method research review. Journal of Gansu Agricultural University, 2018(3): 281-289.
[35] Han, Z.L., Di, Q.B., Liu, K. (2006). Research on the theories and assessment method of carrying capacity of marine region. Areal Research and Development, 25(1): 1-5.
[36] Yang, Y.J., Song, G., Lu, S. (2020). Assessment of land ecosystem health with Monte Carlo simulation: A case study in Qiqihaer, China. Journal of Cleaner Production, 250: 119522. https://doi.org/10.1016/j.jclepro.2019.119522
[37] Zhu, X.H., Zhang, P.F., Wei, Y.G., Li, Y., Zhao, H.R. (2019). Measuring the efficiency and driving factors of urban land use based on the DEA method and the PLS-SEM model—A case study of 35 large and medium-sized cities in China. Sustainable Cities and Society, 50: 101646. https://doi.org/10.1016/j.scs.2019.101646
[38] Yin, G.Y., Lin, Z.L., Jiang, X.L., Qiu, M.L., Sun, J. (2020). How do the industrial land use intensity and dominant industries guide the urban land use? Evidences from 19 industrial land categories in ten cities of China. Sustainable Cities and Society, 53: 101978. https://doi.org/10.1016/j.scs.2019.101978
[39] Zhang, X. (2014). Evaluation and countermeasures of sustainable utilization of land resources in Chongqing. Chongqing University, 10-32.