Mehmet Çanakcı
© 2021 IIETA. This article is published by IIETA and is licensed under the CC BY 4.0 license (http://creativecommons.org/licenses/by/4.0/).
OPEN ACCESS
The research is focused on investigating the influence of oil price fluctuation and different selected macroeconomic indicators on the economic growth of selected G20 countries. The research simply applied descriptive analysis technique as well as regression analysis technique by using a random effect model and Pearson correlation analysis technique to investigate formulated objectives. Results of the research suggested that oil prices and GDP in selected G20 countries have a negative relationship with each other. Results of the research further suggested that the broad money, balance of payment and inflation have a negative impact on the exchange rate of selected G20 countries. These results suggest that it is important for selected G20 countries to make sure to decrease the oil rents and maintain oil prices to have overall positive impact on the economy. Overall, results of the research suggest that a decrease in oil prices can be a significant factor for having a positive influence on the economic growth and progress of selected G20 countries.
economic growth, oil prices, broad money, inflation, Cobb-Douglas production function
As economic growth is predominantly dependent on the increase in oil production and exports, possible decreases or increases in oil prices are one of the main determinants of growth. It also appears to be an important risk factor in the economic performance of countries.
One of the tools that plays a role in realizing the industrialization and development themed goals of the countries is undoubtedly Energy. The importance of oil in energy resources has continued and will continue until today due to the increase in its use. It is one of the important risks that a country is dependent on imports in oil consumption and that it affects the macroeconomic outlook, especially inflation, due to possible price changes.
The economic performance relationship of a commodity such as Petroleum is regarded as an important assessment in terms of observing the changes that will occur due to the global financial risks of the countries and the low growth rate expected in global economies. The increase in the price of this commodity, which is widely used worldwide, directly increases the prices of basic goods through the cost channel. As a result of this, an economic result cycle that will lead to a decrease in tax revenues will occur, along with the suppression of domestic demand in a possible demand inflation, which we encounter with supply and demand inflation. Different researchers have investigated the relationship prevailing between oil price fluctuation and economic growth in different developing as well as developed countries. Studies have also investigated the relationship prevailing between oil price fluctuation and economic growth in oil-exporting and producing countries. This research is focused on investigating the role of oil price fluctuation and different selected macroeconomic indicators on the economic growth of selected G20 countries. The research selected different variables to investigate them in this research. These variables include GDP, oil prices, gross fixed capital formation, labor force availability, exchange rate, broad money, the balance of payment, and inflation rate. The research simply applied descriptive analysis technique, correlation analysis technique, and regression analysis technique by utilizing random effect model to investigate the influence of selected macroeconomic indicators and oil price fluctuation on the economic growth of selected G20 countries.
Crude oil is considered to be one of the most important types of sources or available for energy and it is considered to be contributing approximately one-third towards the overall energy consumption of the globe. Especially when we look at the oil-exporting countries in terms of economic consequences, the increase in oil prices increases the direct export revenues of these countries, creates income transfer from the oil-importing countries to the oil-exporting countries and thus positively affects the national income.
It is important to conduct studies related to crude oil price fluctuation's influence on the economic growth of developing as well as developed countries looking towards its consumption rate. Because, the effect of continuous increases in oil prices is felt more especially in economies that have structural problems along with the triggering of inflation and have problems in the balance of payments, which have high dependency on foreign exchange and budget deficits are covered by borrowing. The importance of this research can be highlighted from the fact that during the recent coronavirus pandemic situation, most of the countries were forced to implement 24 hours lockdown, and movements were restricted for most of the population due to which crude oil consumption is negatively influenced and reduced significantly. This reduction in the consumption of crude oil around the globe is responsible for reducing crude oil prices around the globe. This research is important from this perspective as well as it will investigate the influence of crude oil prices and related macroeconomic indicators on the economic performance of selected G20 countries during the coronavirus pandemic situation [1].
Oil is considered to be the lifeblood for industrialized countries around the globe. It has become the most important source of energy for most of the countries around the globe since 1950. Keeping in mind the consumption and importance of this commodity, it is important to conduct relevant studies to investigate the influence of oil price fluctuation on its consumption and its role in the economic performance of different countries around the globe. Limited studies have been conducted and passed concerning G20 countries in this regard while several studies have been conducted related to different other regions around the globe which includes European countries, United States, United Kingdom, China, and other developing as well as developed countries [2].
Due to the reliability of the data and limited analysis, the research was conducted only to evaluate the relationship between some macroeconomic variables and oil prices in selected G20 countries between 2000 and 2018. The aim of this study is to try to answer the question of how the macroeconomic outlook in selected countries is affected by the volatility of oil prices. For this reason, future studies can increase the timeline to formulate better results and an increase in the timeline will help to generalized results in the future. Future studies can also include other macroeconomic variables to investigate their influence on the economic performance of G20 countries as it will help to contribute significantly towards this research gap. These macroeconomic variables included in this research have been selected because of the availability of data. Data is easily available for most of these variables on different databases due to which it is easy to select them in this research for analysis and to investigate formulated objectives.
Different studies have been conducted and passed investigating the relationship prevailing between crude oil prices and their influence on different macroeconomic variables in different countries around the globe. Generally speaking, the increase in oil price is mainly because of the increase in the level of inflation and is responsible for the reduction of economic activities around the globe. Oil prices are responsible for directly applying influence on prices of different goods and services which are based on petroleum-related products. Products that are based on petroleum-related products are responsible for being directly influenced by oil price fluctuation in the international market. Oil prices are also responsible for influencing costs related to other products and services associated with transportation, manufacturing, and other related sectors which are indirectly associated with crude oil utilization. It is important to conduct studies to investigate the consequences of crude oil price fluctuation on different macroeconomic indicators and economic progress in different countries around the globe.
Different studies have been conducted in past investigating the relationship prevailing between crude oil price fluctuation and economic performance in different countries around the globe. Limited studies have been conducted concerning G20 countries. G20 is considered to be one of the most significant fora for international economic collaboration and trading. It is important to conduct studies in this regard to provide relevant results related to the economic growth of G20 countries for policymakers. It will help the policymakers to formulate policies accordingly as they will be able to required information related to the influence of oil price fluctuation and related macroeconomic indicators on the economic performance of selected G20 countries [3].
The asymmetric effects of oil shocks on economic activities have been identified in several empirical studies: oil price increases are correlated with lower production, but oil price decreases do not lead to higher output growth. The explanations for such asymmetries have been due to the effects of reallocation and the cost of adaptation. On the other hand, lower oil prices are stimulating companies' output and households' consumption, but sectoral reallocations in the opposite direction are slowing down growth. Moreover, the cost of labor market changes due to the downward rigidity of nominal wages (which would have increased following hikes in oil prices) suggests that nominal wages are not declining and that the cost of output is still high [4].
This study, based on other studies focusing on how the fluctuations in oil prices affect the economies of developing countries, provides a new perspective for some G20 countries and even newly industrializing countries in the relationship between oil-macroeconomic factors. Focusing on oil importing countries in terms of its results, it enables investors to compare them with other studies and aims to contribute to everyone concerned with these results. Also, It is highly recommended for future researches that they should extend the timeline of the research and include other macroeconomic variables as well to conduct extensive analysis and to generalize the results accordingly.
The results of our analysis will provide a more robust analysis of how oil price volatility has affected the sampling countries, ie economies, in this study.
The rest of this article is organised as follows: the next section describes the literature review. Section 3 presents the research methodology for analysis while in Section 4 we have analysis and results and than discussion and conclusion with the final section concludes.
In general, there exists significant research that addresses the association between different financial and macroeconomic variables, and oil prices. A large number of these researches were performed in countries that import oil. However, fewer studies have been performed in emerging economies and countries that export oil. It is specifically believed that oil prices are capable of influencing macroeconomic variables of nations like industrial production, rates of interest, and GDP or gross domestic product, etc. One of the most fundamental studies on oil prices and economic development is Hamilton's work, it is important in terms of giving a general view on the structures of industrial economies by taking the US economy as a reference. Basically, it defines the relationship between crude oil price increases and falling real GNP growth rate, rising inflation rate and rising average unemployment rate. On the other hand, Hamilton's study determines the strength of the relationship between oil prices and recessions [5].
Also, authors like Huang et al. [6], Sadorsky [7] and Jones and Kaul [8] have determined price changes in oil are significant elements and determinants of returns in the stock market. Actually, from an economic and financial perspective, it is recognized that asset price can be identified by determining expected or future discounted cash flows that are created from an asset. In fact, for instance, with a rise in the oil prices, there will be a reduction in profits and inflation in costs, causing the shareholders' undermining that would, in turn, cause a reduction in stock prices. In net oil-importing nations, this would be the situation but most studies differentiate between exporting and importing nations.
In their research, Filis and Chatziantoniou [9] compared net oil importing and exporting nations about the influence of fluctuations and changes in oil price on their monetary and financial policies. It is determined that inflation level is influenced greatly by innovations in oil rates in both nations and rates of interest rely on the regime of monetary policy in each nation.
The transmission methods of fluctuations in oil rates to different stock markets were explained by Elwood [10] through the AS/AD framework. It is explained by him that in an exporting nation, an increase in prices of oil will result in a rise in investment and consumption, which will in term increase stock prices. Furthermore, rates of oil are predicted to have both indirect and direct adverse effects on the performance of the stock market. A risk factor is a direct effect for financial markets that are formed by oil rates (Jones and Kaul) Meanwhile, the indirect effect is specifically the influence of inflation levels on the performance or efficiency of the stock market. These relations have been documented in many types of research such as O'Neill et al. [11], Chen [12], Arouri and Rault [13] and Filis [14].
These studies have identified that in exporting nations, the performance of stock markets is positively influenced by positive shocks in oil rates.
In the article of researchers such as Nandha and Brooks [15] and Lee and Chiou [16] stock markets’ asymmetric response towards shocks in oil prices has been determined and it determines that stock markets tend to exhibit a tendency and sensitivity to positive changes in oil prices. For exporting nations, the opposite applies. It has been identified by Hamilton [17] that shocks in oil rates can either develop from different industrialization nations such as China or lack of immediate and rapid response to the market demand. It has been argued by Kilian and Park [18] that shocks in oil rates might develop from different and diverse aggregate demand-side changes; these are precautionary demand changes that emerge from future oil supply's uncertainty based on future supply-side changes and oil demands.
Actually, among the researches that consider GCC economies are Bley and Chen [19] and Al-Khazali et al. [20]. Hammoudeh and Choi [21] determined and focused on bilateral causal relations in the short run between oil rates and stock index returns in GCC. It was determined by them that rates of oil do not have a direct influence on these specific markets but Maghayreh and Al-Kandari [22] have identified that rates of oil have a great influence on stock markets in the long run. GCC has been targeted by several researchers including Arouri for better comprehending these economies because they are quite critical players in the oil market and they create an opportunity for foreign investors who need to comprehend the functionalities of these markets.
The relation between oil prices and GCC stock markets was investigated by Arouri and Fouquau [23] with the use of the non-parametric technique. It was determined by them that Qatar, UAE, and Oman exhibited asymmetric responses to changes in oil rates. GCC stock markets' sensitivity was studied by Arouri and Rault towards the changes in oil rates and they determined that changes in oil rates tend to cause stock price shifts, offering statistical evidence in almost every GCC nation with the exception of KSA. It was also determined that there is a bidirectional and causal relationship only in KSA between rates of the stock market and oil rates. Furthermore, further evidence is offered by Arouri et al. [24] that changes in oil rates and their influences are different in each member nation.
The work was extended by Mohanty et al. [25] offering a closer look at the influence of changes in oil rates on stock markets with the use of industry and country levels. It was identified by them that all the stock markets in the GCC with the exception of the Kuwaiti stock market have a positive association with the changes in oil rates. A disadvantage of this research is that it did not consider returns on oil price and the stock market. The relation between GCC stock markets and oil rates was studied by Louis and Balli [26] on a sector and a country level. It was determined by them that investing in hotels and tourism specifically in Bahrain, and the industrial sector in Oman and banking sector in Kuwait is better than considering an investment in the market of crude oil. In the UAE industrial sector investment is as well as investing in the market of crude oil, determining that these stocks’ portfolio would be beneficial than any other nation in the GCC with the same levels of risk.
One of the studies conducted recently Pradhan et al. [27] investigated the relationship prevailing between economic growth, oil price fluctuation, stock market fluctuations, and other related macroeconomic variables by collecting evidence from G20 countries. The research investigated the relationship of these variables in the long run as well as the short-run by simply applying the Novel approach. Results of the research suggested that there prevails long relationship as well as the short-run relationship between different economic variables in G20 countries. The research provided evidence for having the long-run economic relationship between economic growth, oil price fluctuation, stock market fluctuation, inflation rate, effective exchange rate, and the real rate of interest.
Another research by Ftiti [28] was conducted recently investigating the prevailing relationship between crude oil prices and economic growth concerning OPEC countries of The research simply utilized the Revolutionary co spectral analysis technique in order to investigate formulated objectives. The research also applied core integration techniques in order to investigate the influence of oil prices on economic growth and vice-versa in selected OPEC countries. Results of this research clearly suggested that oil price fluctuations which are closely associated with Global Business Cycle are responsible for influencing the relationship prevailing between oil prices and economic growth in selected OPEC countries. This clearly suggests that oil prices are responsible for significantly explaining movement related to economic growth in different OPEC countries
One of the studies by Nwani et al. [29] conducted in the past investigated the relationship prevailing between oil price and development related to financial intermediation in different developing oil-exporting countries. The research collected evidence specifically from Nigeria. The research simply applied an autoregressive distributed lag approach in order to investigate the formulated objectives. Results of this research clearly suggested that crude oil prices can be considered as a significant variable for influencing financial intermediary development in a country like Nigeria. This clearly suggests that oil price fluctuation can be considered as a significant factor for the formulation of government policies and related policies in order to directly influence economic growth in and positive manner. Results of the research suggested that if factors like inflation and economic growth are kept under control then despite this fact, crude oil price fluctuation is responsible for significantly influencing the development related to financial intermediation in countries like Nigeria. These results clearly provide the importance of crude oil price fluctuation in Nigeria.
Another relevant research by Ratti and Vespignani [30] was conducted investigating the relationship prevailing between oil price fluctuation and stock market performance in oil-exporting countries specifically Saudi Arabia. Results of this research provided evidence of having a relationship between stock market performance and oil price fluctuations in Saudi Arabia. The research simply applied the Granger causality technique and regression analysis technique in order to investigate formulated objectives. Results of the research clearly provided evidence that oil price drop in recent years for responsible for negatively influencing the stock market performance in Saudi Arabia.
Another similar research by Mukhtarov et al. [31] was conducted in past investigating the relationship prevailing between oil price fluctuation and global factor macroeconomic variables. The research provided evidence that Global output as well as Global consumer price index and money supply are responsible for having a relationship with each other. Conservative monetary policy was also found to have a close association with a decrease in the level of GDP per consumer price index and oil prices prevailing in the international market. It was also identified in this research is that increase in global liquidity through positive shock is responsible for having a positive influence on output level at the international level as well as consumer price index and all prices Global. Results of this research also suggested that an increase in the level of oil prices at the international level is responsible for increasing interest rates prevailing globally.
Humbatova et al. [32] investigated the effect of oil prices on different macroeconomic variables by collecting evidence from Azerbaijan. The research applied the Johansson co-integration technique and vector error correction model in order to investigate the influence of oil prices on selected macroeconomic indicators which are economic growth, inflation, exchange rate, and export in Azerbaijan. Results of the research clearly suggested that there prevails a long-run relationship between the selected variables in the research. Results of the research further suggested that there prevails a positive and significant relationship between oil prices and selected macroeconomic variables economic growth, inflation, and export for the selected country Azerbaijan. Results indicated that oil prices are responsible for having a negative influence on the exchange rate. This clearly suggests that the exchange rate is an important macroeconomic variable for economic growth for Azerbaijan in relation to oil prices prevailing in the international market.
In the study of Van Eyden et al. [33] The effect of the volatility in oil prices among the Selected OECD Countries on the economic growth of these countries was examined and it was found that there was no statistically significant effect. In the analysis made by Wen et al. [34] it was concluded that crude oil price shocks had a positive effect on China's economic growth and inflation in the short term and that crude oil price shocks during the last global financial crisis had more negative effects on China's economic growth. In another study, Alouli et al. [35] who mentioned that the Saudi economy will create a global risk factor mainly related to the volatility in the oil market and the fixation of the local currency to the US dollar. They stated that economic growth and freedom to pursue an independent monetary policy would be significantly restricted. Udemba et al. [36] revealed in their studies that oil prices have a direct effect on foreign direct investments through trade channels and therefore, the increase in oil prices affected by the oil presence will create a negative pressure on economic growth. According to another study findings reported Kılıcarslan et al. [37] of the rise in crude oil prices in Turkey, stated that inflation and real exchange rate increases and led to a decline in economic growth. Therefore with high oil dependence of countries like Turkey, taking into account the risks from oil price shock, also need to reduce energy dependence on production in order to reduce the negative effects on macroeconomic variables. So it was stated that using renewable energy sources would be important.
A multivariable data analysis are part of the research methods in this article.
3.1 Modeling approach
This research utilizes panel data from secondary sources. The panel data for four G20 countries have been collected for the period from 2000 to 2018. The four countries selected for the analysis are Argentina, Brazil, South Africa, and Turkey. The data for GDP (Gross Domestic Product, oil rents (a proxy for oil prices), gross fixed capital formation (a proxy for capital), labor force, exchange rate, M3 or broad money, inflation, and balance of payment have been obtained from WDI (World Development Indicators) and Federal Reserve Bank of St. Louis.
3.2 Variables
This research tests two different equations. In the first equation, GDP is the dependent variable, and oil rents is an independent variable. The regression includes other traditional and common determinants of economic growth as control variables. These variables are chosen on the basis of economic growth theory i.e. Cobb Douglas Production Function. These control variables are capital and labor. For the second equation, the dependent variable is the exchange rate while the independent variables are broad money, inflation, and balance of payment. The following Table 1 represents the detail of the variables used in this research:
Table 1. Variables used in this research
|
Variable |
Denoted by |
Description |
|
GDP |
GDP |
GDP (constant LCU) |
|
Oil prices proxy by Oil rents |
Oil rents |
Oil rents (% of GDP) |
|
Capital proxy by Gross Fixed Capital Formation |
GFCF |
Gross fixed capital formation (constant LCU) |
|
Labor Force |
LF |
Labor force, total |
|
Exchange rate |
Exrate |
Real effective exchange rate index (2010 = 100) |
|
Broad money |
M3 |
Broad money (current LCU) |
|
Inflation |
Inflation |
Consumer price index (2010 = 100) |
|
Balance of payment |
BOP |
Current account balance (BoP, current US$) |
3.3 Sample and data sources
Secondary panel data is employed in this research for four countries i.e. Argentina, Brazil, South Africa, and Turkey covering the time period from 2000 to 2018. Cobb Douglas Production Function is used to derive the model for Eq. (1).
A Cobb-Douglas production function can be written in the following form.
The Cobbe Douglas production function is a commonly used form of production specification that denotes how the production records in an economy behave as a function of the inputs used in the production.
This model, although not seen as an innovative model. The most important advantages of this form are as follows: it is best known for its accuracy, it can be applied at the level of entire economies and may be used for macro or micro-estimations [38].
$\mathrm{Y}=\alpha_{1} \mathrm{~L}^{\alpha 2} \mathrm{~K}^{\alpha 3}$ (1)
By taking the log of the above equation, the equation become
$\operatorname{LnY}=\alpha_{1}+\alpha_{2} \operatorname{LnL}+\alpha_{3} \operatorname{LnK}$ (2)
The data for all variables is collected from World Development Indicators by the World Bank except for the exchange rate index for Argentina and Turkey. The data of the exchange rate index for Argentine and Turkey is collected from the Federal Reserve Bank of St. Louis because the data for this variable was not available by the World Bank.
3.4 Variable operationalization
In the estimation of this research, GDP is a dependent variable, and oil rents is an independent variable. However, capital and labor force are employed as control variables. The second equation has an exchange rate as the dependent variable while broad money, inflation, and balance of payment are independent variables.
3.5 Empirical model
Henceforth, the Eq. (2) is modified to analyze the concerned variables for this research. To achieve the objective of this study, followed by Luqman et al. [39], with Oryani et al. [38], the Augmented Cobb-Douglas production function was con-structed as equation.
Model 1:
LnGDPt = β1 + β2LnOilRentst + β3 LnGFCFt + β4 LnLFt + εt
Model 2:
LnExRatet = β1 + β2LnM3t + β3 LnInflationt + β4 Lnt BOP + εt
All the variables are collected from 2000 to 2018.
The model can be estimated empirically to find out the role of oil prices and major macroeconomic factors in the economic growth of selected G20 countries. The model is estimated on Stata software and the next section presents the results.
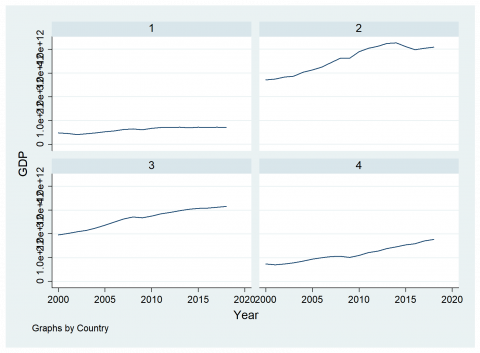
The countries are coded as: Argentine=1, Brazil=2, South Africa=3, Turkey=4.
The following Figure 1 shows the growth of GDP in the chosen G20 countries. It can be seen as this is highest in Brazil and comparatively lowest in Argentina.
Figure 1. Graphical representation of time series of GDP
In the figure above, the GDP of the selected countries is compared. It can be seen that GDP is highest in Brazil as compare to Argentina, South Africa, and Turley. South Africa ranked second as highest GDP followed by Turkey and Argentina.
The recovery after the 2008 global financial crisis, considering that the start of 2010, Turkey has experienced more pronounced than in other countries to sustainable GDP growth. In particular, the decline in foreign investments and economic stagnation after 2013 in Brazil caused GDP shrinkage from 2014 to 2017. This shrinkage is seen in Figure 1. The Argentine economy, on the other hand, has not been able to raise its GDP growth to the desired level yet, but it is known that it sometimes experiences problems with international organizations in terms of financial aid.
The combined GPD growth in chosen G20 countries can be observed in the Figure 1.
4.1 Descriptive analysis
Descriptive Analysis can be expressed as descriptive, descriptive. It is the analytic where we define the data (in particular the variables) and obtain information. Reveals descriptive information about the data.
In the Table 2, it can be observed that the mean value for GDP for selected G20 countries is 1.99, mean value for oil rents is 1.15, mean value for GFC is 3.93, mean value for labor force is 3.91, mean value for exchange rate is 91.90, mean value for money supply is 1.60, mean value for inflation is 56.35, and mean value for the balance of payment is -1.89. However, the highest level of standard deviation is found in variables inflation and exchange rate.
The Table 3 represents the values of panel summary statistics along with between and within values. It can have observed that there are 76 number of observations for 4 countries which means the data does not contain any missing values.
4.2 Correlation analysis
To measure the degree of linear association between two variables, correlation analysis is used. "The coefficient of correlation is shown as "r" and can have values between (-) 1 and (+)1.
The Table 4 represents the correlation analysis for model 1. GDP and GFCF have a strong and positive correlation, GDP and labor force also have a strong and positive relationship. GFCF and LF are positively correlated. The relationship prevailing between GDP and oil price in the international market is identified to be negative.
The Table 5 represents the correlation analysis for model 2. Inflation and balance of payment have a negative relationship which means that increase in the level of inflation is responsible for the decrease in the level of balance of payment for the selected G20 countries and vice-versa. Exchange rate has negative correlation with broad money and inflation while it is positively correlated with balance of payment.
Table 2. Descriptive statistics
|
Variable |
Obs |
Mean |
Std. Dev. |
Min |
Max |
|
GDP |
76 |
1.99e+12 |
1.24e+12 |
4.09e+11 |
4.26e+12 |
|
Oil rents |
76 |
1.151955 |
1.335522 |
.0051024 |
4.673901 |
|
GFCF |
76 |
3.93e+11 |
2.37e+11 |
4.15e+10 |
9.09e+11 |
|
LF |
76 |
3.91e+07 |
3.20e+07 |
1.63e+07 |
1.06e+08 |
|
Exrate |
76 |
91.90684 |
32.9416 |
55.81 |
271.92 |
|
M3 |
76 |
1.60e+12 |
1.54e+12 |
5.75e+10 |
6.56e+12 |
|
Inflation |
76 |
56.35712 |
51.83028 |
-1.095768 |
203.5454 |
|
BOP |
76 |
-1.89e+10 |
2.47e+10 |
-1.01e+11 |
1.40e+10 |
Table 3. Panel summary statistics
|
Variable |
Mean |
Std. Dev. |
Min |
Max |
Observations |
|
|
GDP |
overall |
1.99e+12 |
1.24e+12 |
4.09e+11 |
4.26e+12 |
N = 76 |
|
between |
1.36e+12 |
6.12e+11 |
3.58e+12 |
n = 4 |
||
|
within |
3.79e+11 |
1.12e+12 |
2.68e+12 |
T = 19 |
||
|
Oil rents |
overall |
1.151955 |
1.335522 |
.0051024 |
4.673901 |
N = 76 |
|
between |
1.289923 |
.0787835 |
2.688623 |
n = 4 |
||
|
within |
.7204534 |
-.9908947 |
3.137233 |
T = 19 |
||
|
GFCF |
overall |
3.93e+11 |
2.37e+11 |
4.15e+10 |
9.09e+11 |
N = 76 |
|
between |
2.37e+11 |
1.13e+11 |
6.58e+11 |
n = 4 |
||
|
Within |
1.16e+11 |
1.73e+11 |
6.44e+11 |
T = 19 |
||
|
LF |
overall |
3.91e+07 |
3.20e+07 |
1.63e+07 |
1.06e+08 |
N = 76 |
|
between |
3.64e+07 |
1.82e+07 |
9.35e+07 |
n = 4 |
||
|
within |
4484329 |
2.42e+07 |
5.12e+07 |
T = 19 |
||
|
Exrate |
overall |
91.90684 |
32.9416 |
55.81 |
271.92 |
N = 76 |
|
between |
12.32172 |
75.15076 |
104.5663 |
n = 4 |
||
|
Within |
31.14101 |
44.93506 |
259.2606 |
T = 19 |
||
|
M3 |
overall |
1.60e+12 |
1.54e+12 |
5.75e+10 |
6.56e+12 |
N = 76 |
|
between |
1.22e+12 |
4.58e+11 |
3.25e+12 |
n = 4 |
||
|
within |
1.11e+12 |
-5.95e+11 |
4.91e+12 |
T = 19 |
||
|
Inflation |
Overall |
56.35712 |
51.83028 |
-1.095768 |
203.5454 |
N = 76 |
|
between |
25.29978 |
31.37389 |
88.16094 |
n = 4 |
||
|
Within |
46.90328 |
-28.35744 |
171.7416 |
T = 19 |
||
|
BOP |
Overall |
-1.89e+10 |
2.47e+10 |
-1.01e+11 |
1.40e+10 |
N = 76 |
|
between |
1.49e+10 |
-3.41e+10 |
-2.79e+09 |
n = 4 |
||
|
within |
2.10e+10 |
-9.16e+10 |
1.36e+10 |
T = 19 |
||
Table 4. Correlation analysis for model 1
|
GDP |
Oil rents |
GFCF |
LF |
|
|
GDP |
1.0000 |
|||
|
Oil rents |
-0.1698 |
1.0000 |
||
|
GFCF |
0.9585 |
-0.2572 |
1.0000 |
|
|
LF |
0.7606 |
0.2035 |
0.6981 |
1.0000 |
Table 5. Correlation analysis for model 2
|
Exrate |
M3 |
Inflation |
BOP |
|
|
Exrate |
1.0000 |
|||
|
M3 |
-0.3073 |
1.0000 |
||
|
Inflation |
-0.2276 |
-0.0208 |
1.0000 |
|
|
BOP |
0.1226 |
-0.4799 |
-0.0884 |
1.0000 |
4.3 Regression analysis through random effect model
The random effects (RE, henceforth) regression model is used both in econometrics, where this model is often opposed to the fixed effects (FE, henceforth) regression model (see below), and in statistics, where this model is a special case of multilevel models.
For Model 1:
Number of obs = 76
Group variable: country
Number of groups = 4
R-square = 0.9876
Wald chi2(6) = 70381.15
Prob > chi2 = 0.0000
The Table 6 represents the regression results of model 1. It can be seen that oil rents have negative impact on the GDP of G20 countries which means 1% increase in oil rents will bring approximately 5% decrease in the GDP of selected G20 countries. The value of R square suggests that the oil rents, GFCF, and LF cause approximately 98% variation in the GDP of G20 countries.
For Model 2:
Number of obs = 16
Number of groups = 4
R-square = 0.7033
Wald chi2(4) = 30.48
Prob > chi2 = 0.0000
The Table 7 represents the regression results of model 2. It can be seen that M3, inflation, and BOP have negative impact on the exchange rate of selected G20 countries which means 1% increase in M3, inflation, and BOP will bring approximately 6%, 0.1%, and 7% decrease in the exchange rate of selected G20 countries respectively. The value of R square suggests that the M3, inflation, and BOP cause approximately 70% variation in the exchange rate of selected G20 countries.
Table 6. Least square dummy variables for model 1
|
GDP |
Coef. |
Std. Err. |
z P>z |
[95% Conf. Interval] |
|
|
Oil Rents |
-5.22e+09 |
9.74e+09 |
-0.54 0.592 |
-2.43e+10 |
1.39e+10 |
|
GFCF |
2.044661 |
.0854739 |
23.92 0.000 |
1.877135 |
2.212186 |
|
LF |
37173.57 |
2217.281 |
16.77 0.000 |
32827.78 |
41519.36 |
|
country |
|
|
|
|
|
|
2 |
-9.51e+11 |
1.39e+11 |
-6.86 0.000 |
-1.22e+12 |
-6.79e+11 |
|
3 |
1.18e+12 |
4.43e+10 |
26.71 0.000 |
1.10e+12 |
1.27e+12 |
|
4 |
-1.31e+11 |
3.31e+10 |
-3.97 0.000 |
-1.96e+11 |
-6.65e+10 |
|
_cons |
-2.83e+11 |
4.71e+10 |
-5.99 0.000 |
-3.75e+11 |
-1.90e+11 |
|
_cons |
-2.83e+11 |
4.71e+10 |
-5.99 0.000 |
-3.75e+11 |
-1.90e+11 |
|
sigma_u |
0 |
|
|
|
|
|
sigma_e |
6.028e+10 |
|
|
|
|
|
rho |
0 |
(fraction of variance due to u_i) |
|||
Table 7. Least square dummy variables for model 2
|
Exrate |
Coef. |
Std. Err. |
z P>z |
[95% Conf. Interval] |
|
|
M3 |
-6.85e-12 |
3.90e-12 |
-1.76 0.079 |
-1.45e-11 |
7.94e-13 |
|
Inflation |
-.1455321 |
.088406 |
-1.65 0.100 |
-.3188046 |
.0277404 |
|
BOP |
-7.57e-11 |
1.84e-10 |
-0.41 0.680 |
-4.35e-10 |
2.84e-10 |
|
country |
|||||
|
2 |
-4.48983 |
10.55073 |
-0.43 0.670 |
-25.16888 |
16.18922 |
|
3 |
-1.245924 |
12.90678 |
-0.10 0.923 |
-26.54275 |
24.0509 |
|
4 |
-3.964385 |
17.03339 |
-0.23 0.816 |
-37.34922 |
29.42045 |
|
_cons |
112.0639 |
8.220888 |
13.63 0.000 |
95.95121 |
128.1765 |
|
sigma_u |
0 |
||||
|
sigma_e |
31.570608 |
||||
|
rho |
0 |
(fraction of variance due to u_i) |
|||
The research is focused on investigating the relationship prevailing between crude oil price fluctuation in the international market and different macroeconomic indicators with the economic performance of selected G20 countries. The research successfully applied the correlation analysis technique in order to investigate the relationship prevailing between selected macroeconomic indicators and oil price in selected G20 countries. In order to investigate formulated objectives, the research also applied descriptive analysis technique as well as regression analysis technique by using a random-effect model. The research formulated to empirical models. The first model is associated with investigating the influence of labor factor, gross fixed consumption, and oil price on the GDP of selected G20 countries. The second empirical model is formulated in order to investigate the influence of the balance of payment, inflation, and money on the exchange rate for selected G20 countries. The research collected data for the above-mentioned independent and dependent variables from 2000-2018. Stata software is successfully used in order to investigate the formulated objectives in this research. Descriptive statistics suggested that the mean value for GDP for selected countries is 1.99, min value for oil rents is 1.15, mean value for GFC is 3.93, mean value for labor force is 3.91, mean value for exchange rate is 91.90, mean value for money supply is 1.60, mean value for inflation is 56.35, and mean value for the balance of payment is -1.89.
The descriptive analysis clearly suggested that the highest level of standard deviation is found in variables inflation and exchange rate. This clearly suggests that inflation and exchange rate are responsible for witnessing a high level of fluctuation from 2000 till 2018 for the selected G20 countries in this research.
According to the correlation analysis, the research provided evidence that variables like GDP and GFC have a strong correlation prevailing between them. The research also suggested that GDP and inflation are also responsible for having a strong relationship between them. Correlation analysis also suggested that the relationship prevailing between GDP and GFC is positive and the relationship prevailing between GDP and inflation is also positive. Results also suggested that the relationship prevailing between GFC and inflation is also positive. The relationship prevailing between GDP and oil price in the international market is identified to be negative. This clearly suggests that an increase in oil prices is responsible for a reduction in the level of gross domestic product for the country and vice versa. This clearly provides statistical evidence that oil prices in the international market are closely associated with Gross Domestic Product in any country and is responsible for influencing the overall output of the country. Having low oil prices in the international market is positive for selected G20 countries as low oil prices are responsible for the increase in the output level for most of the selected G20 countries.
When we look at the correlation relationship, inflation and balance of payment have a negative relationship which means that increase in the level of inflation is responsible for the decrease in the level of balance of payment for the selected G20 countries and vice-versa. It is always important for countries to control the increasing inflation rate in order to reduce its negative influence on the balance of payment with the passage of time.
As oil prices rise, local currencies experience a significant depreciation against the US dollar. In particular it has a negative effect on the balance of payments of developing and newly industrializing countries such as Argentina, Turkey, South Africa and Brazil. The study findings also support this. In addition, if we approach the selected G20 countries from another perspective in terms of evaluating the results, we can say that the negative impact of oil prices in these countries creates an investment opportunity for international investors, because although a scenario develops upon the negativity as a result of these price fluctuations, in the last 10 years against the oil price increases. We can understand that developing countries, that is, emerging markets are economies where higher profits can be achieved for investors than developed economies. However although this may seem like an opportunity, the formation of acceptable price levels and the negative effect of oil prices should not exceed the investment return that the investor will bring to the country. Sustainable growth should always be preferred in all developing countries as well as in selected G20 countries. Otherwise foreign capital investments will bring along crises extending from financial markets to terms of trade together with exchange rate volatility in markets where the increase in money supply is uncontrolled, inflationary environment prevails, and balance of payments deficits are unsustainable.
Another research is conducted recently in order to investigate the relationship prevailing between oil prices for activation and GDP growth rate [40]. The research simply utilized the Granger causality technique in order to investigate two-way causality prevailing between oil prices and GDP growth. Results of the research clearly suggested that oil prices are not responsible for causing influence in GDP growth rate and vice-versa. It is identified that all prices and GDP growth rate have a positive relationship suggesting that increase in the level of oil prices will be responsible for the increase in the level of GDP growth rate and vice-versa in countries like Russia, South Africa the United States and China.
Different pieces of evidence are available in literature related to the relationship prevailing between the balance of payment and inflation as macroeconomic variables. Some of the studies conducted in past suggested that the balance of payment and inflation rate are responsible for having a negative relationship with each other. Studies conducted and past clearly suggest that the increase in the deficit of trade balance related to the balance of payment mainly caused by increasing level of imports as compared to exports of the country are responsible for increasing domestic inflation level. This clearly suggests that it is important for the G20 countries to reduce their imports and increase their exports in order to reduce their deficiency related to trade to have a positive influence on the domestic inflation level prevailing
in the economy. Having a low inflation rate will help to positively influence the purchasing power of the general public which will eventually improve the domestic economy with the passage of time [31].
Studies have also investigated the relationship prevailing between oil prices and inflation prevailing in different economies around the globe. Some of the studies suggested that an increase in oil prices is mainly due to an increase in the level of inflation and a reduction in the level of economic growth. As far as inflation is concerned, oil prices are responsible for directly influencing the prices related to goods that are formulated by the utilization of Petroleum related products and services. An increase in the level of oil prices can negatively influence the supply of goods and services consuming petroleum-related raw material because their cost of production will increase which will force manufacturers to reduce their manufacturing level in order to sustain in the market [41].
Crude oil is considered to be one of the most important types of energy resource. Most of the countries are now shifting their focus towards renewable and alternative energy resources as crude oil is considered to have a negative influence on the environment and is not recommended by environment-friendly organizations and bodies at the international level. That is why it is highly recommended that future studies should focus on discussing the influence of alternative energy resources and renewable energy resources on macroeconomic indicators in countries around the globe. The research should also focus on conducting analysis for the relationship prevailing between alternative energy resources and economic growth of different countries around the globe. Most of the European countries are also shifting their focus towards the consumption of alternative and renewable energy resources due to which the importance of these types of energy resources is increasing with the passage of time. An increase in consumption of alternative and renewable energy resources will reduce the demand for crude oil which will eventually reduce the price of crude oil in the international market.
[1] World Bank. (2020). Impact of COVID-19 on Commodity Markets Heaviest on Energy Prices; Lower Oil Demand Likely to Persist Beyond 2021. https://www.worldbank.org/en/news/press-release/2020/10/22/impact-of-covid-19-on-commodity-markets-heaviest-on-energy-prices-lower-oil-demand-likely-to-persist-beyond-2021, accessed on Jan. 10, 2021.
[2] UKOG. (2020). Why oil is important. https://www.ukogplc.com/page.php?pID=74#:~:text=Oil%3A%20lifeblood%20of%20the%20industrialised,people%20all%20over%20the%20world, accessed on Jan. 10, 2021.
[3] Hassan, R. (2020). The view from Brazil: Closing the inequality gap. https://www.arabnews.com/node/1759511/business-economy, accessed on Jan. 10, 2021.
[4] Iwayemi, A., Fowowe, B. (2011). Impact of oil price shocks on selected macroeconomic variables in Nigeria. Energy Policy, 39(2): 603-612. https://doi.org/10.1016/j.enpol.2010.10.033
[5] James, D.H. (1983). Oil and the Macroeconomy since World War II. The Journal of Political Economy, 91(2): 228-248. https://doi.org/10.1086/261140
[6] Huang, R.D., Masulis, R.W., Stoll, H.R. (1996). Energy shocks and financial markets. The Journal of Futures Markets (1986-1998), 16(1): 1-27. https://papers.ssrn.com/sol3/papers.cfm?abstract_id=900741.
[7] Sadorsky, P. (1999). Oil price shocks and stock market activity. Energy Economics, 21(5): 449-469. https://doi.org/10.1016/S0140-9883 (99) 00020-1
[8] Jones, C.M., Kaul, G. (1996). Oil and the stock markets. The Journal of Finance, 51(2): 463-491. https://doi.org/10.1111/j.1540-6261.1996.tb02691.x
[9] Filis, G., Chatziantoniou, I. (2014). Financial and monetary policy responses to oil price shocks: Evidence from oil-importing and oil-exporting countries. Review of Quantitative Finance and Accounting, 42(4): 709-729. https://doi.org/10.1007/s11156-013-0359-7
[10] Elwood, S.K. (2001). Oil-price shocks: Beyond standard aggregate demand/aggregate supply analysis. The Journal of Economic Education, 32(4): 381-386. https://doi.org/10.1080/00220480109596116
[11] O’Neill, T.J., Penm, J., Terrell, R.D. (2008). The role of higher oil prices: A case of major developed countries. In Research in Finance. Emerald Group Publishing Limited. https://doi.org/10.1016/S0196-3821(07)00211-0
[12] Chen, S.S. (2010). Do higher oil prices push the stock market into bear territory? Energy Economics, 32(2): 490-495. https://doi.org/10.1016/j.eneco.2009.08.018
[13] Arouri, M.E.H., Rault, C. (2012). Oil prices and stock markets in GCC countries: empirical evidence from panel analysis. International Journal of Finance & Economics, 17(3): 242-253. https://doi.org/10.1002/ijfe.443
[14] Filis, G. (2010). Macro economy, stock market and oil prices: do meaningful relationships exist among their cyclical fluctuations? Energy Economics, 32(4): 877-886. https://doi.org/10.1016/j.eneco.2010.03.010
[15] Nandha, M., Brooks, R. (2009). Oil prices and transport sector returns: an international analysis. Review of Quantitative Finance and Accounting, 33(4): 393. https://doi.org/10.1007/s11156-009-0120-4
[16] Lee, Y.H., Hu, H.N., Chiou, J.S. (2010). Jump dynamics with structural breaks for crude oil prices. Energy Economics, 32(2): 343-350. https://doi.org/10.1016/j.eneco.2009.08.006
[17] Hamilton, J.D. (2009). Understanding crude oil prices. The Energy Journal, 30(2). https://doi.org/10.5547/ISSN0195-6574-EJ-Vol30-No2-9
[18] Kilian, L., Park, C. (2009). The impact of oil price shocks on the US stock market. International Economic Review, 50(4): 1267-1287. https://doi.org/10.1111/j.1468-2354.2009.00568.x
[19] Bley, J., Chen, K.H. (2006). Gulf Cooperation Council (GCC) stock markets: The dawn of a new era. Global Finance Journal, 17(1): 75-91. https://doi.org/10.1016/j.gfj.2006.06.009
[20] Al-Khazali, O., Darrat, A.F., Saad, M. (2006). Intra-regional integration of the GCC stock markets: The role of market liberalization. Applied Financial Economics, 16(17): 1265-1272. https://doi.org/10.1080/09603100500426630
[21] Hammoudeh, S., Choi, K. (2006). Behavior of GCC stock markets and impacts of US oil and financial markets. Research in International Business and Finance, 20(1): 22-44. https://doi.org/10.1016/j.ribaf.2005.05.008
[22] Maghyereh, A., Al-Kandari, A. (2007). Oil prices and stock markets in GCC countries: New evidence from nonlinear cointegration analysis. Managerial Finance. https://doi.org/10.1108/03074350710753735
[23] Arouri, M.E.H., Fouquau, J. (2009). On the short-term influence of oil price changes on stock markets in GCC countries: Linear and nonlinear analyses. arXiv preprint arXiv:0905.3870. https://arxiv.org/abs/0905.3870
[24] Arouri, M.E.H., Jouini, J., Nguyen, D.K. (2011). Volatility spillovers between oil prices and stock sector return: Implications for portfolio management. Journal of International Money and Finance, 30(7): 1387-1405. https://doi.org/10.1016/j.jimonfin.2011.07.008
[25] Mohanty, S.K., Nandha, M., Turkistani, A.Q., Alaitani, M.Y. (2011). Oil price movements and stock market return: Evidence from the Gulf Cooperation Council (GCC) countries. Global Finance Journal, 22(1): 42-55. https://doi.org/10.1016/j.gfj.2011.05.004
[26] Louis, R.J., Balli, F. (2014). Oil price and stock market synchronization in gulf cooperation council countries. Emerging Markets Finance and Trade, 50(1): 22-51. https://doi.org/10.2753/REE1540-496X500102
[27] Pradhan, R.P., Arvin, M.B., Ghoshray, A. (2015). The dynamics of economic growth, oil prices, stock market depth, and other macroeconomic variables: Evidence from the G-20 countries. International Review of Financial Analysis, 39: 84-95. https://doi.org/10.1016/j.irfa.2015.03.006
[28] Ftiti, Z., Guesmi, K., Teulon, F., Chouachi, S. (2016). Relationship between crude oil prices and economic growth in selected OPEC countries. Journal of Applied Business Research (JABR), 32(1): 11-22. https://doi.org/10.19030/jabr.v32i1.9483
[29] Nwani, C., Iheanacho, E., Okogbue, C. (2016). Oil price and the development of financial intermediation in developing oil-exporting countries: Evidence from Nigeria. Cogent Economics & Finance, 4(1): 1185237. https://doi.org/10.1080/23322039.2016.1185237
[30] Khamis, R., Anasweh, M., Hamdan, A. (2018). Oil prices and stock market returns in oil exporting countries: Evidence from Saudi Arabia. International Journal of Energy Economics and Policy, 8(3): 301. http://www.econjournals.com/index.php/ijeep/article/view/6541.
[31] Ratti, R.A., Vespignani, J.L. (2016). Oil prices and global factor macroeconomic variables. Energy Economics, 59: 198-212. https://doi.org/10.32479/ijeep.8446
[32] Mukhtarov, S., Aliyev, S., Zeynalov, J. (2020). The effect of oil prices on macroeconomic variables: Evidence from Azerbaijan. International Journal of Energy Economics and Policy, 10(1): 72-80. https://doi.org/https://doi.org/10.32479/ijeep.8446
[33] Mo, B., Chen, C., Nie, H., Jiang, Y. (2019). Visiting effects of crude oil price on economic growth in BRICS countries: fresh evidence from wavelet-based quantile-on-quantile tests. Energy, 178: 234-251. https://doi.org/10.1016/j.energy.2019.04.162
[34] Van Eyden, R., Difeto, M., Gupta, R., Wohar, M.E. (2019). Oil price volatility and economic growth: Evidence from advanced economies using more than a century’s data. Applied Energy, 233: 612-621. https://doi.org/10.1016/j.apenergy.2018.10.049
[35] Wen, F., Min, F., Zhang, Y.J., Yang, C. (2019). Crude oil price shocks, monetary policy, and China's economy. International Journal of Finance & Economics, 24(2): 812-827. https://doi.org/10.1002/ijfe.1692
[36] Aloui, C., Hkiri, B., Hammoudeh, S., Shahbaz, M. (2018). A multiple and partial wavelet analysis of the oil price, inflation, exchange rate, and economic growth nexus in Saudi Arabia. Emerging Markets Finance and Trade, 54(4): 935-956. https://doi.org/10.1080/1540496X.2017.1423469
[37] Udemba, E.N. (2019). The triangular nexus causality among economic growth, trade, FDI and Oil Price: Time series analyses of Nigeria. OPEC Energy Review, 43(4): 470-491. https://doi.org/10.1111/opec.12165
[38] Kilicarslan, Z., Dumrul, Y. (2017). Macroeconomıc impacts of oil price shocks: an empirical analysis based on the svar models. Revista Economica, 69(5): 55-72.
[39] Oryani, B., Koo, Y., Rezania, S., Shafiee, A. (2021). Investigating the asymmetric impact of energy consumption on reshaping future energy policy and economic growth in Iran using extended Cobb-Douglas production function. Energy, 216: 119187. https://doi.org/10.1016/j.energy.2020.119187
[40] Luqman, M., Ahmad, N., Bakhsh, K. (2019). Nuclear energy, renewable energy and economic growth in Pakistan: Evidence from non-linear autoregressive distributed lag model. Renewable Energy, 139: 1299-1309. https://doi.org/10.1016/j.renene.2019.03.008
[41] Casamassima, G., Fiorello, D., Martino, A. (2009). The impact of oil prices fluctuactions on transport and its related sectors. European Parliament, Directorate General Internal Policies of the Union, Policy Department Structural and Cohesion Policies, Transport and Tourism, PE, 419.