Ipsita Saha* | Amit Kundu | Sadhan Kumar Ghosh
© 2020 IIETA. This article is published by IIETA and is licensed under the CC BY 4.0 license (http://creativecommons.org/licenses/by/4.0/).
OPEN ACCESS
The present study identifies the key antecedent factors for accomplishing the adoption stage of enterprise resource planning (ERP) systems in their business operations. Four potential antecedent factors of adoption were derived from the literature, and data were obtained from a sample of 200 executives of the banking organizations of the financial sector across India. A structural equation modeling (SEM) technique was used to examine the complex relationships between antecedents and the adoption decision. The authors survey the literature to discover and classify critical success factors that are potentially applicable to financial sector. Four broad parameters namely, strategic, organizational, technological, and environmental (SOTE) has been identified for the efficacious development of ERP system in the financial sector of India. 11 dimensions has emerged as significant one for the financial sector. The results show that most of the success factors found in the literature apply to the industry. Nevertheless, distinct differences were found as well. Some factors, such as innovativeness of the implementation strategy, formulation of sound business plan, integration within the departments, adaptation capability of the system etc. would become the key instruments for successful implementation of ERP in the financial sector. The findings can help the executives of the financial sector to focus their attention, priorities, resources and leadership on managing the success factors that have been established to be critical for achieving ERP project implementation and ultimately, leading to the development of the sustainable business model.
enterprise resource planning (ERP), financial sector, structural equation modeling (SEM), critical success factors, sustainable business model
In India, ERP has been implemented in various sectors for bigger transformation for globalization and deregulation of the economic prospect of our country [1]. Enterprise Resource Planning (ERP) systems impact the organizations in which they operate [2]. Like the ERP system which has centralized database with integration of different modules can represent the structure of any organization. Organizations and ERP systems have to be structurally aligned with each other [3]. During the implementation of ERP system, statistics says that 40-70% of ERP experienced some degree of failure [4]. The effect of the ongoing degradation of existing business models demand the redefining of parameters to achieve sustainable development. Successful businesses model enhances the constructs those are required to establish a business incorporating the challenges and opportunities faced towards sustainability [5]. Perera and Costa [6] affirmed that ERP implementation is often attended by significant socio-technical concerns. Top level executives of most companies have realized this and have started incorporating relevant parameters in respective departments regarding that. Sustainable business model basically describes that how customized models can be implemented with advanced technology to achieve any change in the system.
If organizations have their own Enterprise Resource Planning (ERP) system, they can adopt different business modules and can embed sustainability. But unfortunately, some business models are unable to introduce sustainable concept. According to WCED [7] sustainable business model requires the fulfillment of present needs but without neglecting the ability to satisfy the aspirations of future.
Montilva and Barrios [8] clearly explained regarding the modules those are integrated to establish a business model starting from organizational development to Business Process Reengineering. As Laudon et al. [9] and Nah et al. [10] stated that ERP system is a set of integrated software with a central database that have communication with necessary functional modules. To optimize the dynamic business model for successful ERP system, all the available constructs have been considered by developing an effective supply chain framework.
According to Jiwat et al. [11], the factors which are always under the direct attention of the managers and are primarily responsible for enhancing organizational performance are called Critical Success Factors (CSFs) [12]. In other words, CSFs are the factors those can help the managers to achieve the designated goal [13]. Jiwat and Corkindale [14], Rockart et al. [12], Saade and Nijher, [13] also agreed that CSFs those have been introduced in 1960, help industries to achieve their goals and their competitiveness to achieve optimize model enhances social perspective [12-14].
Zhang et al. [15] mentioned that many ERP projects got failed due to several reasons and scientists tried to identify the factors those are responsible for this failure. Though CSFs are highly related to the Information Systems domain, due to lack of proper identification some ERP system turns to unsuccessful after certain years. Numerous studies have been done [15] and scientists investigated the factors those might not be present in certain systems and absence of which the implementation process reached to dead loop. The evidences of ERP failure are distinctly mentioned in past reviews [16].
Identification of CSFs and analysis on those factors are the common practices at organizational level. Jiwat et al. [11] identified a large no. of factors throughout different literature. A good no. of authors uses subjective criteria to identify CSFs to bridge the gap between the ERP users and the developers by developing a conceptual framework. To optimize business model several major techniques like secondary data analysis, discussion with experienced practitioners, analysis of literature was considered [17].
The technology acceptance model (TAM) describes that how end users use technology for the requirement. In this regard, Perceived ease-of-use (PEOU) tells that "the degree to which a person believes that using a particular system would be free from effort" [18]. The researchers found that some numbers of external factors that would influence ERP acceptance and its usage throughout the system lifecycle.
According to Nah et al. [19] to get better use of ERP system the factors responsible for ERP users’ acceptance is highly required. The “Diffusion of innovations” is a theory that explains in which way new technologies can be spread out and what is the actual rate of broadcasting new ideas. Some factors like the innovation, communication channels, time, and a social system can affect the process that can influence the process of new ideas [20]. This idea can be used to implement the sustainability of a supply chain. Sustainable business model is all about the business practices to be taken into consideration as initiatives and efforts for the betterment of society [21].
To understand the intention of financial sector of India, several adaption techniques have been considered in the present study for the implementation of successful ERP system. Hence, the identification and enumeration of parameters that are responsible for developing a business model should be done. To establish a sustainable business model, the objectives are as follows:
i) To identify the parameters associated with strategic, organizational, technological and environmental perspective of financial organization.
ii) To find out the emergence of the factors with respective loading derived from the identified variables. iii) To find out the weightage of each parameter using exploratory factor analysis and to depict non-standardized coefficients pictorially.
iv)To find out standardized coefficients using confirmatory factor analysis and to depict standardized coefficients pictorially.
v) Based on the findings, the critical factors are required to be mapped to the broad domain of business model.
vi) A conceptual framework can be proposed that can be followed by the managers of financial sector to obtain successful ERP.
4.1 Questionnaire design
The questionnaire has been framed based on Likert-scaled items (5-point scale) on the broad domain like strategic, organizational, technological, and environmental perspectives. The questions were primarily framed based on literature review and then it was validated by concerned experts from academia and corporate executive who had in-depth knowledge and experience in schema design and implementation of ERP system. Pilot survey was taken among the executives of private and public sector banks who are using ERP system for more than seven years.
The identified parameters in each mentioned perspective with their code are listed in List 1.
List 1: Identified Parameters of SOTE model
[A] Strategic
BP101 Entrepreneurial Activity
BP102 Corporate goals and strategy
BP 103 Degree of inconvenience faced by non functioning of cross functional team
BP 104 Sharing information on system implementation
BP105 Degree of integrity
BP106 Level of concern for sustainable development
BP107 Level of participation to resolve coordination problem
BP108 Reward for leadership
[B] Organizational
BP201 Management readiness to change
BP202 Top management initiatives
BP 203 Coordination
BP204 Business plan/Vision of leader
BP205 Project justification based on tech. and economic scale
BP206 Information sharing between organization and SCM
BP 207 Organization readiness to change
BP208 Decision making on research based activity
BP 209 Enhancement of Employee Skills
BP 210 Participation of new employees on decision making
BP 211 Proactive management
[C] Technological
BP301 Degree of customization
BP 302 Level of accuracy of data
BP303 Level of formation of inter functional task forces
BP 304 Degree of enhancing business information
BP 305 Degree of Innovativeness
BP 306 Level of BPR
[D] Environmental
BP 401 Level of sharing ecological information
BP 402 Clients' review
BP 403 Degree of processing information
BP 404 Degree of waste generation in cloud storage
BP 405 Management’s role towards sustainability
BP 406 Degree of selection of suppliers
BP 407 Degree of awareness towards elimination of hazardous waste
4.2 Methodology of analyses
To design a novel business model for financial sector, the present study considered eleven distinct banks based on adaptation of sustainable practices to undertake the survey. The validated questionnaires were e-mailed to 200 executives, from which 135 responses were received. Among those some were discarded due to missing of responses in some queries. Ultimately, the sample size was 110.
Exploratory Factor Analysis (EFA) was done using SPSS 21.0 on collected dataset and construct’s validity has been measured by Confirmatory Factor Analysis (CFA) using AMOS 21.0A. Reliability of constructs has been estimated using Structural Equation Modeling (SEM). The reliability of SOTE model is measured for banking sector and Cronbach’s alpha = 0.9232 indicates that among the constructs satisfactory internal consistency exist [22].
5.1 Strategic perspective
5.1.1 Exploratory factor analysis (EFA)
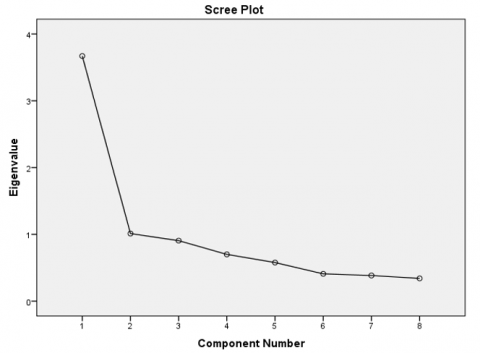
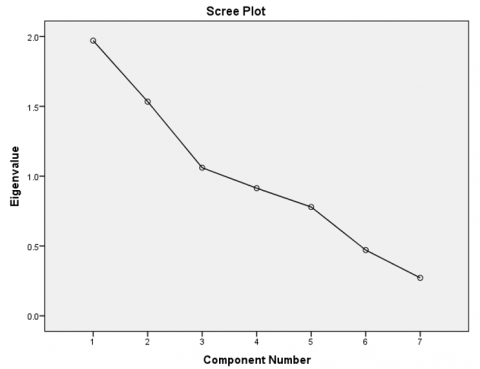
EFA is used not only to reduce data to a lesser set of variables but also to categorize the structure of the relationship. The scree plot is shown in Figure 1 and the result of EFA is shown in Table 2. The result exhibited Kaiser-Meyer-Olkin (KMO) of the sampling adequacy as 0.848 and can explain the variation at the level of 58.528 percent. According to Hutcheson and Sofroniou [23], if KMO value is more than 0.50, the sample size can be considered. Hence here the KMO value is quite good.
5.1.2 Output factor analysis of strategic perspective
The factor names and their corresponding variables are listed in Table 1. The findings of the factor analysis indicated that two factors, namely, Vision & Policies (F1), Intradepartmental Integrality (F2) have emerged as significant one for establishing sustainable supply chain management.
5.1.3 Confirmatory factor analysis (CFA)
Using AMOS 21.0 A the findings of CFA have been listed in Table 2.
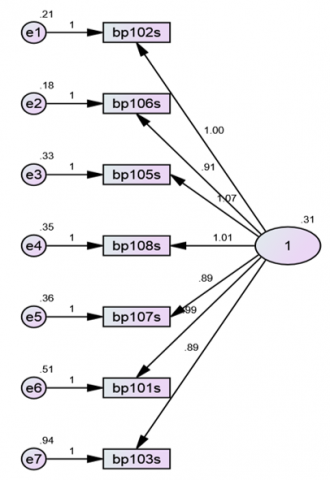
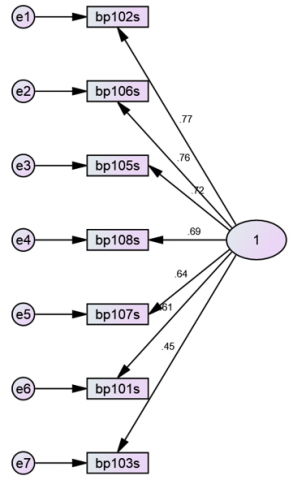
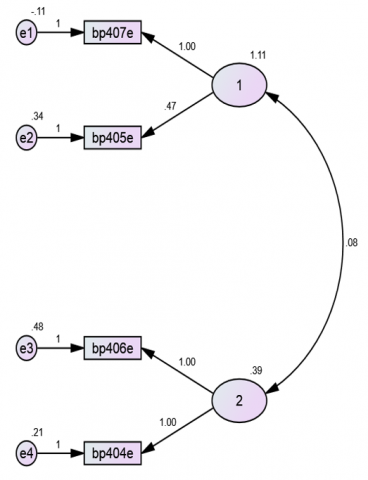
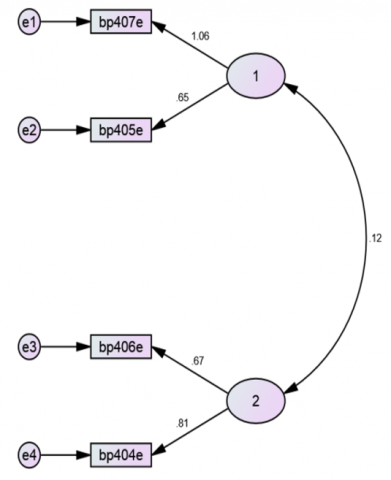
According to Schreiber et al. [24] and Kline [25] all the values indicate a reasonable fit. Figure 2 and Figure 3 can explain weightage of eight factors for strategic perspective in non-standardized and standardized coefficient format respectively while conducting Structural Equation Modeling.
Figure 1. Scree plot – EFA(Strategic) using SPSS 21.0
5.2 Organizational perspective
5.2.1 Exploratory factor analysis (EFA)
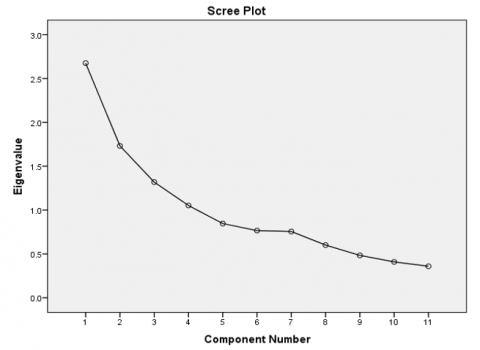
EFA is used not only to reduce data to a lesser set of variables but also to categorize the structure of the relationship. The scree plot is shown in Figure 4 and the result of EFA is shown in Table 3. The result exhibited Kaiser-Meyer-Olkin (KMO) of the sampling adequacy as 0.643 and can explain the variation at the level of 61.631 percent. According to Hutcheson and Sofroniou [23], if KMO value is more than 0.60, the sample size can be considered. Hence here the KMO value is quite good.
Table 1. Results of constructs & factor loading of strategic perspective using SPSS 21.0
|
Factor Name |
Variables |
Variable Description |
Factor F1 |
Factor F2 |
|
Vision & Policies |
BP102 |
Corporate goals and strategy |
0.802 |
|
|
BP106 |
Level of concern for sustainable development |
0.791 |
||
|
BP105 |
Degree of integrity |
0.76 |
||
|
BP108 |
Reward for leadership |
0.751 |
||
|
BP107 |
Level of participation to resolve coordination problem |
0.705 |
||
|
BP101 |
Entrepreneurial Activity |
0.675 |
||
|
BP103 |
Degree of inconvenience faced by non functioning of cross functional team |
0.536 |
||
|
Intradepartmental Integrity |
BP104 |
Sharing information on system implementation |
0.984 |
Table 2. Value of commonly reported fit statistics of strategic perspective using AMOS 21.0A CFA
|
Indicators |
Value of CFA |
|
CMIN- Chi-square value |
33.429 |
|
Probability Value P |
P<0.0001 |
|
DF-Degrees of freedom |
14 |
|
CMIN/DF- Ratio of Chi-square and the degree of freedom |
2.388 |
|
CFI- Comparative-Fit-Index |
0.946 |
|
IFI- Incremental Fit Index |
0.947 |
|
TLI- Tucker–Lewis Index |
0.920 |
|
GFI-Goodness of Fit Indicator |
0.940 |
Figure 2. Non-standardized coefficients (Strategic)
Figure 3. Standardized coefficients (strategic)
Table 3. Construct & factor loading of organizational perspective
|
Factor Loading |
||||||
|
Factor Name |
Variables |
Variable Description |
F1 |
F2 |
F3 |
F4 |
|
Initiative of Management in decision making and upgradation |
BP210 |
Participation of new employees on decision making |
0.766 |
|||
|
BP211 |
Proactive management |
0.702 |
||||
|
BP207 |
Organization readiness to change |
0.701 |
||||
|
BP209 |
Enhancement of Employee Skills |
0.508 |
||||
|
Techno-Economical Feasibility |
BP208 |
Decision making on research based activity |
0.802 |
|||
|
BP205 |
Project justification based on tech. and economic scale |
0.761 |
||||
|
BP203 |
Coordination |
0.738 |
||||
|
Business plan of Management |
BP204 |
Business plan/Vision of leader |
0.702 |
|||
|
BP201 |
Management readiness to change |
0.668 |
||||
|
Technology advancement and Network among Inter organizations |
BP202 |
Top management initiatives |
0.87 |
|||
|
BP206 |
Information sharing between organization and SCM |
0.466 |
||||
Figure 4. Scree plot – EFA (Organizational) using SPSS 21.0
5.2.2 Output factor analysis of orgaizational perspective
The factor names and their corresponding variables are listed in Table 3. The findings of the factor analysis indicated that four factors, namely, Initiative of Management in decision making and upgradation (F1), Techno-Economical Feasibility (F2), Business plan of Management (F3), Technology advancement and Network among Inter organizations (F4) have emerged as significant one for establishing sustainable supply chain management.
5.2.3 Confirmatory factor analysis (CFA)
To test the validity of the items CFA has been done using AMOS 21.0A [25, 26]. Hence as a measurement model, eleven latent constructs were used.
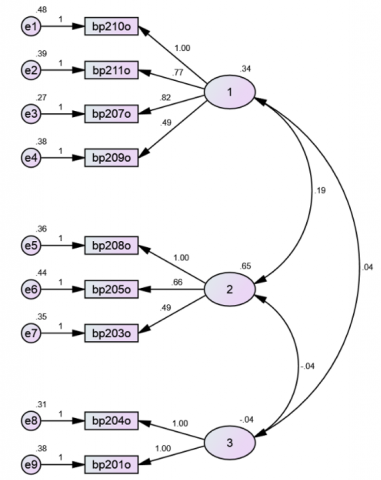
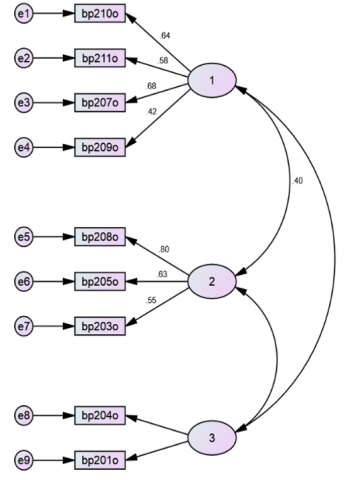
Table 4 describes the value of commonly reported fit statistics of organizational perspective using AMOS 21.0A confirmatory factor analysis. Figure 5 and Figure 6 can explain weightage of eleven factors for organizational perspective in non-standardized and standardized coefficient format respectively.
Table 4. Value of commonly reported fit statistics of organizational perspective using AMOS 21.0A CFA
|
Commonly reported fit measures |
Value of CFA |
|
Chi-square value (CMIN) |
42.444 |
|
Probability Value P |
P<0.0001 |
|
Degrees of Freedom (DF) |
25 |
|
The ratio of Chi-square and the degree of freedom (CMIN/DF) |
1.698 |
|
Comparative-Fit-Index (CFI) |
0.910 |
|
Incremental Fit Index (IFI) |
0.915 |
|
Tucker–Lewis Index (TLI) |
0.871 |
|
The Goodness of Fit Indicator (GFI) |
0.941 |
Figure 5. Non-standardized coefficients (organizational)
Figure 6. Standardized coefficients (organizational)
5.3 Technological perspective
5.3.1 Exploratory factor analysis (EFA)
EFA is used not only to reduce data to a lesser set of variables but also to categorize the structure of the relationship. The scree plot is shown in Figure 7 and the result of EFA is shown in Table 8. The result exhibited Kaiser-Meyer-Olkin (KMO) of the sampling adequacy as 0.602 and can explain the variation at the level of 50.103 percent. According to Hutcheson and Sofroniou (1999) [23], if KMO value is more than 0.60, the sample size can be considered. Hence here the KMO value is quite good.
Figure 7. Scree plot–EFA (Technological) using SPSS 21.0
5.3.2 Output factor analysis of technological perspective
The factor names and their corresponding variables are listed in Table 5. The findings of the factor analysis indicated that two factors, namely, Innovativeness and testing features (F1), Demand and correlation (F2) have emerged as significant one for establishing sustainable supply chain management.
Table 5. Construct & factor loading of technological perspective
|
Factor Name |
Variables |
Variable Description |
F1 |
F2 |
|
Innovativeness and testing features |
BP 305 |
Degree of Innovativeness |
0.793 |
|
|
BP 302 |
Level of accuracy of data |
0.727 |
||
|
BP 304 |
Degree of enhancing business information |
0.521 |
||
|
BP 306 |
Level of BPR |
0.415 |
||
|
Demand and co-relation |
BP 301 |
Degree of customization |
0.767 |
|
|
BP 303 |
Level of formation of inter functional task forces |
0.743 |
5.3.3 Confirmatory factor analysis (CFA)
To test the validity of the items CFA has been done using AMOS 21.0A [25, 26]. Hence, as a measurement model eight latent constructs were considered during the analysis.
Table 6. Value of commonly reported fit statistics of technological perspective using AMOS 21.0A confirmatory factor analysis
|
Commonly reported fit measures |
Value of CFA |
|
Chi-square value (CMIN) |
4.730 |
|
Probability Value P |
P<0.0001 |
|
Degrees of Freedom (DF) |
4 |
|
The ratio of Chi-square and the degree of freedom (CMIN/DF) |
1.182 |
|
Comparative-Fit-Index (CFI) |
.986 |
|
Incremental Fit Index (IFI) |
0.987 |
|
Tucker–Lewis Index (TLI) |
0.964 |
|
The Goodness of Fit Indicator (GFI) |
0.988 |
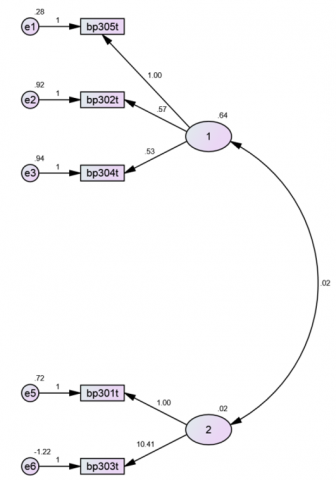
Figure 8. Non-standardized coefficients (technological)
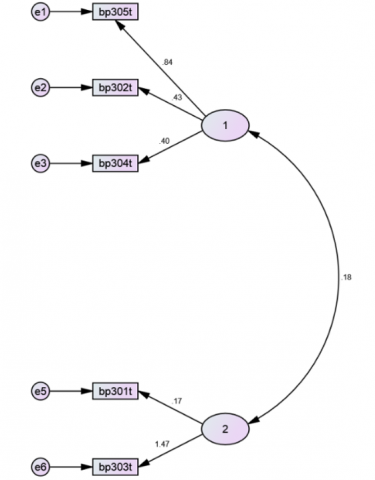
Figure 9. Standardized coefficients (technological)
Table 6 describes the value of commonly reported fit statistics of technological perspective using AMOS 21.0A confirmatory factor analysis. Figure 8 and Figure 9 can explain weightage of six factors for technological perspective in non-standardized and standardized coefficient format respectively.
5.4 Environmental perspective
5.4.1 Exploratory factor analysis (EFA)
EFA is used not only to reduce data to a lesser set of variables but also to categorize the structure of the relationship. The scree plot is shown in Figure 10 and the result of EFA is shown in Table 7. The result exhibited Kaiser-Meyer-Olkin (KMO) of the sampling adequacy as 0.520 and can explain the variation at the level of 65.204 percent.
Figure 10. Scree plot – EFA (Environmental) using SPSS 21.0
5.4.2 Output factor analysis of environmental perspective
The factor names and their corresponding variables are listed in Table 7. The findings of the factor analysis indicated that three factors, namely, Waste Reduction Strategy towards Sustainability (F1), Supplier selection towards processing wastes in cloud server (F2) and Ecological Sustainability (F3) have emerged as significant one for establishing sustainable supply chain management.
5.4.3 Confirmatory factor analysis (CFA)
To test the validity of the items CFA has been done using AMOS 21.0A [25, 26]. Hence, as a measurement model eight latent constructs were considered during the analysis.
Table 8 describes the value of commonly reported fit statistics of environmental perspective using AMOS 21.0A confirmatory factor analysis. Figure 11 and Figure 12 can explain weightage of seven factors for environmental perspective in non-standardized and standardized coefficient format respectively.
Table 7. Construct & factor loading of environmental perspective
|
Factor Loading |
|||||
|
Factor Name |
Variables |
Variable Description |
F1 |
F2 |
F3 |
|
Waste Reduction Strategy towards Sustainability |
BP 407 |
Degree of awareness towards elimination of hazardous waste |
0.882 |
||
|
BP 405 |
Management’s role towards sustainability |
0.873 |
|||
|
BP 402 |
Clients' review |
0.459 |
|||
|
Supplier selection towards processing wastes in cloud server |
BP 406 |
Degree of selection of suppliers |
0.846 |
||
|
BP 404 |
Degree of waste generation in cloud storage |
0.841 |
|||
|
BP 403 |
Degree of processing information |
0.47 |
|||
|
Ecological Sustainability |
BP 401 |
Level of sharing ecological information |
0.924 |
||
Table 8. Value of commonly reported fit statistics of environmental perspective using AMOS 21.0A confirmatory factor analysis
|
Commonly reported fit measures |
Value of CFA |
|
Chi-square value (CMIN) |
5.480 |
|
Probability Value P |
P<0.0001 |
|
Degrees of Freedom (DF) |
2 |
|
The ratio of Chi-square and the degree of freedom (CMIN/DF) |
2.740 |
|
Comparative-Fit-Index (CFI) |
.976 |
|
Incremental Fit Index (IFI) |
0.977 |
|
Tucker–Lewis Index (TLI) |
0.929 |
|
The Goodness of Fit Indicator (GFI) |
0.982 |
Figure 11. Non-standardized coefficients (environmental)
Figure 12. Standardized coefficients (environmental)
It may be inferred from Figure 3 that corporate goals and strategy (observable variable bp102) has the highest influence (standardized regression weight of 0.77) on the vision and policies for the ERP implementation in a financial sector organization. This is followed by the influence of the observable variable, bp106 (level of concern for sustainable development), with a standardized regression weight of 0.76. The aforesaid inferences imply that the objectives and the level of concern for sustainability, as defined by a financial sector organization, influences the vision and policies adopted for the ERP implementation within the organization.
In the context of the organizational perspectives, participation of new employees on decision making (bp210, Figure 6) has the highest influence on the initiative taken by management in decision making and upgradation (standardized regression weight of 0.64, Figure 6). The new generation of employees, being more aware of sustainability concerns, influences the management decisions within a financial sector organization; management is forced to pay heed to such concerns in its decisions. Decision making on research based activity (bp208, Figure 6) is the pivotal influencer of the level of decision making on research based activity, as perceived from the standardized regression weight of 0.80 in Figure 6.
Within the technological perspectives, the observable variable, bp305 (degree of innovativeness) is the greatest influence of the degree of innovativeness, the extent of use of business process reengineering and training from expertise to deliver error free product (as seen from the standardized regression weight of 0.84, Figure 9). Bp 302 (level of accuracy of data) or bp304 (degree of enhancing business information) do not seem to influence the aforementioned latent factor since their standardized regression weights, as observed from Figure 9, are less than 0.5.
It may be seen in Figure 12 that the degree of awareness towards elimination of hazardous waste (observable variable, bp407) has a higher standardized regression weight to the waste reduction strategy towards sustainability in the financial sector (latent factor number 1 in Figure 12). Increasing the awareness of the cloud storage vendors towards waste management, therefore, may be pivotal to the propagation of sustainable business practices towards waste reduction in ERP implementation in the financial sector.
Management’s role towards sustainability (observable variable, bp405) also seems to have a fairly pivotal (standardized regression weight, 0.65) value in the waste reduction strategy towards sustainability (latent factor number 1 in Figure 12). Government may formulate specific policies to increase the effective role of management in the reduction of waste in cloud servers. User activism has also been effective in forcing management towards a greater role in sustainability [27].
Client’s review (observable variable, bp402), that appeared to have a significant loading during EFA (Table 8), did not appear as a significant influence of the waste reduction strategy towards sustainability (as it does not appear in SE, Figure 12).
Bp406, the observable variable in Figure 12 (degree of selection of suppliers), seems to influence the factor named, “supplier selection towards processing wastes in cloud server” to a great extent (standardized regression weight of 0.67). Such an inference is logical since the diligence employed in choosing cloud storage vendors who reduce wastages would logically be beneficial for the sustainability of the financial sector organization. Similarly, bp404 (degree of waste generation in cloud storage) is bound to influence the sustainability of the organization, as indicated by a standardized regression weight of 0.841 shown in Figure 12.
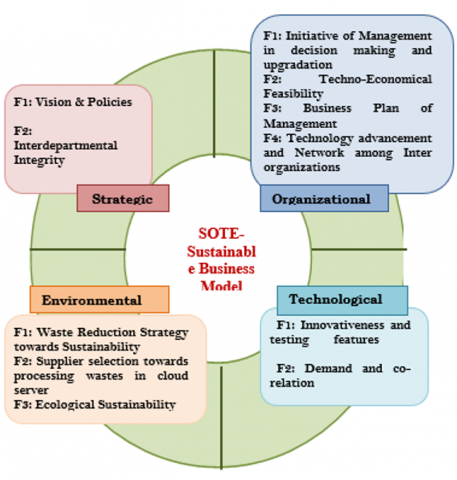
The preceding arguments and discussions may be presented in the form of a validated framework, as presented in Figure 13.
Figure 13. SOTE-sustainable business model for financial sector
It is inevitable to develop the sustainable business model for the overall growth of an organization. The present research has made an attempt to understand the most significant factors responsible for the development of sustainable business model through Enterprise Resource Planning (ERP) system. The factors clearly indicate the intention of the supply chain members, employees and also the customer’s orientation towards the sustainability of the financial organizations particularly. These sectors have understood the critical factors for establishment of a business model. The framework is based on strategic organizational, technological and environmental parameters. Until and unless, management understands the challenges of the business in future and express their willingness to act accordingly, the successful business model supported by technology would not be possible.
Future studies could test out the model (Figure 13) in industries other than the financial sector. Such studies may add certain new parameters to the model presented in this article. Herein also lies the shortcoming of the present study since it is in the context of the financial sector only. The findings of the study may not be extendable to countries other than India owing to the cultural differences between the various countries.
[1] Jaiswal, M.P., Sharma, A. (2001). Case study ERP systems extended to B2B e-business. Vision, 5(1): 46-54.
[2] Faisal, M.N., Banwetm, D.K., Shankar, R. (2006). An analysis of the dynamics of information risk in supply chains of select SME clusters. Vision, 10(4): 49-61. https://doi.org/10.1177/097226290601000404
[3] Priyadarshini, K. (2002). ERP-A paradigm shift. Vision: The Journal of Business Perspective, 6(1): 87-98. https://doi.org/10.1177/097226290200600110
[4] Franco, B.L., Signorelli, G.R., Trajano, G.S., de Oliveira, C.G. (2008). Acute effects of different stretching exercises on muscular endurance. Journal of Strength and Conditioning Research, 22(6): 1832-1837. https://doi.org/10.1519/JSC.0b013e31818218e1
[5] Willard, F.H., Vleeming, A., Schuenke, M.D., Danneels, L., Schleip, R. (2012). The thoracolumbar fascia: Anatomy, function and clinical considerations. Journal of Anatomy, 221(6): 507-536. https://doi.org/10.1111/j.1469-7580.2012.01511.x
[6] Perera, H.S.C., Costa, W.K.R. (2008). Analytic hierarchy process for selection of ERP software for manufacturing companies. Vision, 12(4): 1-11. https://doi.org/10.1177/097226290801200401
[7] WCED (1987). Report of the world commission on environment and development: Our common future, pp. 1-247. https://digitallibrary.un.org/record/139811.
[8] Montilva, J.C., Barrios, J.A. (2004). BMM: A business modeling method for information systems development. The Clei Electronic Journal, 7(2): 23-44.
[9] Laudon, K.C., Laudon, J.P., Ahmed, E. (2013). Management Information System: Managing the Digital Firm. New York: Prentice Hall.
[10] Nah, F.F.H., Lau, J.L.S., Kuang, J. (2001). Critical factors for successful implementation of enterprise systems. Business Process Management Journal, 7(3): 285-296. https://doi.org/10.1108/14637150110392782
[11] Jiwat, R., Corkindale, D., Wu, M. (2013). Implementation critical success factors (CSFs) for ERP: Do they contribute to implementation success and post-implementation performance. International Journal of Production Economics, 144(1): 157-174. https://doi.org/10.1016/j.ijpe.2013.01.032
[12] Rockart, J.F., Earl, M.J., Ross, J.W. (1996). The new IT organization: Eight imperatives. Retrieved: https://dspace.mit.edu/bitstream/handle/1721.1/2623/SWP-3902-40987801-CISR-292.pdf.
[13] Saade, R.G., Nijher, H. (2016). Critical success factors in enterprise resource planning implementation: A review of case studies. Journal of Enterprise Information Management, 29(1): 72-96. https://doi.org/10.1108/JEIM-03-2014-0028
[14] Jiwat, R., Corkindale, D. (2014). How ‘critical’ are the critical success factors (CSFs)? Examining the role of CSFs for ERP. Business Process Management, 20(1): 151-174. https://doi.org/10.1108/BPMJ-11-2012-0127
[15] Zhang, J.J., Joglekar, N.R., Verma, R. (2012). Exploring resource efficiency benchmarks for environmental sustainability in hotels. Cornell Hospitality Quarterly, 53(3): 229-241. https://doi.org/10.1177/1938965512441165
[16] Holland, C., Light, B. (1999). A critical success factors model for ERP implementation. IEEE Software, 16(3): 30-36. https://doi.org/10.1109/52.765784
[17] Beaubouef, T., Petry, F., Yager, R.R. (2011). Attribute generalization with rough set hierarchies. In Proceedings of the World Conference on Fuzzy Computing, San Francisco, pp. 222-227.
[18] Davis, F. (1989). Perceived usefulness, perceived ease of use, and user acceptance of information technology. MIS Quarterly, 13(3): 319-340. https://doi.org/10.2307/249008
[19] Nah, F.F., Tan, X., Teh, S.H. (2004). An empirical investigation on end-users' acceptance of enterprise systems. Information Resources Management Journal, 17(3): 32-53.
[20] Rogers E.M. (1983). Diffusions of Innovation (3rd Edition). The Free Press, A Division of Macmillan Publishing co, Inc. New York.
[21] Høgevold, N.M., Svensson, G., Padin, C. (2015). A sustainable business model in services: An assessment and validation. International Journal of Quality and Service Sciences, 7(1): 17-33. https://doi.org/10.1108/IJQSS-09-2013-0037
[22] Cronbach, L.J., Meehl, P.E. (1955). Construct validity in psychological tests. Psychological Bulletin, 52(1): 281-302.
[23] Hutcheson, G., Sofroniou, N. (1999). The Multivariate Social Scientist: Introductory Statistics Using Generalized Linear Models. Thousand Oaks, CA: Sage Publication.
[24] Schreiber, J.B., Nora, A., Stage, F.K., Barlow, E.A., King, J. (2006). Reporting structural equation modeling and confirmatory factor analysis results: A review. The Journal of Educational Research, 99(6): 323-338. https://doi.org/10.3200/JOER.99.6.323-338
[25] Kline, R.B. (2011). Principles and Practice of Structural Equation Modeling. New York: Guilford Press.
[26] Byrne, B.M. (2010). Structural Equation Modeling with AMOS: Basic Concepts, Applications, And Programming. London: Routledge Taylor & Francis Group.
[27] Barclay, K., Miller, A. (2018). The sustainable seafood movement is a governance concert, with the audience playing a key role. Sustainability, 10(1): 180. https://doi.org/10.3390/su10010180